HAL Id: halshs-01512678
https://halshs.archives-ouvertes.fr/halshs-01512678
Preprint submitted on 24 Apr 2017HAL is a multi-disciplinary open access
archive for the deposit and dissemination of sci-entific research documents, whether they are pub-lished or not. The documents may come from teaching and research institutions in France or abroad, or from public or private research centers.
L’archive ouverte pluridisciplinaire HAL, est destinée au dépôt et à la diffusion de documents scientifiques de niveau recherche, publiés ou non, émanant des établissements d’enseignement et de recherche français ou étrangers, des laboratoires publics ou privés.
To cite this version:
Johanna Choumert, Pascale Combes Motel, Charlain Guegang Djimeli. The biofuel-development nexus: A meta-analysis. 2017. �halshs-01512678�
C E N T R E D'E T U D E S E T D E R E C H E R C H E S S U R L E D E V E L O P P E M E N T I N T E R N A T I O N A L
SÉRIE ÉTUDES ET DOCUMENTS
The biofuel-development nexus: A meta-analysis
Johanna Choumert
Pascale Combes Motel
Charlain Guegang Djimeli
Études et Documents n° 9
April 2017
To cite this document:
Choumert J., Combes Motel P., Guegang Djimeli C. (2017) “The biofuel-development nexus: A
meta-analysis ”, Études et Documents, n° 9, CERDI.
http://cerdi.org/production/show/id/1870/type_production_id/1
CERDI
65 BD. F. MITTERRAND
63000 CLERMONT FERRAND – FRANCE TEL.+33473177400
FAX +33473177428
2
The authors
Johanna Choumert
Head of Research - Economic Development Initiatives (E.D.I.), High Wycombe, United
Kingdom / Bukoba, Tanzania.
E-mail:
[email protected]
Pascale Combes Motel
Professor - School of Economics & CERDI, University Clermont Auvergne - CNRS,
Clermont-Ferrand, France.
E-mail:
[email protected]
Charlain Guegang Djimeli
Économiste-Statisticien à la Direction générale de l'économie et de la programmation des
investissements publics - Ministry of the Economy, Planning and Regional Development of
Cameroon, DPPP/DGEPIP/MINEPAT BP 660 Yaoundé – Cameroon.
E-mail:
[email protected]
Corresponding author: Pascale Combes Motel
Études et Documents are available online at:
http://www.cerdi.org/ed
Director of Publication: Grégoire Rota-Graziosi
Editor: Catherine Araujo Bonjean
Publisher: Mariannick Cornec
ISSN: 2114 - 7957
Disclaimer:
Études et Documents is a working papers series. Working Papers are not refereed, they constitute
research in progress. Responsibility for the contents and opinions expressed in the working papers rests solely with the authors. Comments and suggestions are welcome and should be addressed to the authors.
3
Abstract
While the production of biofuels has expanded in recent years, findings in the literature on
its impact on growth and development remain contradictory. This paper presents a
meta-analysis of computable general equilibrium studies published between 2006 and 2014. Using
26 studies, we shed light on why their results differ. We investigate factors such as biofuel
type, geographic area and the characteristics of models employed. Our results indicate that
the outcomes of CGE simulations are sensitive to model parameters and also suggest
heterogenous effects of biofuel expansion between developed / emerging countries and
Sub-Saharan African countries. Our quantitative meta-analysis complements existing
narrative surveys and confirms that results are sensitive to key hypotheses on essential
parameters. Simulations on longer time periods and in multi-country studies lead to results
that indicate higher impacts of biofuel expansion on growth and household income.
Moreover, simulations with a shock in agricultural productivity indicate positive welfare
gains, unlike simulations with a shock on land expansion. Lastly, we find that biodiesels lead
to higher welfare gains than biofuels.
Keywords
Biofuel, Bioethanol, Biodiesel, Energy, Development, Meta-regression, Computable General
Equilibrium Model.
JEL codes
Q16, O13, C68 .
Acknowledgements
We thank the ANR (project REVE, ANR-14-CE05-0008) and the French Ministry of Research
for their financial support.
The authors wish to thank participants of the What Works Global Summit 2016 (London
26-28 September 2016) as well as an anonymous referee from the French Association of
Environmental and Resource Economists for their useful suggestions.
1. Introduction
Many authors have documented the complex relationship between energy and economic development. To date, no consensus has been reached regarding this so-called energy-development nexus which has mainly focused on evidencing a causal relationship between energy consumption and economic growth (see e.g. the review of Ozturk, 2010). Two avenues of research are still opened. One strand of the literature focuses on the demand aspects of energy consumption while the literature on energy transition (energy ladder) describes qualitative and quantitative changes in energy consumption and analyses how households switch from traditional to modern fuels (e.g., Leach, 1992 or van der Kroon et al. 2013). It also provides a framework for the implementation of enhanced energy services. Another strand of the literature focuses on supply issues. One crucial question is related to the Malthusian-like issue of the availability of fossil energies and whether they might be a growth-limiting factor (Carbonnier and Grinevald, 2011). Access to energy has also recently been targeted by global development policies. It was not a key component of the Millennium Development Goals, but in 2012 the United Nations “Sustainable Energy for All” Initiative (universal energy access, renewable energy, and energy efficiency) renewed the interest for initiatives to reduce energy poverty. In 2015, Sustainable Development Goal #7 (Ensure access to affordable, reliable, sustainable and modern energy for all) made room for energy initiatives in development policy objectives. Biofuels are serious candidates for addressing global energy objectives. They received substantial attention in climate mitigation initiatives in the transport sector, and targets were reported by the Intended Nationally Determined Contributions (INDCs) to the UNFCCC1 Secretariat: about 40% of INDCs submitted by countries in 2015 relied on biofuels (Gota et al., 2015). The use of biofuels might reshape several crucial issues such as energy security and climate mitigation as well as the development energy nexus, especially in developing countries. Indeed, biofuel expansion can be seen as a means of transforming national dependence on biomass into an additional source of income and job generating activities, particularly in countries where poverty pervades. In addition, biofuel production may be a key element for energy security in countries that are net importers of energy. Moreover, since biofuel cropping uses atmospheric carbon dioxide, biofuels may contribute to mitigating greenhouse gas (GHG) emissions. Further environmental benefits may also be gained if biofuel expansion pushes up land values and incentivizes land upgrading.
However, more pessimistic views on the consequences of biofuel expansion have also been put forth. First, weak land governance is a pull factor of Foreign Direct Investments (FDIs) and is therefore reputed to contribute to land rush (e.g., Arezki et al., 2013). Deleterious effects on unwritten customary land rights have been reported, especially in Africa, where biofuel production has been a key driver of the rising demand for land allocated to large-scale cultivation of biofuels (Toulmin, 2009). Second, demand for biofuel cropping may induce increases in agricultural feedstock prices (Rosegrant et al., 2008). Food security may be imperiled in countries where the food expenditure share of household income is high, such as in
Sub Saharan African countries (Chauvin et al., 2012). Third, the influential paper written by Searchinger et al. (2008) questioned the positive influence of biofuels on the environment2 and pointed out that biofuel production competes for land, which generates indirect land use changes and contributes to GHG emissions. In short, biofuel expansion is a much-debated issue that deserves further study in the literature. This paper contributes to the debate while focusing on the income generating effect of biofuel production.
Why concentrate on income generating effect of biofuel production? The main reason is that it has dramatic implications in developing countries especially those that need to jointly reach development objectives and manage environmental constraints. Biofuel policies have been endorsed by many countries. Several African countries have tried to implement attractive conditions for biofuel producers owing to their land abundance, for instance Tanzania and Mozambique (Amigun et al., 2011; Arndt et al., 2011). Land abundance is a key aspect of Brazil agricultural and energy policy (e.g., Stattman et al., 2013) as well as Asian major biofuel producers (Kumar et al., 2013).
How to assess financial consequences of biofuel production? A recent upsurge in biofuel production makes it difficult to evaluate ex post the consequences of biofuel expansion on national and household incomes.3 Simulation exercises and computable general equilibrium (CGE) modeling have attractive features as policy analysis tools and allow to focus on several key aspects of biofuel expansion. First, biofuel expansion is a worldwide phenomenon and CGE modeling allows to easily take international interdependencies into account. Second, at the national level, biofuel expansion cannot be studied in isolation from other sectors of national economies (Kretschmer and Peterson, 2010). In other words, CGE modeling allows for modeling a variety of feedback or indirect effects induced by biofuel policies.
CGE modeling results played a crucial role in the “fuel versus food” debate (see e.g., Chakravorty et al., 2009) and study results have widely differed. One crucial question, therefore, emerges of whether the results are sensitive to parameters, modeling choices, results reporting or data assumptions. The objective of this paper is to examine the impact of biofuel policies on growth and household welfare. In contrast to existing studies and surveys on the topic (e.g., Gasparatos et al. 2015 ; Ji and Long, 2016), we address the subject with a meta-analysis. To the best of our knowledge, ours is the first meta-analysis on the topic of biofuel and development. In addition, our study focuses on CGE results.
The remainder of the paper is organized as follows. Section 2 discusses the use of a meta-analysis. Section 3 is devoted to the construction of the database. Section 4 develops the empirical strategy and economic results. Section 5 presents the results and Section 6 concludes.
2 This paper has been quoted more than 3,800 times as of September 2016. 3 There are several exceptions. See for instance Andrade de Sá et al. (2013).
2. Meta-analysis
2.1. Definition of meta-analysis
A meta-analysis or meta-regression analysis (MRA) is a quantitative summary of empirical studies on a precise topic (Paldam, 2015; Stanley, 2001). The empirical literature on the impact of the expansion of biofuels on development includes dozens of studies which cannot be fully captured in a narrative survey. Therefore, conducting an MRA on the topic will complement narrative reviews and facilitate the understanding of factors that contribute to the different outcomes of existing studies. This approach also helps us to avoid the so-called “myth of the perfect study” which can be found in narrative reviews where researchers select studies based on idiosyncratic judgments (Hunter and Schmidt, 2004).
The usual way of checking the results obtained in any applied work is to perform robustness tests or sensitivity analyses such as running alternative estimators, using alternative measures of interest variables or varying the geographical coverage of the dataset in econometric studies. Robustness tests can also take the form of elaborating additional scenarios or changing key parameter values in CGE simulation exercises. Conducting an MRA can be considered more thorough than robustness tests, which relate only to the sets of hypotheses made in one study. MRAs are meta-robustness analyses in the sense that they are deemed to comprehensively collect the set of hypotheses used in the existing literature. While robustness analyses mainly allow for checking the sensitivity of results to a set of particular hypotheses, MRAs help to identify the hypotheses that drive the results and explain their heterogeneity (Nelson and Kennedy, 2008, p. 346).
An MRA should be conducted according to the following steps (Nelson and Kennedy, 2008; Stanley et al., 2013): formulation of the topic, design of the protocol for the selection of studies, definition of the economic outcome (effect size) and explanatory variables (moderators), and extraction of the data and analysis.
2.2. Recent meta-analysis on energy-related topics
The contribution of our MRA is twofold. First, to the best of our knowledge, it is the first MRA on biofuels and development. Second, our primary studies rely on general equilibrium modeling, although most MRAs are based on econometric studies.
Although our MRA is original, a large number of MRAs have been conducted on energy-related topics. Several MRAs investigate the causality between energy use (production/consumption) and economic output/GDP (Bruns et al., 2013 ; Chen et al., 2012 ; Kalimeris et al., 2014 ; Menegaki, 2014). These MRAs do not provide a clear-cut answer on the causality relationship and its direction. Other MRAs focus on energy demand, i.e., from the perspective of experimental studies (Delmas et al., 2013) or in terms of residential consumption (Lampin, 2012). Still others explore fuel/gasoline consumption (price and income elasticities) (Espey, 1998; Goodwin et al., 2004; Havranek et al., 2012; Stern, 2009). Given the recent growth of the literature on renewable energies, there are fewer MRAs on this topic and these are very recent publications. Sebri (2015) examines 40 primary studies on the renewable energy consumption-economic growth nexus and finds a significant difference of short-term versus long-term
causality and differences according to the type of data and model specification. Soon and Ahmad (2015) analyze 18 studies estimating the willingness-to-pay for renewable energy use of households.
While most MRAs (like those on energy previously mentioned) gather information from studies using econometric estimations, we focus on studies based on general equilibrium modeling. Despite the rapid development of meta-analysis in economics, very few MRAs extract information from general equilibrium simulations. They cover different topics such as trade liberalization (Hess and von Cramon-Taubadel, 2008) or climate change policies (Barker et al., 2002; Branger and Quirion, 2014; Rose and Dormady, 2011). More closely related to our topic, Condon et al. (2015) conducted a meta-analysis of U.S. biofuel policy with a focus on the impact of corn expansion on corn prices using 29 studies (157 estimates) published since 2007.
3. Construction of the database
3.1. Sampling procedure and sample characteristics
This MRA is based on 26 studies (see Annex 1) published between 2006 and 2014. To conduct our bibliographic research, we entered keywords such as ‘Biofuels AND Poverty’, ‘Biofuel AND General Equilibrium’, ‘Biodiesel AND Poverty’, ‘Bioethanol AND Development’ in bibliographic databases such as Science Direct, Google Scholar, etc. Using this list of studies, we performed snowballing and obtained a pool of 150 papers. We then applied inclusion and exclusion criteria to publications, e.g., those including only general equilibrium studies, having simulations of biofuels, and having a measure of household income or growth. A collection grid was then used to codify the information from each article. Two databases were created, one for the impact of biofuel on GDP growth and one for the impact on household income. Although most variables are common to the two databases, there are variables specific to each one. The last step in the construction of these databases was the processing of the data, coding and labelling the variables, and searching and correcting errors in entries.
3.2. Effect sizes
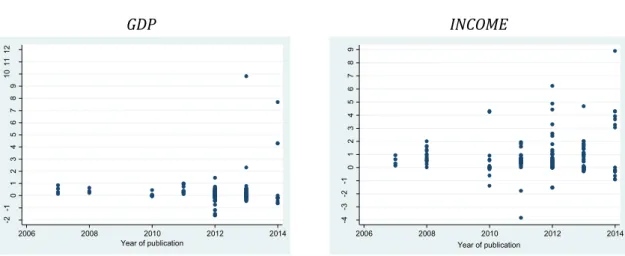
An effect size (ES) is an outcome measure common to all primary studies. We have two different outcomes (hence two types of ESs) measuring the effect of biofuel expansion on economic development: GDP is the variation of the GDP growth rate (percentage points); INCOME is the variation of household income growth rate (percentage points).4 Each simulation generates a welfare variation for a single or multiple regions. An ES is the welfare change for one individual country.5 See Table 1 for summary statistics of ESs. The range of estimates is very wide and illustrates the lack of consensus in the literature (Figure 3).
In MRAs relying on econometric estimations, it is recommended to use a measure of precision for the ESs, usually standard errors of estimates or sample size (Doucouliagos and Ulubaşoğlu, 2008; Stanley and Doucouliagos, 2012; Sterne and Egger, 2001). As our focus is CGE studies, such measures of precision are not relevant.
Table 1. Descriptive statistics of effect sizes
Variable Obs Mean SD Min Max
GDP 227 0.18 0.98 -1.62 9.82
INCOME 255 0.57 1.22 -3.84 8.90
3.3. Moderators
To explain the variability of ESs, we use various moderators providing information on the characteristics of publications, countries, models and scenarios (Table 2).
4 Note that some studies provide the two types of ESs while others provide one GPD or INCOME. See Annex
2 for a detailed list.
Table 2. List of moderators
Variable Description
Publication characteristics
Year Year of publication
Article = 1 if published article; =0 if working paper or report
Geographical area
Africa = 1 if African country
Europe = 1 if European country
Asia = 1 if Asian country
South_america = 1 if South American country North_america = 1 if North American country
OECD = 1 if OECD country
GDP_cap GDP per capita of the country (source: World Bank Data 2014)
Model characteristics
Time_estimation Number of years of the simulation Multi_country = 1 if multi-countries model
Dynamic = 1 if dynamic model; = 0 if static or recursive dynamic model
GTAP = 1 if GTAP model
MIRAGE = 1 if MIRAGE model
Model_other = 1 if model other than GTAP or MIRAGE Armington = 1 if Armington specification
Scenario
Land = 1 if scenario with expansion of land allocated to biofuels
Land_surface Expansion rate of land allocated to biofuels*surface of the country Productivity = 1 if scenario with an increase of the agricultural productivity or biofuel productivity
Biofuel type
Bioethanol = 1 if bioethanol only Biodiesel = 1 if biodiesel only
Biodiesel_bioethanol = 1 if biodiesel and bioethanol
Type of households (for INCOME only)
HH_rural_urban = 1 if rural and urban households
HH_rural = 1 if rural households
HH_urban = 1 if urban households
HH_poor_rich = 1 if poor and rich households
HH_poor = 1 if poor households
Table 3. Descriptive statistics
GPD (N=227) INCOME (N=255)
Variable Mean Std. Dev. Min Max Mean Std. Dev. Min Max
Year 2,012 1.3 2,007 2,014 2011 1.6 2007 2014 Article 0.5 0.5 0 1 0.36 0.48 0 1 Africa 0.3 0.46 0 1 0.64 0.48 0 1 Europe 0.18 0.39 0 1 0.04 0.19 0 1 Asia 0.22 0.42 0 1 0.16 0.37 0 1 South_america 0.12 0.32 0 1 0.08 0.27 0 1 North_america 0.17 0.38 0 1 0.08 0.27 0 1 OECD 0.33 0.47 0 1 0.12 0.32 0 1 GDP_cap 14,185.47 16,830.85 162.81 47,001.56 5,693.92 12,370.81 162.81 46,437.07 Time_estimation 11.25 5.41 1 29 11.15 4.55 1 20 Multi_country 0.53 0.5 0 1 0.09 0.29 0 1 Dynamic 0.26 0.44 0 1 0.22 0.41 0 1 GTAP 0.56 0.5 0 1 0.1 0.3 0 1 MIRAGE 0.27 0.44 0 1 0.64 0.48 0 1 Model_other 0.17 0.37 0 1 0.27 0.44 0 1 Armington 0.87 0.34 0 1 0.85 0.36 0 1 Land 0.24 0.43 0 1 0.57 0.49 0 1 Land_surface 17,800,000 38,500,000 0 110,000,000 50,200,000 50,700,000 0 110,000,000 Productivity 0.13 0.34 0 1 0.32 0.47 0 1 Bioethanol 0.07 0.26 0 1 0.22 0.41 0 1 Biodiesel 0.25 0.43 0 1 0.5 0.5 0 1 Biodiesel_bioethanol 0.68 0.47 0 1 0.29 0.45 0 1 HH_rural_urban 0.42 0.49 0 1 HH_rural 0.31 0.46 0 1 HH_urban 0.27 0.45 0 1 HH_poor_rich 0.47 0.5 0 1 HH_poor 0.27 0.44 0 1 HH_rich 0.27 0.44 0 1
Publication characteristics
As shown in Figure 1, studies on the topic are recent and their number has increased over time. There are 23 primary studies for GDP and 22 for INCOME (with some overlapping, see Annex 1 and Annex 2). This notable increase in the number of publications from 2010 perhaps reflects the evolution of the production of biofuels as shown in Figure 2
.
(For an analysis of the determinants of biofuel production, see, for instance, Kere, 2016). We can presume that this increasing interest in the topic reflects the surge in production and associated debates within the policy arena. In their “Review of Ecological and Socioeconomic Effects of Biofuel and Energy Policy Recommendations”, Ji and Long (2016) selected 124 papers (published after 2004) to review, and it appears that 66% were published after 2011, corroborating this increased interest in biofuel-related research.Figure 1. Number of primary studies over time
GDP INCOME 0 1 2 3 4 5 6 7 8 N umb er of p rima ry st ud ie s 2007 2008 2010 2011 2012 2013 2014 Year of publication 0 1 2 3 4 5 N umb er of p rima ry st ud ie s 2007 2008 2010 2011 2012 2013 2014 Year of publication
Figure 2. Evolution of biofuel production in the world (2000-2012)
Source: International Energy Statistics of the U.S. Energy Information Administration6
6 http://www.eia.gov/cfapps/ipdbproject/IEDIndex3.cfm?tid=79&pid=79&aid=1 (last consulted 08/07/2016).
The evolution of ESs over time is shown in Figure 3. Their distribution illustrates the contrasting results on the impact of biofuels on development and poverty found in literature reviews (e.g., Ji and Long, 2016). Not only has the number of studies increased over time (and therefore the number of ESs) but also the interval of the values taken by the ESs. This may be explained by the following hypotheses: (i) As there are more studies, the likelihood of finding more varying results increases (ii) Over time the enthusiasm for biofuels has been challenged and it has become more acceptable to publish negative results (see the Introduction for an overview of pessimistic views on biofuels).
Figure 3. Evolution of ESs over time
GDP INCOME -2 -1 0 1 2 3 4 5 6 7 8 9 10 11 12 Ef fe ct si ze s G D P 2006 2008 2010 2012 2014 Year of publication -4 -3 -2 -1 0 1 2 3 4 5 6 7 8 9 Ef fe ct si ze s I N C O ME 2006 2008 2010 2012 2014 Year of publication
The number of ESs per paper varies from 1 to 56 with an average of 11.5 for INCOME and from 1 to 35 with an average of 20 for GDP. This is explained by the fact that authors run several scenarios (this will be addressed in Section
4
).Regarding the publication type, we differentiate between, on the one hand, published articles and, on the other hand, working papers and institutional papers. We suspect that ESs published in peer-reviewed articles will take more “conventional” values than ESs published in others formats such as working papers. This also relates to the recurrent publication bias which is faced in meta-analysis. There may be a bias in the reporting of results depending on their sign or intensity. The sources of publication bias are diverse and complex as they depend on the behavior of authors, referees and editors. See Stanley et al. (2008) and Stanley and Doucouliagos (2012) for discussions on the publication bias and the “file drawer” problem.
Geographical area
We include several variables to control for the geographical area and the level of economic development of countries: (i) Binary variables for the continent where each country is located (ii) An OECD variable indicating whether the country belongs to the OCED (iii) A variable for the GDP per capita of the country. The driving forces behind biofuel expansion differ between countries and may lead to different outcomes on growth and household income. Biofuel production has followed different patterns across countries, with the USA being the largest ethanol producer and the European Union being the largest biodiesel producer. Public policies,
tax exemptions, subsidies and mandatory blending targets play key roles in these expansions. See Sorda et al. (2010) for an overview of policies implemented in North America, South America, Europe, Asia and Australia. Gasparatos et al. (2015) provide an overview of the development of biofuel policies in Sub-Saharan Africa, which have been partly stimulated by FDIs.
Model characteristics
CGE models can be static, dynamic or recursive dynamic. We have chosen to construct a binary variable Dynamic =1 if the model is dynamic and =0 if the model is static or recursive dynamic. These differences reflect different assumptions of agents’ expectations. In static models, economic agents are myopic and do not look forward, i.e., beyond the current period, to make decisions. In recursive dynamic settings, the model is solved following two steps. First, through a “within-period” static CGE framework and through a “between-period” model. In such models, it is assumed that agents cannot behave according to perfect foresight. In dynamic CGE models, agents are forward looking and their intertemporal behavior is taken into account. Such a framework tends to be used for simulations focusing on intertemporal resource allocation questions, such as climate change (Babiker et al., 2009; Dixon and Jorgenson, 2013, Chap. 5; Scollay and Gilbert, 2000).
In the CGE literature the main models used are the GTAP and the MIRAGE models (GTAP,
MIRAGE). The GTAP (Global Trade Analysis Project)7 model is the standard CGE model. It is multiregion, multisector, with perfect competition and constant returns to scale. The MIRAGE (Modelling International Relationships in Applied General Equilibrium)8 model is also a multiregion, multisector CGE model with a sequential dynamic set-up, imperfect competition, product differentiation by variety and by quality, and foreign direct investment (Bchir et al., 2002). Other models used are EXTER (Boccanfuso et al., 2013; Decaluwé et al., 2001), MEGABARE9 (see Dixon and Jorgenson, 2013), ORANI (Dixon and Jorgenson, 2013), the TERM-BR (general equilibrium model of Brazil) model (Ferreira Filho, 2011), and the TIGER10 (The Trade Integrated Global Energy and Resources) model (See Gunatilake et al., 2014).
Most papers rely on an Armington specification allowing domestic and imported goods to be modeled as imperfect substitutes. Standard Armington elasticities in GTAP models are low compared to other models. Simulations on international trade tend to find lower welfare gains when relying on GTAP values (Hess and von Cramon-Taubadel, 2008).
The biofuel-development nexus has been investigated through multiregion (multi_country) models as well as through single-region models. Single-region models seem more appropriate for studies on a specific topic in a small region. However, using single-region CGE models, may lead researchers to ignore effects and feedback from other regions of the world and may therefore cause misleading interpretation of results (Dixon and Jorgenson, 2013). “Single-country GEs generally do not allow for endogenous capital inflows and they often assume fixed
7 https://www.gtap.agecon.purdue.edu/models/current.asp 8 http://www.mirage-model.eu/
9 MEGABARE model is developed by Australian Bureau of Agricultural and Resource Economics (Lee et
al., 2007)
10 “The TIGER model is based on the World Bank's LINKAGE model, elaborated to take fuller account of
energy generally and biofuels in particular” (Gunatilake et al., 2014). The LINKAGE model is a dynamic CGE based on GTAP data.
trade balances and exchange rates. They might therefore be expected to generate lower welfare gains than multi-country GEs.” (Hess and von Cramon-Taubadel, 2008). Accordingly, we should expect lower welfare gains in single-region CGE models.
We introduce the length of the model (Time_estimation) to account for long-run versus short-run simulations. Following Hess and von Cramon-Taubadel (2008) long-short-run CGE models should generate higher welfare gains than short-run ones. This reflects that long-run CGE models take into account increases in the scope of the world economy.
Scenario
Authors implement various scenarios in their simulations and extracting them was rather difficult. In the MRA, we control for whether the scenario involves an expansion of land allocated to biofuels (Land) and whether the scenario implies an increase in agricultural productivity or biofuel productivity (Productivity). In some instances, we have been able to calculate the surface allocated to biofuels in the simulation by multiplying the expansion rate of land allocated to biofuels and the surface of the country (Land_surface).
Biofuel type
There are two types of biofuels, namely biodiesel and bioethanol. Biodiesel encompasses jatropha, caster bean, palm oil, soybean, rape sunflower oil; bioethanol includes sugarcane, cassava, wheat, maize, corn, potatoes and sorghum. In the primary studies, authors carry out a simulation on biodiesel, bioethanol or both.
The production of these biofuels can have multiple impacts. Gasparatos et al. (2015) list (i) Economic impacts: economic development, energy security and foreign exchange savings (ii) Environmental impacts: water availability, water quality, GHG emissions and biodiversity loss (iii) Social impacts: poverty alleviation, food security and access to land. These impacts vary per the scale of production.
Household type
For the ES INCOME, we add a variable on household characteristics, indicating whether they are rural, urban, poor or better-off.
4. Empirical strategy
4.1. Base model
We estimate two complementary models corresponding to each type of ES, GDP and INCOME. The base model is:
or
is a vector of effect sizes (GPD and INCOME) that is the welfare change in a country due to a biofuel policy; is a matrix of moderators; is a vector of meta-regression coefficients. is a vector of residuals. Most MRAs using estimates from CGE models are estimated using OLS (e.g., Barker et al., 2002; Hess and von Cramon-Taubadel, 2008). Authors of such MRAs have stressed the need to account for multiple ESs in primary studies (Barker et al., 2002; Branger and Quirion, 2014; Hess and von Cramon-Taubadel, 2008).
MRAs using ESs obtained using econometric estimations can be estimated in several ways, which are discussed in the literature (see Ringquist, 2013; Stanley and Doucouliagos, 2014a, 2014b, 2012). Stanley and Doucouliagos (2012, p. 122) advise using very simple econometric models and promote the use of Weighted Least Squares (WLS), which is discussed in Stanley and Doucouliagos (2014a, 2014b). WLS allow for correcting for heteroscedasticity and excess heterogeneity using sample size as weight (or other precision measures). In this MRA, we cannot use such models as we do not have any precision measure. Consequently, we estimate robust OLS. Additionally, to capture dependence among ESs when multiple ESs are reported in studies, we estimate cluster-robust regressions, taking a study as a cluster. The cluster-robust MRA will differ from the robust OLS MRA in terms of standard errors: these will be computed considering the potential dependence within a cluster. Finally, we estimate multi-level regressions (mixed-effect model), which are an alternative way to capture dependence among ESs reported in studies, with two levels, i.e., ESs and primary studies.
4.2. Selection of moderators and robustness checks
Firstly, our moderators present high correlations between them. Therefore, we choose to present several specifications for each model. Secondly, ESs belonging to a same primary study may be correlated, which can introduce a bias in the MRA. We take this into account by using cluster robust regressions as recommended by Stanley and Doucouliagos (2012) with primary studies as clusters. Robust OLS regressions are presented in Table 4 and Table 5. Cluster regressions are presented in Annex 3 and Annex 4 ; Multi-level regressions are presented in Annexes 5 and 6.
Table 4. Robust OLS for GDP VARIABLES (1) (2) (3) (4) (5) (6) (7) (8) (9) Year 0.0717 -0.0624** (0.128) (0.0313) Article -0.293 -0.102 (0.335) (0.106) Africa 0.0987 -0.00951 (0.412) (0.170) Europe 0.0762 -0.0947 (0.288) (0.175) Asia 0.209 -0.0414 (0.203) (0.156) South_america11 0.0118 -0.381** (0.279) (0.172) OECD 0.931* 0.209 (0.523) (0.169)
GDP_cap -1.87e-05 2.78e-06
(1.44e-05) (4.24e-06) Time_estimation 0.0463*** 0.0482*** 0.0474*** 0.0540*** 0.0505*** 0.0449*** 0.0496*** 0.0477*** 0.0491*** (0.0169) (0.0161) (0.0182) (0.0167) (0.0172) (0.0156) (0.0160) (0.0154) (0.0159) Multi_country 1.484** 1.394** (0.706) (0.570) Dynamic 0.404 0.213 (0.398) (0.154) MIRAGE 1.756** 0.307*** 0.323** 0.327*** 0.269** 1.575*** 0.406*** 0.261 0.356** (0.708) (0.117) (0.131) (0.120) (0.125) (0.555) (0.156) (0.189) (0.151) Model_other12 2.175** 0.986*** 0.953*** 1.006*** 1.004*** 2.092*** 1.110*** 1.023*** 1.044*** (0.888) (0.328) (0.322) (0.327) (0.332) (0.653) (0.367) (0.368) (0.355) Armington 0.0616 0.0529 (0.348) (0.225)
11 North_america is the variable of reference. 12 GTAP is the variable of reference.
VARIABLES (1) (2) (3) (4) (5) (6) (7) (8) (9) Land -1.404** -1.102** -1.144** -1.188** -1.152** -1.459** -1.034** -1.172** -1.062** (0.643) (0.503) (0.497) (0.503) (0.527) (0.618) (0.478) (0.496) (0.486) Land_surface -3.58e-09 (3.50e-09) Productivity 1.052** 1.022** 1.025** 1.034** 1.053** 1.014** 1.001** 1.010** 1.015** (0.429) (0.458) (0.453) (0.459) (0.474) (0.438) (0.447) (0.451) (0.454) Biodiesel 0.689* 0.496 0.484 0.566* 0.482 0.762* 0.482 0.503* 0.491 (0.394) (0.311) (0.309) (0.317) (0.310) (0.405) (0.305) (0.296) (0.309) Biodiesel_bioeth anol13 -0.541 -0.0531 -0.111 -0.0359 -0.0894 -0.361 -0.00187 -0.0708 -0.0240 (0.369) (0.216) (0.212) (0.226) (0.232) (0.312) (0.214) (0.222) (0.216) Constant -145.8 -0.563* -0.602** 124.9** -0.494* -1.559*** -0.739** -0.448 -0.662** (257.6) (0.290) (0.293) (63.05) (0.296) (0.469) (0.298) (0.280) (0.297) Observations 227 227 227 227 227 227 227 227 227 R-squared 0.369 0.284 0.293 0.289 0.286 0.323 0.291 0.296 0.285
Robust standard errors in parentheses *** p<0.01, ** p<0.05, * p<0.1
Table 5. Robust OLS for INCOME VARIABLES (1) (2) (3) (4) (5) (6) (7) (8) (9) (10) Year 0.178 -0.0399 (0.117) (0.0407) Article -0.279 0.257 (0.343) (0.202) Africa 0.827* (0.451) Europe 2.661*** -0.153 (0.738) (0.567) Asia 0.462 0.887* (0.474) (0.525) South_amer ica -0.155 -0.0715 (0.768) (0.404) OECD 1.747 -0.597 (1.736) (0.526)
GDP_cap -6.56e-05* -2.76e-05**
(3.78e-05) (1.15e-05) Time_estim ation 0.0927** 0.0950*** 0.0975*** 0.0982*** 0.101*** 0.0845*** 0.103*** 0.0870*** 0.110*** 0.0897** (0.0423) (0.0332) (0.0357) (0.0346) (0.0345) (0.0317) (0.0361) (0.0334) (0.0356) (0.0359) Multi_count ry 3.262*** 2.226*** (0.692) (0.396) Dynamic 0.967** 0.458** (0.424) (0.211) MIRAGE 3.253*** 0.446** 0.282 0.481** 0.408* 1.938*** -0.0167 -0.129 -0.282 0.487** (0.847) (0.213) (0.246) (0.202) (0.228) (0.372) (0.510) (0.556) (0.413) (0.199) Model_othe r 2.994*** 1.063*** 0.910*** 1.090*** 0.958*** 2.279*** 0.561 0.470 0.300 1.077*** (0.664) (0.243) (0.227) (0.246) (0.240) (0.329) (0.466) (0.545) (0.336) (0.250) Armington -0.660* 0.146
VARIABLES (1) (2) (3) (4) (5) (6) (7) (8) (9) (10) (0.358) (0.229) Land -0.743* -0.691** -0.780** -0.744** -0.614** -0.894*** -0.826** -0.996*** -1.008*** -0.734*** (0.386) (0.284) (0.303) (0.287) (0.299) (0.284) (0.320) (0.383) (0.342) (0.253) Land_surfac e -5.16e-09 (3.27e-09) Productivit y 0.734*** 0.830*** 0.827*** 0.839*** 0.801*** 0.860*** 0.835*** 0.799*** 0.819*** 0.714*** (0.198) (0.214) (0.214) (0.215) (0.223) (0.212) (0.217) (0.220) (0.215) (0.218) Biodiesel 0.00569 0.247 0.177 0.293 0.200 0.402* 0.264 0.419* 0.288 0.496** (0.147) (0.217) (0.198) (0.209) (0.203) (0.222) (0.217) (0.221) (0.216) (0.195) Biodiesel_bi oethanol -0.422* 0.275 0.224 0.290 0.313 -0.148 0.246 0.307 0.214 0.503** (0.240) (0.264) (0.274) (0.265) (0.284) (0.239) (0.265) (0.280) (0.262) (0.244) HH_rural_u rban -0.108 (0.228) HH_rural 0.626*** (0.180) HH_poor_ri ch 0.395** (0.154) HH_poor 0.170 (0.132) Constant -360.4 -1.128*** -1.135*** 79.12 -1.263*** -2.334*** -0.644 -1.089*** -0.296 -1.605*** (236.2) (0.369) (0.357) (81.84) (0.436) (0.416) (0.497) (0.351) (0.409) (0.543) Observatio ns 255 255 255 255 255 255 255 255 255 255 R-squared 0.472 0.228 0.251 0.230 0.235 0.342 0.236 0.265 0.256 0.291
Robust standard errors in parentheses *** p<0.01, ** p<0.05, * p<0.1
5. Results
The meta-regressions explain 30-37% and 25-48% of the variance of ESs for GDP and INCOME, respectively.
We do not find a significant impact of the year of publication (year) or its type (article). We find a positive and significant sign for time_estimation, for both GDP and INCOME, suggesting welfare gains increase with the length of the simulation. This is line with results found by Hess and von Cramon-Taubadel (2008). We also find a positive and significant impact of multi_country for both ESs and in all specifications. Such an effect is also found by Hess and von Cramon-Taubadel (2008) and indicates increased welfare gains in multi-region models which account for the reallocation of international factors and comparative advantages.
The results for the Armington variable are mixed and do not allow us to derive useful results. MIRAGE and other models tend to generate higher welfare gains than GTAP models. This result is again in line with Hess and von Cramon-Taubadel (2008). As previously explained, standard Armington elasticities in GTAP models are lower than other models, which could explain why simulations relying on GTAP values tend to find lower welfare gains (Hess and von Cramon-Taubadel, 2008).
Dynamic models lead to higher welfare gains for HH INCOME compared to static or recursive dynamic models. In dynamic models, economic agents are forward-looking and their intertemporal behavior is taken into account, which implies time-consistent behaviors.
When the scenario implies the expansion of land allocated to biofuels (Land), ESs for both GDP and INCOME models decrease. This suggests that competition for land with other agricultural crops is detrimental to welfare. Interestingly, most simulations with such scenarios were performed in Sub Saharan Africa, e.g., Mozambique, Tanzania, Mali, Ethiopia (e.g., Arndt et al., 2008; Arndt et al., 2011; Arndt et al., 2012; Boccanfuso et al., 2013; Ferede et al., 2013; Gebreegziabher et al., 2013; Gemechis, 2012). Several authors have put an emphasis on Sub Saharan African land endowments: uncultivated land availability in this region represents roughly half the world’s endowments. However, Sub Saharan African land potential is concentrated in a few countries (Deininger and Byerlee 2011) and is subjected to highly heterogeneous agro-ecological conditions (Wicke et al. 2011).14 Conversely, simulations containing a scenario with an increase in agricultural productivity or biofuel productivity (productivity) consistently impact ESs positively.
Results for the geographical area are not clear-cut. They tend to indicate that OECD countries have higher gains in terms of GDP and that Africa and Asia (or countries with a lower GDP per capita) have higher welfare gains for HH INCOME. Understanding the underlying mechanisms is tricky for several reasons. First, biofuel production has more severe effects on food prices in developing countries than in developed ones (FAO, 2008). Second, tax exemptions, subsidies and mandatory blending targets influence the economic profitability of biofuel production. These policies have mainly been implemented in the USA, Europe and emerging economies (FAO, 2008; Sorda et al., 2010). With such distortions, determining the real economic
14 For an in-depth discussion of bioenergy expansion in Sub Saharan Africa, see, for instance, Brun et al.
profitability of biofuels is a difficult task. Third, countries produce different mixes of bioethanol and biodiesel. In addition, we find that the positive impact is higher for rural HH compared to urban HH and for a mix of poor and rich HH compared to rich HH only. This could suggest that biofuel production favors rural employment (FAO, 2008) and may, therefore, contribute to rural development.
We find that the impact of a biodiesel scenario is positive compared to bioethanol only. Recall that biodiesels encompass jatropha, caster bean, palm oil, soybean and rape sunflower oil while bioethanols include sugarcane, cassava, wheat, maize, corn, potatoes and sorghum. The production costs are much higher for rape sunflower oil (e.g., 3.29 USD per gallon in the EU) than sugarcane (0.25 USD per litre in Brazil) (FAO, 2008). More generally, biodiesels tend to be more expensive to produce, which could be what is captured in the GDP growth. Also, soybean prices have been significantly rising over the past decade, with a slowdown after 2014, therefore substantially increasing the profitability of this crop.
6. Discussion and conclusion
This meta-analysis is to the best of our knowledge the first to look at the impact of biofuel production on economic growth and poverty. We focus on Computable General Equilibrium Studies. CGE modeling is a particularly relevant and interesting framework to investigate the impact of biofuels on various dimensions such as growth, poverty and food prices (Dixon and Jorgenson, 2013; Kretschmer and Peterson, 2010). It has indeed played a crucial role in the fuel versus food debate (see e.g., Chakravorty et al., 2009). CGE studies have provided contrasting results notably because the results are sensitive to scenario parameters, modeling choices, data assumptions, etc. Our contribution is to precisely examine the impact of biofuel policies on growth and household income by considering model parameters in a meta-analysis framework. Our quantitative meta-analysis is complementary to existing narrative surveys and confirms that results are sensitive to key hypotheses on essential parameters. Simulations on longer time periods and simulations in multi-countries lead to higher impacts of biofuel expansion on growth and household income. Moreover, simulations with a shock on agricultural productivity lead to positive welfare gains, unlike simulations with a shock on land expansion. Lastly, biodiesels lead to higher gains compared to biofuels. Overall, according to the literature, the impact of biofuel expansion appears to be positive on both growth and household welfare. However, CGE models do not account for non-priced effects such as externalities. To get a comprehensive overview of the impact of biofuel expansion, this meta-analysis should be combined with models that assess the environmental and social sustainability of biofuels as they both offer advantages and risks. See FAO (2008) for a thorough review of these environmental and social challenges. One way forward might consist in better integrating damage functions into CGE models. This is done, for instance, in long-term growth models that assess the social benefits of greenhouse gases abatement, following the pioneering work of Nordhaus (1991). Crucial hypotheses pertaining to the convexity of the damage functions induce substantial variations in the social outcome (see, for example, e.g., the analysis of Dietz and Stern (2015).
Several questions were answered through this meta-analysis but other interesting research avenues remain. One crucial question that prevails involves the effect of biofuel on land allocation and land use. Assuming productivity gains in agriculture could induce a rebound effect, if agriculture is more profitable, more resources will be allocated to agriculture. The underlying mechanism is similar to a Jevons’ Paradox. Therefore, more research efforts should be devoted to addressing the question of which environmental consequences of biofuel expansion are the most critical. Furthermore, on the methodological side, MRAs that use econometric studies as primary studies include a measure for the precision of estimates. In the case of primary studies relying on CGE, such measures are not available; thus, future research in meta-analysis methodology should focus on identifying alternative precision measures. Finally, as raised by Hess and von Cramon-Taubadel (2008), the results of CGE models are a “complex function of the many factors…[]…and of interactions between them”. It is not possible to code all characteristics of publications given the enormous amount of data and computation needed to run a CGE and the fact that not all of the information needed for a CGE is provided in published papers.
References
Amigun, B., Musango, J.K., Stafford, W., 2011. Biofuels and sustainability in Africa. Renewable and Sustainable Energy Reviews 15, 1360–1372. doi:10.1016/j.rser.2010.10.015
Andrade de Sá, S., Palmer, C., di Falco, S., 2013. Dynamics of indirect land-use change: Empirical evidence from Brazil. Journal of Environmental Economics and Management 65, 377– 393. doi:10.1016/j.jeem.2013.01.001
Arezki, R., Deininger, K., Selod, H., 2013. What Drives the Global “Land Rush”? World Bank Econ Rev lht034. doi:10.1093/wber/lht034
Arndt, C., Benfica, R., Tarp, F., Thurlow, J., Uaiene, R., 2008. Biofuels, poverty, and growth: a computable general equilibrium analysis of Mozambique. IFPRI Discussion Paper 00803. Arndt, C., Msangi, S., Thurlow, J., 2011. Are biofuels good for African development? An analytical
framework with evidence from Mozambique and Tanzania. Biofuels 2, 221–234. doi:10.4155/bfs.11.1
Arndt, C., Pauw, K., Thurlow, J., 2012. Biofuels and economic development: A computable general equilibrium analysis for Tanzania. Energy Economics 34, 1922–1930. doi:10.1016/j.eneco.2012.07.020
Babiker, M., Gurgel, A., Paltsev, S., Reilly, J., 2009. Forward-looking versus recursive-dynamic modeling in climate policy analysis: A comparison. Economic Modelling 26, 1341–1354. doi:10.1016/j.econmod.2009.06.009
Barker, T., Koehler, J., Villena, M., 2002. Costs of greenhouse gas abatement: meta-analysis of post-SRES mitigation scenarios. Environmental Economics and Policy Studies 5, 135– 166.
Bchir, M.H., Decreux, Y., Guérin, J.-L., Jean, S., 2002. MIRAGE, A Computable General Equilibrium Model for Trade Policy Analysis. CEPII, Working Paper No 2002-17.
Boccanfuso, D., Coulibaly, M., Timilsina, G.R., Savard, L., 2013. Macroeconomic and distributional impacts of jatropha-based biodiesel in Mali. World Bank Policy Research Working Paper. Branger, F., Quirion, P., 2014. Would border carbon adjustments prevent carbon leakage and heavy industry competitiveness losses? Insights from a meta-analysis of recent economic studies. Ecological Economics 99, 29–39. doi:10.1016/j.ecolecon.2013.12.010 Brun, J.-F., Combes, P.M., Kéré, E.N., n.d. Challenges for Energy in Sub Saharan Africa: The Role of
Biofuels. Bioenergies in East Africa between challenges and opportunities 29.
Bruns, S.B., Gross, C., Stern, D.I., 2013. Is There Really Granger Causality between Energy Use and Output? (SSRN Scholarly Paper No. ID 2232455). Social Science Research Network, Rochester, NY.
Carbonnier, G., Grinevald, J., 2011. Energy and Development. International Development Policy | Revue internationale de politique de développement 2. doi:10.4000/poldev.724
Chakravorty, U., Hubert, M.-H., Nøstbakken, L., 2009. Fuel Versus Food. Annual Review of Resource Economics 1, 645–663. doi:10.1146/annurev.resource.050708.144200
Chauvin, N.D., Mulangu, F., Porto, G., others, 2012. Food production and consumption trends in sub-Saharan Africa: Prospects for the transformation of the agricultural sector (No. WP 2012-011). United Nations Development Program - Regional Bureau for Africa.
Chen, P.-Y., Chen, S.-T., Chen, C.-C., 2012. Energy consumption and economic growth—New evidence from meta analysis. Energy Policy 44, 245–255. doi:10.1016/j.enpol.2012.01.048
Condon, N., Klemick, H., Wolverton, A., 2015. Impacts of ethanol policy on corn prices: A review and meta-analysis of recent evidence. Food Policy 51, 63–73. doi:10.1016/j.foodpol.2014.12.007
Decaluwé, B., Martens, A., Savard, L., 2001. La politique économique du développement et les modèles d’équilibre général calculable: une introduction à l’application de l’analyse mésoéconomique aux pays en développement. PUM.
Delmas, M.A., Fischlein, M., Asensio, O.I., 2013. Information strategies and energy conservation behavior: A meta-analysis of experimental studies from 1975 to 2012. Energy Policy 61, 729–739.
Deiniger, K., Byerlee, D., Lindsay, J., Norton, A., Selod, H., Stickler, M., 2011. Rising global interest in farmland. World Bank.
Dietz, S., Stern, N., 2015. Endogenous Growth, Convexity of Damage and Climate Risk: How Nordhaus’ Framework Supports Deep Cuts in Carbon Emissions. Econ J 125, 574–620. doi:10.1111/ecoj.12188
Dixon, P.B., Jorgenson, D.W. (Eds.), 2013. Handbook of computable general equilibrium modeling, Handbooks in economics. Elsevier, Amsterdam.
Doucouliagos, H., Ulubaşoğlu, M.A., 2008. Democracy and Economic Growth: A Meta-Analysis. American Journal of Political Science 52, 61–83. doi:10.1111/j.1540-5907.2007.00299.x Espey, M., 1998. Gasoline demand revisited: an international meta-analysis of elasticities.
Energy Economics 20, 273–295.
Ferede, T., Gebreegziabher, Z., Mekonnen, A., Guta, F., Levin, J., Kohlin, G., others, 2013. Biofuels, economic growth, and the external sector in Ethiopia: a computable general equilibrium analysis. Discussion Paper-Resources for the Future (RFF).
FAO (Ed.), 2008. Biofuels: prospects, risks and opportunities, The state of food and agriculture. FAO, Rome.
Ferreira Filho, J.B. de S., 2011. The rise in global demand for ethanol and poverty in Brazil. Goodwin, P., Dargay, J., Hanly, M., 2004. Elasticities of Road Traffic and Fuel Consumption with
Respect to Price and Income: A Review. Transport Reviews 24, 275–292. doi:10.1080/0144164042000181725
Gasparatos, A., von Maltitz, G.P., Johnson, F.X., Lee, L., Mathai, M., Puppim de Oliveira, J.A., Willis, K.J., 2015. Biofuels in sub-Sahara Africa: Drivers, impacts and priority policy areas. Renewable and Sustainable Energy Reviews 45, 879–901. doi:10.1016/j.rser.2015.02.006
Gebreegziabher, Z., Mekonnen, A., Ferede, T., Guta, F., Levin, J., Köhlin, G., Alemu, T., Bohlin, L., others, 2013. The distributive effect and food security implications of biofuels investment in Ethiopia: a CGE analysis. Environment for Development Discussion Paper Series DP 13-02.
Gemechis, M., 2012. The Economy Wide Impact of Biofuel Investment in Ethiopia: A Recursive Dynamic Computable General Equilibrium Microsimulation Analysis. Addis Ababa University.
Gota, S., Huizenga, C., Peet, K., Kaar, G., 2015. Intended Nationally-Determined Contributions (INDCs) Offer Opportunity for Ambitious Action on Transport and Climate Change. Paris Process on Mobility and Climate - Partnership on Sustainable Low Carbon Transport, Paris. Gunatilake, H., Roland-Holst, D., Sugiyarto, G., 2014. Energy security for India: Biofuels, energy
efficiency and food productivity. Energy Policy 65, 761–767. doi:10.1016/j.enpol.2013.10.050
Havranek, T., Irsova, Z., Janda, K., 2012. Demand for gasoline is more price-inelastic than commonly thought. Energy Economics 34, 201–207. doi:10.1016/j.eneco.2011.09.003 Hess, S., von Cramon-Taubadel, S., 2008. A Meta-Analysis of General and Partial Equilibrium
Simulations of Trade Liberalisation under the Doha Development Agenda. The World Economy 31, 804–840. doi:10.1111/j.1467-9701.2008.01103.x
Hunter, J.E., Schmidt, F.L., 2004. Methods of Meta-Analysis: Correcting Error and Bias in Research Findings, 2nd Revised edition. ed. SAGE Publications Inc, Thousand Oaks, Calif. Ji, X., Long, X., 2016. A review of the ecological and socioeconomic effects of biofuel and energy
policy recommendations. Renewable and Sustainable Energy Reviews 61, 41–52. doi:10.1016/j.rser.2016.03.026
Kalimeris, P., Richardson, C., Bithas, K., 2014. A meta-analysis investigation of the direction of the energy-GDP causal relationship: implications for the growth-degrowth dialogue. Journal of Cleaner Production 67, 1–13. doi:10.1016/j.jclepro.2013.12.040
Kere, E.N., 2016. Do political economy factors matter in explaining the increase in the production of bioenergy? (Working Paper Series No. UNU-WIDER Working Paper wp2016-025). World Institute for Development Economic Research (UNU-WIDER). Kretschmer, B., Peterson, S., 2010. Integrating bioenergy into computable general equilibrium
models—A survey. Energy Economics 32, 673–686.
Kumar, S., Shrestha, P., Abdul Salam, P., 2013. A review of biofuel policies in the major biofuel producing countries of ASEAN: Production, targets, policy drivers and impacts. Renewable and Sustainable Energy Reviews 26, 822–836. doi:10.1016/j.rser.2013.06.007
Lampin, L., 2012. Meta-analysis of Energy Use in Cities. Austrian Association for Energy Economics–First International PhD-Day.
Leach, G., 1992. The energy transition. Energy Policy 20, 116–123. doi:10.1016/0301-4215(92)90105-B
Lee, D.-H., Lin, H.-C., Chang, C.-C., Hsu, S.-H., others, 2007. An Economy-wide Analysis of Increasing Bio-Ethanol Production in Taiwan, in: 2007 Annual Meeting, July 29-August 1, 2007, Portland, Oregon TN. American Agricultural Economics Association (New Name 2008: Agricultural and Applied Economics Association).
Menegaki, A.N., 2014. On energy consumption and GDP studies; A meta-analysis of the last two decades. Renewable and Sustainable Energy Reviews 29, 31–36. doi:10.1016/j.rser.2013.08.081
Nelson, J.P., Kennedy, P.E., 2008. The Use (and Abuse) of Meta-Analysis in Environmental and Natural Resource Economics: An Assessment. Environmental and Resource Economics 42, 345–377. doi:10.1007/s10640-008-9253-5
Nordhaus, W.D., 1991. To Slow or Not to Slow: The Economics of The Greenhouse Effect. The Economic Journal 101, 920–937. doi:10.2307/2233864
Ozturk, I., 2010. A literature survey on energy–growth nexus. Energy Policy, 38(1), pp.340–349 Paldam, M., 2015. Meta-Analysis in a Nutshell: Techniques and General Findings. Economics
Discussion Papers No 2015-3.
Ringquist, E., 2013. Meta-Analysis for Public Management and Policy, 1 edition. ed. Jossey-Bass. Rose, A., Dormady, N., 2011. A Meta-Analysis of the Economic Impacts of Climate Change Policy
in the United States. The Energy Journal 32. doi:10.5547/ISSN0195-6574-EJ-Vol32-No2-6
Rosegrant, M.W., Zhu, T., Msangi, S., Sulser, T., 2008. Global Scenarios for Biofuels: Impacts and Implications. Appl. Econ. Perspect. Pol. 30, 495–505. doi:10.1111/j.1467-9353.2008.00424.x
Scollay, R., Gilbert, J., 2000. Measuring the gains from APEC trade liberalisation: An overview of CGE assessments. The World Economy 23, 175–197.
Searchinger, T., Heimlich, R., Houghton, R.A., Dong, F., Elobeid, A., Fabiosa, J., Tokgoz, S., Hayes, D., Yu, T.-H., 2008. Use of US croplands for biofuels increases greenhouse gases through emissions from land-use change. Science 319, 1238–1240.
Sebri, M., 2015. Use renewables to be cleaner: Meta-analysis of the renewable energy consumption–economic growth nexus. Renewable and Sustainable Energy Reviews 42, 657–665. doi:10.1016/j.rser.2014.10.042
Soon, J.-J., Ahmad, S.-A., 2015. Willingly or grudgingly? A meta-analysis on the willingness-to-pay for renewable energy use. Renewable and Sustainable Energy Reviews 44, 877–887. doi:10.1016/j.rser.2015.01.041
Sorda, G., Banse, M., Kemfert, C., 2010. An overview of biofuel policies across the world. Energy Policy 38, 6977–6988. doi:10.1016/j.enpol.2010.06.066
Stanley, T.D., 2001. Wheat from chaff: Meta-analysis as quantitative literature review. The Journal of Economic Perspectives 15, 131–150.
Stanley, T.D., Doucouliagos, C., Jarrell, S.B., 2008. Meta-regression analysis as the socio-economics of socio-economics research. The Journal of Socio-Economics 37, 276–292. doi:10.1016/j.socec.2006.12.030
Stanley, T.D., Doucouliagos, H., 2012. Meta-regression analysis in economics and business. Routledge, New York.
Stanley, T.D., Doucouliagos, H., Giles, M., Heckemeyer, J.H., Johnston, R.J., Laroche, P., Nelson, J.P., Paldam, M., Poot, J., Pugh, G., Rosenberger, R.S., Rost, K., 2013. Meta-analysis of economics research reporting guidelines: reporting guidelines for meta-regression analysis in economics. Journal of Economic Surveys 27, 390–394. doi:10.1111/joes.12008
Stattman, S.L., Hospes, O., Mol, A.P.J., 2013. Governing biofuels in Brazil: A comparison of ethanol and biodiesel policies. Energy Policy 61, 22–30. doi:10.1016/j.enpol.2013.06.005
Stern, D.I., 2009. Interfuel Substitution: A Meta-Analysis. ISSN 1835-9728 Environmental Economics Research Hub Research Reports.
Sterne, J.A.C., Egger, M., 2001. Funnel plots for detecting bias in meta-analysis: Guidelines on choice of axis. Journal of Clinical Epidemiology 54, 1046–1055. doi:10.1016/S0895-4356(01)00377-8
Toulmin, C., 2009. Securing land and property rights in sub-Saharan Africa: The role of local institutions. Land Use Policy, Formalisation of Land Rights in the South 26, 10–19. doi:10.1016/j.landusepol.2008.07.006
Wicke, B. et al., 2011. The current bioenergy production potential of semi-arid and arid regions in sub-Saharan Africa. Biomass and Bioenergy, 35(7), pp.2773–2786.
Appendix
Annex 1. Full references for the 26 primary studies
Arndt, C., Benfica, R., Tarp, F., Thurlow, J., Uaiene, R., 2008. Biofuels, poverty, and growth: a computable general equilibrium analysis of Mozambique. IFPRI Discussion Paper 00803. Arndt, C., Benfica, R., Thurlow, J., 2011. Gender Implications of Biofuels Expansion in Africa: The
Case of Mozambique. World Development 39, 1649–1662.
doi:10.1016/j.worlddev.2011.02.012
Arndt, C., Pauw, K., Thurlow, J., 2012. Biofuels and economic development: A computable general equilibrium analysis for Tanzania. Energy Economics 34, 1922–1930. doi:10.1016/j.eneco.2012.07.020
Boccanfuso, D., Coulibaly, M., Timilsina, G.R., Savard, L., 2013. Macroeconomic and distributional impacts of jatropha-based biodiesel in Mali. World Bank Policy Research Working Paper. Branca, G., Felix, E., Maltsoglou, I., Rincón, L.E., Thurlow, J., 2014. Producing biofuels in
low-income countries an integrated environmental and economic assessment for Tanzania. WIDER, Helsinki.
Cabral, F.J., Cissé, F., Diagne, A., Siwa, Ms., 2012. Global Biofuel Production and Poverty in Senegal.
Cansino, J., Cardenete, M., González-Limón, J., Román, R., 2013. Economic impacts of biofuels deployment in Andalusia. Renewable and Sustainable Energy Reviews 27, 274–282. doi:10.1016/j.rser.2013.06.006
Cororaton, C.B., Timilsina, G.R., 2012. Impacts of large-scale expansion of biofuels on global poverty and income distribution. World Bank Policy Research Working Paper.
de Souza Ferreira Filho, J.B., 2011. The rise in global demand for ethanol and poverty in Brazil. In: Trade, poverty and complementary policies in Latin America. Santiago: ECLAC, 2011. p. 95-120. LC/W. 365.
Doumax, V., Philip, J.-M., Sarasa, C., 2014. Biofuels, tax policies and oil prices in France: Insights from a dynamic CGE model. Energy Policy 66, 603–614. doi:10.1016/j.enpol.2013.11.027 Ferede, T., Gebreegziabher, Z., Mekonnen, A., Guta, F., Levin, J., Kohlin, G., others, 2013. Biofuels,
economic growth, and the external sector in Ethiopia: a computable general equilibrium analysis. Discussion Paper-Resources for the Future (RFF).
Gebreegziabher, Z., Mekonnen, A., Ferede, T., Guta, F., Levin, J., Köhlin, G., Alemu, T., Bohlin, L., others, 2013. The distributive effect and food security implications of biofuels investment in Ethiopia: a CGE analysis. Environment for Development Discussion Paper Series DP 13-02.
Ge, J., Lei, Y., 2010. Assessing Welfare and Growth Effects of Grain-based Fuel Ethanol Development in China: a General Equilibrium Framework.
Ge, J., Tokunaga, S., 2011. Impacts of Expanding Non-grain-based Fuel Ethanol on Regional Equality in China: Using a Computable General Equilibrium Model. Studies in Regional Science 41, 883–896.
Gemechis, M., 2012. The Economy Wide Impact of Biofuel Investment in Ethiopia: A Recursive Dynamic Computable General Equilibrium Microsimulation Analysis. Addis Ababa University.
Gunatilake, H., Pohit, S., Sugiyarto, G., 2011. Economy-Wide Impacts of Biodiesel Production and Use in India: A Computable General Equilibrium Model Assessment. Asian Development Bank No. 4 | May 2011.
Gunatilake, H., Roland-Holst, D., Sugiyarto, G., 2014. Energy security for India: Biofuels, energy efficiency and food productivity. Energy Policy 65, 761–767. doi:10.1016/j.enpol.2013.10.050
Huang, J., Yang, J., Msangi, S., Rozelle, S., Weersink, A., 2012. Global biofuel production and poverty in China. Applied Energy 98, 246–255. doi:10.1016/j.apenergy.2012.03.031
Huang, M.-Y., 2010. Regional impacts of bioenergy policies in the Southeastern United States: a computable general equilibrium analysis. University of Florida.
Lee, D.-H., Lin, H.-C., Chang, C.-C., Hsu, S.-H., others, 2007. An Economy-wide Analysis of Increasing Bio-Ethanol Production in Taiwan, in: 2007 Annual Meeting, July 29-August 1, 2007, Portland, Oregon TN. American Agricultural Economics Association (New Name 2008: Agricultural and Applied Economics Association).
Oladosu, G., Kline, K., 2013. A dynamic simulation of the ILUC effects of biofuel use in the USA. Energy Policy 61, 1127–1139. doi:10.1016/j.enpol.2013.06.124
Oladosu, G., Kline, K.L., 2010. The role of modeling assumptions and policy instruments in evaluating the global implications of US biofuel policies, in: The Future of Energy: Global Challenges, Diverse Solutions. Proceedings of the 33rd IAEE International Conference, Rio de Janeiro, Brazil.
Ozturk, I., 2010. A literature survey on energy–growth nexus. Energy Policy, 38(1), pp.340–349. Timilsina, G.R., Beghin, J.C., Van der Mensbrugghe, D., Mevel, S., 2012. The impacts of biofuels
targets on land-use change and food supply: A global CGE assessment. Agricultural Economics 43, 315–332.
Timilsina, G.R., Chisari, O.O., Romero, C.A., 2013. Economy-wide impacts of biofuels in Argentina. Energy Policy 55, 636–647. doi:10.1016/j.enpol.2012.12.060
van der Kroon, B., Brouwer, R. & van Beukering, P.J.H., 2013. The energy ladder: Theoretical myth or empirical truth? Results from a meta-analysis. Renewable and Sustainable Energy Reviews, 20, pp.504–513.
Wianwiwat, S., Asafu-Adjaye, J., 2013. Is there a role for biofuels in promoting energy self sufficiency and security? A CGE analysis of biofuel policy in Thailand. Energy Policy 55, 543– 555. doi:10.1016/j.enpol.2012.12.054
Wianwiwat, S., Asafu-Adjaye, J., 2012. A CGE Approach to the Analysis of Biofuels for Promoting Energy Self Sufficiency and Security Policy in Thailand–Results and Discussion. Procedia Engineering 49, 3–9. doi:10.1016/j.proeng.2012.10.105
Annex 2. Primary studies used
GDP INCOME
1 (Arndt et al., 2008) 1 (Arndt et al., 2008) 2 (Arndt et al., 2011) 2 (Arndt et al., 2011) 3 (Arndt et al., 2012) 3 (Arndt et al., 2012) 4 (Boccanfuso et al., 2013) 4 (Boccanfuso et al., 2013) 5 (Cabral et al., 2012) 5 (Branca et al., 2014) 6 (Cansino et al., 2013) 6 (Cabral et al., 2012) 7 (Cororaton and Timilsina, 2012) 7 (Cansino et al., 2013)
8 (de Souza Ferreira Filho, 2011) 8 (de Souza Ferreira Filho, 2011) 9 (Doumax et al., 2014) 9 (Doumax et al., 2014)
10 (Ferede et al., 2013) 10 (Ge and Lei, 2010) 11 (Ge and Lei, 2010) 11 (Ge and Tokunaga, 2011) 12 (Gebreegziabher et al., 2013) 12 (Gebreegziabher et al., 2013) 13 (Gemechis, 2012) 13 (Gemechis, 2012)
14 (Gunatilake et al., 2011) 14 (Gunatilake et al., 2011) 15 (Gunatilake et al., 2014) 15 (Gunatilake et al., 2014) 16 (Huang, 2010) 16 (Huang et al., 2012) 17 (Lee et al., 2007) 17 (Huang, 2010) 18 (Oladosu and Kline, 2010) 18 (Lee et al., 2007)
19 (Oladosu and Kline, 2013) 19 (Oladosu and Kline, 2010) 20 (Timilsina et al., 2012) 20 (Timilsina et al., 2013)
21 (Timilsina et al., 2013) 21 (Wianwiwat and Asafu-Adjaye, 2012) 22 (Wianwiwat and Asafu-Adjaye, 2012) 22 (Wianwiwat and Asafu-Adjaye, 2013) 23 (Wianwiwat and Asafu-Adjaye, 2013)
Annex 3. Cluster robust OLS for GDP VARIABLES (1) (2) (3) (4) (5) (6) (7) (8) (9) Year 0.0717 -0.0624 (0.191) (0.0542) Article -0.293 -0.102 (0.459) (0.141) Africa 0.0987 -0.00951 (0.578) (0.290) Europe 0.0762 -0.0947 (0.360) (0.213) Asia 0.209 -0.0414 (0.283) (0.190) South_america 0.0118 -0.381 (0.333) (0.267) OECD 0.931 0.209 (0.588) (0.183)
GDP_cap -1.87e-05 2.78e-06
(1.64e-05) (4.71e-06) Time_estimation 0.0463 0.0482 0.0474 0.0540 0.0505 0.0449 0.0496 0.0477 0.0491 (0.0312) (0.0305) (0.0326) (0.0331) (0.0322) (0.0295) (0.0304) (0.0293) (0.0300) Multi_country 1.484* 1.394** (0.786) (0.627) Dynamic 0.404 0.213 (0.582) (0.238) MIRAGE 1.756* 0.307 0.323 0.327 0.269 1.575** 0.406 0.261 0.356 (0.890) (0.240) (0.275) (0.240) (0.234) (0.701) (0.259) (0.335) (0.248) Model_other 2.175** 0.986 0.953* 1.006* 1.004* 2.092** 1.110* 1.023* 1.044* (0.920) (0.576) (0.548) (0.567) (0.577) (0.881) (0.580) (0.558) (0.567) Armington 0.0616 0.0529 (0.464) (0.395) Land -1.404* -1.102 -1.144* -1.188* -1.152 -1.459* -1.034 -1.172* -1.062 (0.751) (0.657) (0.658) (0.640) (0.675) (0.761) (0.639) (0.651) (0.648) Land_surface -3.58e-09
VARIABLES (1) (2) (3) (4) (5) (6) (7) (8) (9) (5.03e-09) Productivity 1.052** 1.022* 1.025* 1.034* 1.053* 1.014** 1.001* 1.010* 1.015* (0.475) (0.508) (0.503) (0.510) (0.527) (0.464) (0.494) (0.497) (0.504) Biodiesel 0.689 0.496 0.484 0.566 0.482 0.762 0.482 0.503 0.491 (0.459) (0.402) (0.396) (0.388) (0.401) (0.509) (0.398) (0.385) (0.402) Biodiesel_bioethanol -0.541 -0.0531 -0.111 -0.0359 -0.0894 -0.361 -0.00187 -0.0708 -0.0240 (0.425) (0.314) (0.309) (0.316) (0.316) (0.332) (0.308) (0.310) (0.303) Constant -145.8 -0.563 -0.602 124.9 -0.494 -1.559** -0.739 -0.448 -0.662 (382.8) (0.511) (0.544) (108.9) (0.473) (0.650) (0.485) (0.486) (0.455) Observations 227 227 227 227 227 227 227 227 227 R-squared 0.369 0.284 0.293 0.289 0.286 0.323 0.291 0.296 0.285
Robust standard errors in parentheses *** p<0.01, ** p<0.05, * p<0.1