HAL Id: hal-01622923
https://hal.uca.fr/hal-01622923
Submitted on 24 Nov 2017
HAL is a multi-disciplinary open access archive for the deposit and dissemination of sci-entific research documents, whether they are pub-lished or not. The documents may come from teaching and research institutions in France or abroad, or from public or private research centers.
L’archive ouverte pluridisciplinaire HAL, est destinée au dépôt et à la diffusion de documents scientifiques de niveau recherche, publiés ou non, émanant des établissements d’enseignement et de recherche français ou étrangers, des laboratoires publics ou privés.
A Tool for Topographic Analysis of Electrode Contacts
in Human Cortical Stimulation
Jean-Marie Favreau, Simone Hemm, Christophe Nuti, Jerome Coste, Vincent
Barra, Jean-Jacques Lemaire
To cite this version:
Jean-Marie Favreau, Simone Hemm, Christophe Nuti, Jerome Coste, Vincent Barra, et al.. A Tool for Topographic Analysis of Electrode Contacts in Human Cortical Stimulation. 11th Inter-national Conference on Computer Vision (ICCV 2007), IEEE, Oct 2007, Rio de Janeiro, Brazil. �10.1109/ICCV.2007.4409174�. �hal-01622923�
A Tool for Topographic Analysis of Electrode Contacts in
Human Cortical Stimulation
Jean-Marie Favreau
(1,2,*), Simone Hemm
(3), Christophe Nuti
(3,4), Jérôme
Coste
(3,5), Vincent Barra
(1), Jean-Jacques Lemaire
(3,5)1. LIMOS/CNRS, Blaise Pascal Univ.Clermont-Ferrand, France 2. ENS Cachan
3. Inserm, ERI 14, Clermont-Ferrand, F-63001, France
4. CHU Saint-Etienne, Hôpital Bellevue Service de Neurochirurgie Saint-Etienne, F-42055, France
5. CHU Clermont-Ferrand, Hôpital Gabriel Montpied Service de Neurochirurgie A Inserm, ERI 14 Clermont-Ferrand, F-63001, France
* Corresponding autor : Jean-Marie Favreau [email protected]
Keywords: Electrodes, Humans, Magnetic resonance imaging, Pain, Surfaces,
Magnetic analysis, Computed tomography, Biomembranes, MONOS devices, Image analysis
Abstract
Electric chronic stimulation of the human motor cortex (ECSM) has been reported to alleviate chronic severe pain. However the mechanism of action of ECSM is still hypothetical. This is due mainly to the poor knowledge of, 1) the electric diffusion through the multiple structures beneath the epidural contacts (i.e. dura matter, cerebrospinal fluid space, arachnoid membrane, grey and white matter layers, pie mere and vascular tree), 2) the absence of consensus concerning the stimulation parameters (mono versus bipolar stimulation, cathodic or anodic current) and 3) the detailed cortical topography of the contacts. In this study we focused on the precise identification of the cortical areas covered by the electric contacts in a series of twelve patients operated on for ECSM. We propose a new automatic tool for topographic analysis able to compute 2D maps from the 3D anatomic MRI with bijective transformation (point-to-point correspondance). Anatomical regions of interest (AROIs) were visually identified, manually outlined and extracted (Iplan, BrainLab, Germany) for further analysis: 1) for the anatomic structures, on pre operative T1-weigthed magnetic resonance imaging (MRI), the frontal (superior or F1, intermediate or F2 and inferior or F3), the pre central and the post central gyrus; 2) for the electrode contacts (Resume, Medtronic, USA), on post operative computerized tomography (CT). After getting white and gray matter membership maps by automatic segmentation, we produced a cortical mask to build a triangular mesh. We defined a homeomorphism between the 3D mesh and a subset of ℝ2
and could apply in consequence the circle packing algorithm. We built depth maps (distance to the skull), distance-to-contact maps (distance to a given electrode contact) and anatomic structure maps. Results showed that it was easier to accurately define the location of the contact projection on the cortex allowing physicians to correlate the benefit with the topography. In particular, because of the unfolding, it was easier to integrate the cytoarchitectonics (i.e. the manually identified AROIs) knowledge in the analysis. Beyond the better understanding of ECSM and
indirectly of the pathophysiologic process of chronic pain, this new tool might be used in the future for image guided electrode positioning.
Introduction
Electric chronic stimulation of motor cortex (ECSM) through epidural electrodes has been reported to control chronic pain [4, 18]. However the mechanism of action of ECSM is still hypothetical because of our poor knowledge of both biophysical and pathophysiologic mechanisms. The electric diffusion through the multiple structures beneath the epidural contacts is extremely complex and simplified in order to attempt to analyse the clinical effects [14]. On the other hand the pathophysiologic mechanisms of central neuropathic chronic pain rely on several anatomic, physiologic and pathophysiologic knowledge, in both clinical and experimental domains, not enough to conclude. Recent advances in neuroimaging show the complexity of the phenomenon [15]. In practice the ECSM is supposed to act through a neuromodulation of the primary motor area located on the pre central gyrus and the frontal slope of the central sulcus as repetitive transcranial stimulation [12]. Beyond the biophysical considerations, the absence of reproducible effect [5] raises questions on the influence of the reorganization of functions on the surface of the brain [3] and on the exact location of electric contacts. This latter is still imprecise because of the complexity of gyration and sulcation which makes difficult the interpretation of topography in 3D even with the most recent surgical navigation tools.
Most people consider that the final electrode position determined at the end of the surgery using the neuronavigation system is precise enough for further analysis. Afterwards the position of each electric contact is projected on a schematic representation of the central region, the mean position of the sulci and fissures seen on superficial computer tomography (CT) reconstructions [16]. Another possibility is the projection to a classical brain atlas such as the Talairach atlas [21] or the
normalization of the patient information to Talairach space with a subsequent data projection onto a representative Magnetic Resonance Imaging (MRI) slice [19]. Both approaches are hindered by the low anatomic precision due to the schematic representation for the former and to the relative probabilistic location without reference to the individual patient’s brain for the latter. Furthermore, the complex structure of the cortex makes it difficult to define cortical areas implicated in the stimulation. Postoperative CT or MRI scans are still rarely performed. A tool for the topographic analysis of the cortex is thus essential for neurosurgeons not only to understand brain’s topological structure but also to localize the final anatomic position of each stimulating contact. It should have a precise location system, specific for each brain and taking into account morphological specificities. Furthermore, the presentation mode should be adapted in order to compensate for the irregular cortex convolutions. Several authors in different domains have proposed 2D reconstructions of the cortical surface instead of 3D representations. Most of them worked on retinotopic maps with fMRI studies, using cortex unfolding. Van Essen et al. [7] built a smoothed surface and mapped cortical surface onto an ellipsoid. This representation is a good preview of cortical surface, but has some limitations. An ellipsoid cannot be easily drawn in a plane without distortion and this kind of map cannot be printed with good precision. Warnking et al. [23] proposed a flattening algorithm to unfold the visual cortex. After projecting nodes on the plane using representative nodes as anchors, their iterative method minimized geodesic length distortion. The main limitation of these methods is the non-bijectivity between the original surface and the resulting map: two points on the original cortical surface can be computed at the same location on the unfolded surface. A connection tool between both 3D data and resulting map is then infeasible. Haker et al. [9] used differential geometry to produce a quasi-conformal bijective mapping of surfaces homeomorphic to a ball. However in our application, cortical surface is not homeomorphic to a ball, first because we are only working on a small part of the brain, second because data we are using are MRI: in this context, gaps between two parts of the cortex may be less than the voxel size, producing a connection on the
resulting surface (PVE). Hurdal et al. [10] computed a bijective flattening of a cerebellum using 27 MRI acquisitions from a single subject. In clinical routine it is not realistic to obtain so many images and the method should be automatic. As in Haker’s method, Hurdal assumed that the segmented surface was homeomorphic to a ball, without local topology defaults. Both methods are not appropriate for clinical data.
Herein we propose an automatic tool for topographic analysis able to produce 2D maps from a single 3D anatomic MRI with bijective transformation. In the context of the chronic stimulation of motor cortex for analgesic intention, this tool offers to our knowledge a new and unique approach for anatomical analysis and automatic localization. In the following, we first present our three steps method .Then we describe different maps that can be constructed in ECSM and that can be visualized in connection with 3D anatomical data. Finally, we apply our algorithm to twelve patients treated by ECSM and we discuss the interest of this tool in neurosurgery.
Method
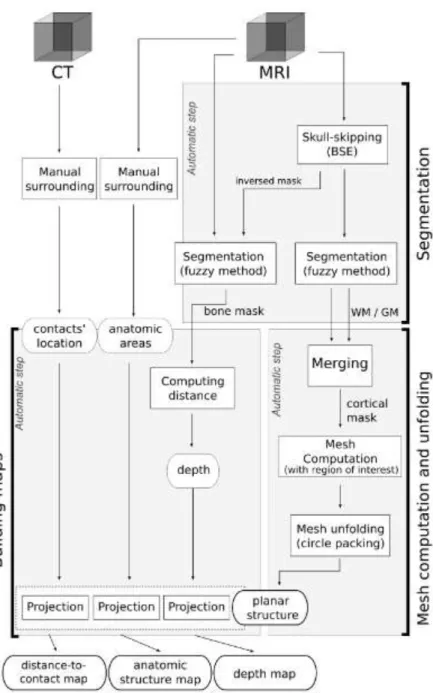
Fig. 1 presents an overview of our method. Given an MRI data set and a region of
interest (ROI) we detected the cortical surface, then unfolded it into the plane. This resulting map was used to display information such as topological areas or electrodes’ position. Each step is detailed in this section. In our application, maps are among others based on a manual segmentation of contacts and brain cortical areas.
1.Segmentation
For bone and brain structure we used a fuzzy segmentation algorithm. We first performed a skull-stripping using the Brain Surface Extraction (BSE) [20], which recently proved to be the most powerful algorithm compared to the classical ones [8]. Given this brain mask, brain segmentation was performed using a Possibilistic Clustering Algorithm [11] which has proved to compute real memberships of voxels
to tissue classes [1], and not degrees of sharing across all classes as the classical fuzzy C-means [2].
Both white and gray matter fuzzy membership maps were then used to produce a cortical mask, used to build a triangular mesh and to select a ROI for unfolding.
2. Mesh computation
Given a coefficient δ ∈ [0,1], the criterion uGM,x + uW M,x ≥ δ. resulted in a a binary
volume describing parenchyma membership. Some resulting defaults can be removed using a morphological operation like opening.
This last step produced a binary volume that defined the brain mask. For practical purposes we used a fixed δ value (δ = 0.70). We then applied the marching cubes algorithm [13] to build the cortical surface mesh, using isosurface defined by the mask edges. The resulting surface was a triangular oriented mesh, defined by a set of vertices V ⊂ ℝ3 and a set of triangles T ⊂V ×V ×V.
Since our application (see part 4) only needed a partial cortical mapping (the central sulcus and its neighborhood), we selected this ROI by manually setting the center and the radius of this region. This solely manual step allows to only keep triangles contained in the ROI to perform unfolding.
The unfolding method we used was based on topological properties of Riemann surfaces. Thus the initial surface had to be homeomorphic to a disc. A final selection step was thus needed to define a surface able to be correctly unfolded. Triangles included in the final selected region were computed using the given center. We first searched for the nearest triangle to the center and added it to the final mesh. We then successively added neighbor triangles t, and make sure they did not modify the topology of the resulting mesh. If so, the incriminated t were removed from the resulting surface, and added in a fifo structure processed later if feasible (Fig. 2). The resulting surface was included into the ball of interest defined by the center and the radius. Furthermore this surface was homeomorphic to a disc and could be fully unfolded.
3. Unfolding using Circle Packing
The unfolding process aimed at building a planar map representing the cortical surface, i.e. we wanted to define an homeomorphism between the surface mesh in 3D from the ROI and a subset of ℝ2
.
Many available methods do not produce bijective maps: one point on the resulting mesh may not have a single corresponding point in the original surface mesh in 3D. This limitation would be a major disadvantage for our application.
Because of the homeomorphic property, we applied the Circle Packing algorithm [6, 10] to produce a quasiconformal and bijective mapping. A conformal mapping f:A→B is a continuous locally bijective function preserving all angle measures. When A is a manifold defined by a triangular surface, there is not necessarily a conformal mapping between A and a subset of ℝ2
.
The circle packing algorithm is an iterative method that minimizes angular distortions and produces a bijective map. A circle is first associated to each vertex of the original mesh, with a radius value arbitrarily fixed. Radii on the edges of the mesh are defined using euclidean distance between boundary vertices. Radii of the vertices vi ∈ V contained in the mesh but not in the boundary are proceeded
iteratively. Then the following algorithm is computed until convergence of the radius values: for each circle c of V, the new radius value is readjusted using radii of its neighbors ci ,i = 0...n . First, we computed the sum of all angles ciccj defined by
neighbor triangles (ci,c,cj), afterwards radius of c is adjusted (increased Fig. 3(a) or
decreased Fig. 3(b)) to obtain a 2 π sum of angle then having a local planar piece of plane.
A planar location was finally computed for each vertex using circles radii. For each vertex a projection πV: V → ℝ2 can be defined using ℝ2 computed location and ℝ3
original location. Given πV and triangular surface, a projection π can be defined by
π: C→𝐶̅ where C ⊂ ℝ3 was the cortical surface and 𝐶̅ ⊂ ℝ2
its planar projection. This function was defined by π(V)πV(V) and by linear interpolation inside triangles. Circle
packing guarantees that C and 𝐶̅ are locally homeomorph, without foldings.
4. Building maps using projections
Quantitative maps were then easily computable from π. 3D data were projected on a resulting planar map summarizing much information and producing a useful tool for surgeons. Three maps were more particularly studied A distance map mp0, computed
using the Euclidean distance |·,·| between a chosen point p0 and each point of C.
This information was projected to the plane using π:∀x ∈ 𝐶̅ , mp0(x) = ∣ p0,π−1(x) ∣. This
first example produced a map with an hot spot corresponding to the part of the surface nearest to p0. A distance map mS to a subset S of space was also produced
using an approximation of Euclidean distance ( e.g. chamfer)dS. This distance
information was projected to the plane using π:∀x ∈ 𝐶̅ , mS (x) = dS(p0,π−1(x)). Based
on a subset S corresponding to a global surface overhead C, this second example produced a grayscale map that can be understood as a depth map.
Manual surrounding or automatic classifications can also be displayed on the unfolded surface using a simple projection. Given a set of classes C, and a classification c: ℝ3 → C of MRI voxels, a classification map m
C can be defined by:
∀x∈̄ 𝐶̅ ,mC (x)c(π−1(x)).
Application
1.Data
We applied our algorithm to twelve patients presenting neuropathic pain and treated by CSM.
Intra operative anatomical localization of the target was performed using a 3D navigation system (ISIS, St Martin d’Hères, France).The final positioning of electrode relied on empiric intra operative tryings, driven by various data from litterature (e.g. [22]). In order to cover the largest surface above the motor cortex two electrodes (Resume, Medtronic,USA), each with four contacts (diameter: 4 mm, center to center distance: 10 mm), were secured on the dura mater.
Retrospectively, in the frame of a research protocol, pertinent AROIs were visually identified, manually outlined and extracted (Iplan, BrainLab, Germany) for further analysis: 1) for the anatomic structures, on pre operative T1-weigthed MRI (voxel size 0.49×0.49×1mm3), the frontal (superior or F1, intermediate or F2 and inferior or F3), the pre central and the post central gyrus; 2) for the electrode contacts (Resume, Medtronic, USA), on post operative computerized tomography (CT, voxel size 0.53×0.53×1.25mm3). MRI and CT were matched using the mutual information algorithm [24] (IPlan, BrainLab, Germany) for further analysis. Because of the surgical technique used (epidural implantation, CSF-proof) there was no brain shift which could have influenced the analysis of geometric relationships between contacts and anatomic structures.
2.Results
We then determined the map center selecting the vertex of the cortical surface closest to the barycenter of the eight surrounded contacts. The only manual part of our method in this context was thus the choice of the map radius. The complete and fully automatic unfolding method, from segmentation to circle packing, was applied to the twelve patients.
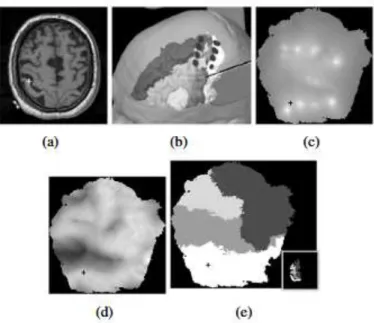
Three different maps were produced, representing available data on the unfolded surface. First we computed for each contact i the point pi in the MRI reference system by determining the barycenter of each contact. Distance-to-contact maps m pi were computed for each contact I and summed into an image (Fig.
4(c)). We then built a depth map mS by using the distance to the skull S (Fig. 4(d)).
subset. Furthermore an anatomic structure map mC was constructed from the
surrounded areas (Fig. 4(e)).
Figure 4. (a) axial T1-weigthed MRI slice used for intra operative navigation. (b) 3D
view with the AROIs (greyscale labelling, from white to black, post central gyrus, F2, pre central gyrus and F1) plus the 4 contacts (black full circle) of two parallel electrodes placed above the motor cortex and resulting unfolded maps of a patient suffering of neuropathic pain secondary to thalamic ischemic stroke. Maps: (c) distance-to-contact map, (d) depth map (e) and anatomic structure map. The common cursor (cross) is visible in all views.
Our tool provides a graphical user interface displaying together the preoperative MRI, the corresponding surrounded structures and the three maps described above. At the end of the unfolding step, an unique cursor is represented in all views, updated in real time following the user actions. The preliminary results showed that it was easier to accurately define the location of the contact projection on the cortex, allowing physicians to correlate the benefit with the topography. In particular, 2D maps simplify the interpretation of effects taking into account the functional organization of the motor cortex according to the gold standard pioneering works on the cyto-architectonics classifications [17].
Discussion
The tool we proposed here is an automatic method for topographic analysis to produce 2D maps from a 3D anatomic MRI acquired from a clinical protocol for cortical stimulation. It fills the clinical needs minimizing manual steps; the bijective unfolding offers a useful and ergonomic tool for the clinical procedure to navigate in the different views.
Until recently, neurosurgeons in our research group analyzed the final electrode contact position on a 3D view merging MRI and CT data including the surrounded structures and contacts (Fig. 4(b)). This was already a more sophisticated approach compared to the usual contact visualization on a schematic representation of the central region [16].Nevertheless, the 3D analysis was complex and time consuming (about one hour for the definition of AROIS). In spite of the anatomic knowledge, it is always difficult even impossible to determine the exact location of contacts mostly for sulcus folders which support in special areas most of the primary motor cortex.
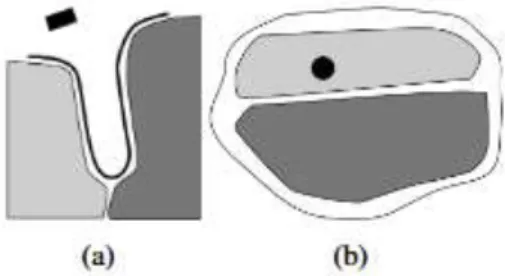
Our method does not need the intervention of a clinician to produce maps and offers some synthetic views of the cortical surface. After the automatic computation, only a few minutes are required to locate electrode contacts according to the structures, with a better precision than the 3D method notably inside the sulci: a contact overhead a suclus (Fig. 5(a)) cannot be easily localized without a map view (Fig. 5(b)). The planar representation increasing precision because of disambiguation of the electrode location onto the surface.
Figure 5. Simplistic outline of the localization problem: (a) cross section of a suclus
and (b) the corresponding unfolded map. In this figure, the black box is a modelling of the electrode, the black line is the segmented cortical surface, and the grey regions are segmented anatomical areas.
Further information were offered by assorted maps, like a skull depth map or the probabilistic location of the electrodes on the cortical surface. The understanding of this new representation is provided by an interactive interface using the bijection properties for navigation. Depth maps are also a major aid to understand topological properties displayed by this tool.Beyond these preliminary results, the main benefit of our tool is the precision of the location system. It offers many prospects in the clinical application of ECSM: localization of the contacts, identification of anatomical structures, correlation between anatomical data and clinical results, identification of the optimal target and surgical correction of the location of the electrodes. Meanwhile the complex topology of the cortex in some patients is not optimally processed during the construction of the ROI. It involves shattered maps that for the moment can not easily be explored.
Conclusion
We developed a promising and original tool with an ergonomic representation format. This tool is a quasiconformal optimal approach minimizing angles distortion.The main contribution of our bijective method is delivrance from topology constraint: original surface does not need to be homeomorphic to a disc or a ball, and unfolding is proceeded preserving global shape. In the context of ECSM, our
approach offers an original and complete tool for location, with many possibilities like localisation or data synthesis.
The next step will be to increase the quality of the maps by improving the construction of the ROI. For this, we are introducing an algebraic topological method. Our tool might be applied to compare the final anatomic position of each contact with the corresponding clinical results. Furthermore we intend to improve the preprocessing by building new maps like the electric field computed from the electrode position and from the stimulation parameters. Neurosurgeons intend to benefit from the higher precision introduced by the planar maps to define subparts within each cortical area to detail the clinical interpretation. In the long term, the different maps should be a helpful tool as from the surgical planning in order to optimize the contact positioning according to each individual patient’s brain.
Acknowledgments
The authors wish to acknowledge Pascale Picard (MD) for patient selection and follow-up.
References
[1] V. Barra and J. Y. Boire. Tissue segmentation on MR images of the brain by possibilistic clustering on a 3D wavelet representation. J Magn Reson Imaging , 11:267–78, 2000.
[2] J. C. Bezdek. Pattern Recognition with Fuzzy Objective Function Algorithms (Advanced Applications in Pattern Recognition) . Springer, July 1981.
[3] C. M. Butefisch. Neurobiological bases of rehabilitation. Neurol Sci, 27 Suppl 1:S18–23, 2006.
[4] D. Carroll, C. Joint, N. Maartens, D. Shlugman, J. Stein, and T. Z. Aziz. Motor cortex stimulation for chronic neuropathic pain: a preliminary study of 10 cases.
Pain, 84:431–7, 2000.
[5] R. J. Coffey and A. M. Lozano. Neurostimulation for chronic noncancer pain: an evaluation of the clinical evidence and recommendations for future trial designs.
[6] C. R. Collins and K. Stephenson. A circle packing algorithm. Computational Geometry: Theory and Applications, 25:233–256, 2003.
[7] D. V. Essen, H. A. Drury, S. Joshi, and M. I. Miller. Functional and structural mapping of human cerebral cortex: solutions are in the surfaces. Adv. in neurology, 95:788–795,1998.
[8] C. Fennema-Notestine, I. B. Ozyurt, C. P. Clark, S. Morris, A. Bischoff-Grethe, M. W. Bondi, T. L. Jernigan, B. Fischl, F. Segonne, D. W. Shattuck, R. M. Leahy, D. E. Rex, A. W. Toga, K. H. Zou, Morphometry BIRN, and G. G. Brown. Quantitative evaluation of automated skull-stripping methods applied to contemporary and legacy images: Effects of diagnosis, bias correction, and slice location. Human Brain
Mapping, 2006.
[9] S. Haker, S. Angenent, A. Tannenbaum, R. Kikinis, G. Sapiro, and M. Halle. Conformal surface parameterization for texture mapping. IEEE Trans. on Vis. and
Comp.Graph., 6:181–189, 2000.
[10] M. K. Hurdal, P. L. Bowers, K. Stephenson, D. W. L. Sumners, K. Rehm, K. Schaper, and D. A. Rottenberg. Quasiconformally flat mapping the human cerebellum. In Procs. of MICCAI ’99 , pages 279–286, 1999.
[11] R. Krishnapuram and J. M. Keller. A possibilistic approach to clustering. IEEE Trans. on Fuzzy Syst. , 1:98–110, 1993.
[12] R. J. Leo and T. Latif. Repetitive Transcranial Magnetic Stimulation (rTMS) in Experimentally Induced and Chronic Neuropathic Pain: A Review. J Pain , 8:453–9, 2007.
[13] W. E. Lorensen and H. E. Cline. Marching cubes: A high resolution 3d surface construction algorithm. In SIGGRAPH ’87: Procs. of the 14th annual conference on Comp. Graph. and interactive techniques , pages 163–169, New York, NY, USA, 1987. ACM Press.
[14] L. Manola, J. Holsheimer, P. Veltink, and J. R. Buitenweg. Anodal vs cathodal stimulation of motor cortex: a modeling study. Clin Neurophysiol, 118:464–74, 2007. [15] A. May. Neuroimaging: visualising the brain in pain. Neurol Sci, 28 Suppl 2:S101–7, 2007.
[16] J. P. Nguyen, J. P. Lefaucher, C. Le Guerinel, J. F. Eizenbaum, N. Nakano, A. Carpentier, P. Brugieres, B. Pollin, S. Rostaing, and Y. Keravel. Motor cortex stimulation in the treatment of central and neuropathic pain. Arch Med Res,31:263– 5, 2000.
[17] R. Nieuwenhuys, J. Voogd, and C. V. Huijzen. The human nervous system. A synopsis and atlas . Berlin Heidelberg New York, 1981.
[18] C. Nuti, R. Peyron, L. Garcia-Larrea, J. Brunon, B. Laurent, M. Sindou, and P. Mertens. Motor cortex stimulation for refractory neuropathic pain: four year outcome and predictors of efficacy. Pain, 118:43–52, 2005.
[19] T. Schlereth, U. Baumgartner, W. Magerl, P. Stoeter, and R. D. Treede. Left-hemisphere dominance in early nociceptive processing in the human parasylvian cortex. Neuroimage, 20:441–54, 2003.
[20] D. Shattuck, S. Sandor-Leahy, K. Schaper, D. Rottenberg, and R. Leahy. Magnetic resonance image tissue classification using a partial volume model.
NeuroImage , 13:856–876,2001.
[21] J. Talairach. Atlas d’anatomie stereotaxique. Reperage radiologique indirect des noyaux gris centraux des regions mesencephalo-sous-optiques et hypothalamiques de l’homme . Paris: Masson & Cie, 1957.
[22] T. Tsubokawa, Y. Katayama, T. Yamamoto, T. Hirayama, and S. Koyama. Chronic motor cortex stimulation in patients with thalamic pain. J Neurosurg, 78:393– 401, 1993.
[23] J. Warnking, M. Dojat, A. Gurin-Dugu, C. Delon-Martin, S. Olympieff, N. Richard, A. Chhikian, and C. Segebarth. fMRI retinotopic mapping – step by step.
NeuroImage, 17:1665–1685, December 2002.
[24] W. Wells, P. Viola, H. Atsumi, S. Nakajima, and R. Kikinis. Multi-modal volume registration by maximization of mutual information. Med. Imag. Anal. , 1:35–51, 1996.