HAL Id: hal-00629340
https://hal.archives-ouvertes.fr/hal-00629340v2
Preprint submitted on 12 Dec 2011
HAL is a multi-disciplinary open access
archive for the deposit and dissemination of
sci-entific research documents, whether they are
pub-lished or not. The documents may come from
teaching and research institutions in France or
abroad, or from public or private research centers.
L’archive ouverte pluridisciplinaire HAL, est
destinée au dépôt et à la diffusion de documents
scientifiques de niveau recherche, publiés ou non,
émanant des établissements d’enseignement et de
recherche français ou étrangers, des laboratoires
publics ou privés.
Raman laser spectroscopy of Wannier Stark states
Gunnar Tackmann, Bruno Pelle, Adèle Hilico, Quentin Beaufils, Franck
Pereira dos Santos
To cite this version:
Gunnar Tackmann, Bruno Pelle, Adèle Hilico, Quentin Beaufils, Franck Pereira dos Santos. Raman
laser spectroscopy of Wannier Stark states. 2011. �hal-00629340v2�
G. Tackmann, B. Pelle, A. Hilico, Q. Beaufils, F. Pereira dos Santos∗
LNE-SYRTE, UMR 8630 CNRS, Observatoire de Paris, UPMC, 61 avenue de l’Observatoire, 75014 Paris, FRANCE
(Dated: December 12, 2011)
Raman lasers are used as a spectroscopic probe of the state of atoms confined in a shallow 1D vertical lattice. For long enough laser pulses, resolved transitions in the bottom band of the lattice between Wannier Stark states corresponding to neighboring wells are observed. Couplings between such states are measured as a function of the lattice laser intensity and compared to theoretical predictions, from which the lattice depth can be extracted. Limits to the linewidth of these transitions are investigated. Transitions to higher bands can also be induced, as well as between transverse states for tilted Raman beams. All these features allow for a precise characterization of the trapping potential and for an efficient control of the atomic external degrees of freedom.
Cold atoms trapped in optical lattices have proven to be well suited for simulating solid-state systems, making possible the observation of Bloch oscillations [1, 2], res-onant tunneling [3–5] or the Mott insulator regime [6]. Besides, the precise knowledge and control of the atomic external degrees of freedom in these systems make them promising for applications such as metrology [7, 8] or the development of inertial sensors [9, 10]. In a recent article [11] we showed that Raman pulses can be used to induce tunneling between neighboring sites of a 1D vertical lattice. The present article aims at providing a more detailed description of the system. In particular we use Raman spectroscopy to probe the energy structure of atoms trapped in a 1D vertical lattice. This study is mo-tivated by recent proposals to use such a system for short range forces measurements [12–15], or for the realization of a compact gravimeter [10, 16, 17]. It is also of interest for any experiment using a shallow optical lattice, as it provides a comprehensive characterization of the system. We consider atoms trapped in a vertical standing wave, created by a laser far detuned from resonance. This re-sults in a periodic potential, which is superimposed to the gravitational potential in the vertical direction. The internal atomic structure is approximated by a two-level system with long lived states |gi and |ei with energy dif-ference hνeg. The total Hamiltonian of this system is given by
ˆ
H = ˆHint+ ˆHl+ ˆHg, (1) where ˆHint = hνeg|eihe| represents the internal energy,
ˆ
Hl= U0(1 − cos(2klˆz))/2 is the periodic lattice potential with lattice depth U0, lattice wavenumber kl and verti-cal spatial coordinate ˆz, and ˆHg = mag ˆz represents the gravitational potential, where mais the mass of the atom and g is the gravity acceleration.
As known from solid state physics, the eigenstates of the external part ˆHl+ ˆHg, which is the sum of a peri-odic and a linear potential, are given by Wannier-Stark
∗franck.pereira@obspm.fr
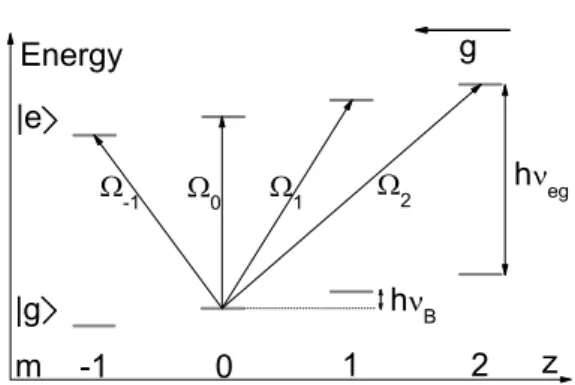
(WS) states [18, 19]. They form a so-called WS-ladder of states |Wb,mi, where b is the discrete well index of the Bloch band, which structures the eigenstates in the periodic lattice, and the discrete quantum number m is the well index, characterizing the vertical position of the wave function hz|Wb,mi and which labels the well contain-ing its main peak in the limit of deep lattices (U0≫ Er). The energy difference between adjacent lattice sites in the same band is simply the potential energy difference between two neighboring wells hνB = magλl/2, where λl= 2π/klis the lattice wavelength, and νBis the Bloch frequency. Considering only the bottom band (b = 0) and adding the internal Hamiltonian leads to a new WS-ladder like structure consisting of states |g, Wmi and |e, Wm′i (see figure 1).
g h eg h B -1 0 1 2 Energy z m -1 0 1 2 |e |g
FIG. 1: Wannier-Stark ladder of states and couplings between states by the probe laser
In this structure, the application of a laser field reso-nant to ∆E/h = νeg+ ∆mνB with ∆m = 0, ±1, ±2, . . . allows for coupling one state of this ladder to neighbor-ing WS states with opposite internal state, and thereby for the determination of the clock frequency νeg and the local gravity g in a spectroscopic measurement. In this, the inherent state labeling [20] gives us a tool for the precise measurement of the external state by
inter-2
nal state detection. Coupling of the ladder states be-comes apparent when adding a coupling Hamiltonian
ˆ
Hs = ¯hΩU0=0cos(ωt − ksz)|eihg| + H.c. to ˆˆ H, where
ΩU0=0 is the Rabi frequency in absence of the lattice
potential and ks= 2π/λsthe coupling laser’s wave num-ber [21]. From this, the coupling strength for transi-tions between pairs of these states either in the same well (∆m = m − m′ = 0), or in neighboring wells (∆m 6= 0) is calculated to be [21]:
Ω∆m= ΩU0=0hWm|e
ikszˆ
|Wm′i. (2)
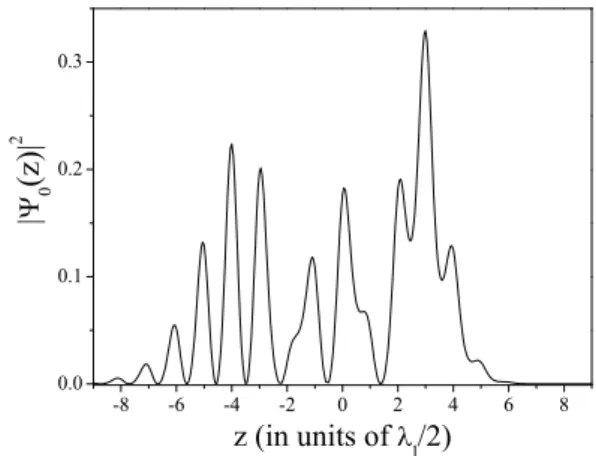
As we will see in more detail later in this paper, the lat-tice depth U0 plays an important role for driving these transitions. In too shallow lattices, the atomic localiza-tion is too weak and Landau-Zener (LZ) tunneling oc-curs, which limits the WS state lifetime. For too deep lattices, the WS states are localized in only one well, which strongly limits the intersite coupling strength and thus compromises spectroscopy measurements. Figure 2 illustrates the delocalization of the WS wavefunction at the depth of 1.6 Er we use in our experiment: it dis-plays the spatial density probability of WS wavefunction |Ψ0(z)|2
= |hz|W0i|2
, which extends over about 15 wells.
-8 -6 -4 -2 0 2 4 6 8 0.0 0.1 0.2 0.3 | 0 ( z ) | 2 z (in units of l /2)
FIG. 2: Spatial density distribution of the |W0i wavefunction
for a lattice depth of U0= 1.6 Er.
Intersite transitions can be realized choosing λs in the optical domain, with a single laser connecting two dif-ferent electronic states, such as the ground state and a metastable state of the optical clock transition studied in in [22]. Alternatively, they can be realized with two pho-ton transitions between the two hyperfine ground states of alkali atoms. In this paper, we will focus on this latter case. For87
Rb, transitions between the ground and ex-cited hyperfine levels |gi =
52
S1/2, F = 1, mF = 0 and |ei =
52S1/2, F = 2, mF = 0 can be driven using coun-terpropagating vertical Raman beams providing a fre-quency difference of νR = ν2 − ν1, that can be tuned around νeg = 6.834 GHz. This transition implies a mo-mentum transfer k = k1+ k2≈ 4π/λswith λs= 780 nm
replacing ksin equation 2. Here, ν1,2and k1,2are the re-spective frequencies and wavenumbers of the two Raman lasers.
The intersite coupling on this transition is discussed for different values of λl in section I. The experimen-tal apparatus is then presented and the observed cou-pling strengths are compared to theoretical values. The achieved linewidth surpassing the Fourier limit by less than a factor two in the range up to 1.4 s of spectroscopic interrogation time and its limitations are presented and discussed in section II. Finally, we show the observed longitudinal and transverse structures observed in our composed trap in section III.
I. COUPLINGS
The possibility to drive resolved intersite transitions strongly depends on the lattice wavelength and depth, as illustrated in figure 3. We calculated the coupling strengths as a function of the lattice depth (using a nu-merical calculation of the second term in equation 2, see also [21]) for ∆m = m′− m = ±1 transitions, for three different lattice wavelengths: close to resonance (λl = 800 nm), far blue-detuned (λl = 532 nm) and far red-detuned (λl = 1064 nm). The choice of these wavelengths is motivated by the availability of powerful enough lasers (≥ 20 W in the far detuned cases, up to several watts close to resonance), allowing to reach a suf-ficient depth of a few recoil energies with a relatively large waist (≈ 1 mm). Such a waist is required for minimiz-ing parasitic forces due to the dipolar potential gradient along the longitudinal direction when using such a sys-tem for high precision measurements (gravimetry, short range forces, fine structure constant [23]...).
0 2 4 6 8 10 0.0 0.1 0.2 0.3 0.4 0.5 0
Lattice depth (units of E r ) l =1064 nm l =532 nm l =800 nm
FIG. 3: Coupling strengths ∆m = ±1 versus lattice depth for three different lattices wavelengths λl = 532 nm, λl =
At sufficiently low depths, of a few Er, we find cou-pling strengths of the same order of magnitude for the far blue and red detuned cases whereas the intersite cou-pling remains small for the close to resonance case. We find relatively large variations and modulations for the far detuned cases, with respect to the close to resonance case. Calculations performed for ∆m ≥ 2 transitions showed similar behaviors. Nevertheless, tilting by the same angle both Raman lasers with respect to verticality allows to preserve the direction of k while reducing its magnitude, thus changing the coupling strengths. As an example, we plot in figure 4 the couplings in the close to resonance case for k reduced by a factor of 2, which corresponds to an angle of 60◦with respect to verticality. Although we find larger coupling strengths, which oscil-late versus lattice depths, couplings comparable to the far detuned cases for ∆m ≥ 1 are only reached at twice lower lattice depth.
0 2 4 6 8 10 0.0 0.2 0.4 0.6 0.8 1.0 l = 800 nm S = 1600 nm
Lattice depth (units of E r ) 0 1 2 3
FIG. 4: Coupling strengths ∆m = 0, ±1, ±2, ±3 versus lattice depth for a lattice wavelength λl= 800 nm and tilted Raman
beams giving an effective wavelength of λs= 1600 nm.
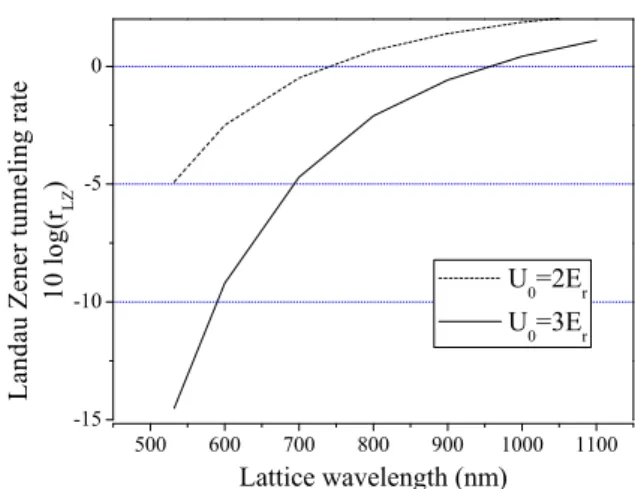
Another important parameter depending on the lattice wavelength is the tunneling rate out of the bottom band, which limits the lifetime of the atoms in shallow lattices. For an estimate of this rate, we use the Landau-Zener formula. Figure 5 displays the calculated rates as a function of the lattice depth (in units of recoil energies) for low depths of 2 and 3 Er. The LZ tunneling rate remains small in the far blue detuned case, even for lattices as shallow as 2 Er, whereas it becomes comparable to 1 s−1 for a lattice depth U0 between 2 and 3 Er in the close to resonance case. Operation at λl = 532 nm thus appears more appealing as one can combine large lifetimes and good couplings for large site offsets ∆m.
We have compared these calculations with measure-ments corresponding to the blue detuned case. Our
sys-500 600 700 800 900 1000 1100 -15 -10 -5 0 U 0 =2E r U 0 =3E r L a n d a u Z e n e r t u n n e l i n g r a t e 1 0 l o g ( r L Z ) Lattice wavelength (nm)
FIG. 5: Landau Zener tunneling rate as a function of the lattice wavelength for U0= 2 and 3 Er.
tem [11] consists in laser-cooled87
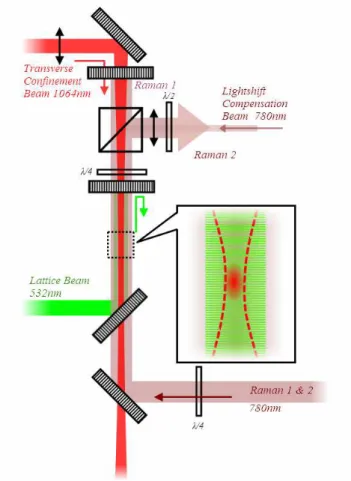
Rb atoms loaded in the first band of a vertical one-dimensional optical lattice, created by a single mode frequency doubled Nd:YVO4 laser (λl = 532 nm, maximal power 12 W) with a waist of about 700 µm. As this blue detuned standing wave does not provide transverse confinement, a red detuned (λ = 1064 nm, beam waist 200 µm) Yb fiber laser is su-perimposed to the lattice (see figure 6). The difference in the waists of the two lasers allows to reduce inhomo-geneities in the lattice depth due to the transverse ex-tension of the atomic sample. Before being transferred into this mixed dipole trap, about 107
atoms are loaded in a 3D-Magneto-Optical trap (MOT) and cooled down to 2 µK with a far detuned molasses. The dipole trap lasers are switched on either at the end of this cool-ing phase, or at the beginncool-ing of the MOT sequence. Switching off the molasses lasers leaves about 1 % of the atoms trapped in the mixed trap with a lifetime of about 1 s. These atoms initially distributed in all the Zee-man sublevels of
52S1/2, F = 2 are then depumped to
52S1/2, F = 1 before being optically pumped (98% ef-ficiency) on the 52S1/2, F = 1 → 52P3/2, F = 0 tran-sition to the 52 S1/2, F = 1, mF = 0 Zeeman sublevel, which is sensitive to stray magnetic fields only to sec-ond order. After being released from the optical trap, atoms fall for about 140 ms before reaching the detec-tion zone located at the bottom of the vacuum chamber. The detection scheme is based on a time of flight mea-surement similar to the ones used in atomic clocks and inertial sensors. It allows to measure by fluorescence the atomic populations in the two hyperfine states F = 1 and F = 2, denoted N 1 and N 2, respectively [24], from which we derive the transition probability P = N 2/(N 2 + N 1). The Raman transitions are driven by two counterprop-agating, circularly polarized beams at 780 nm, detuned
4
FIG. 6: Experimental setup. The laser beams for optical trap-ping (lattice at 532 nm and transverse confinement at 1064 nm) and Raman spectroscopy (780 nm) are superimposed us-ing dichroic optics.
from the atomic transition by about −3 GHz, and aligned along the direction of the optical trap beams. These are collimated with a 1/e2 radius of 1 cm, ensuring a good intensity homogeneity along the transverse size of the trap.
In order to determine the coupling strengths, a Ra-man spectrum is first scanned by measuring the transi-tion probability as a functransi-tion of the frequency difference between the Raman lasers νR. For such scans, the in-tensities in the Raman laser beams are 0.25 and 0.54 mW/cm2, and the duration of the Raman pulse is 8 ms. This ratio between the Raman intensities is chosen to cancel the differential light shift they induce on the fre-quency of the hyperfine transition [25].
We observe multiple resonances, corresponding to transitions between the two hyperfine levels at Raman frequencies equal to the hyperfine splitting plus or minus an integer number ∆m of Bloch frequencies (νB≈ 569 Hz in our system). The difference in the peaks heights is due to the difference in the coupling strengths. We then fix the Raman frequency difference at the center of each peak, record a Rabi oscillation pattern by measuring the transition probability as a function of the pulse length,
-6000 -4000 -2000 0 2000 4000 6000 0.0 0.2 0.4 0.6 T r a n s i t i o n p r o b a b i l i t y
Raman frequency detuning R
-eg
(Hz)
FIG. 7: Raman spectrum showing the transition probability as a function of the Raman frequency from a lattice depth of 1.6 Er. The resonances separated by the Bloch frequency
νB ≈ 569 Hz are the signature of intersite transitions.
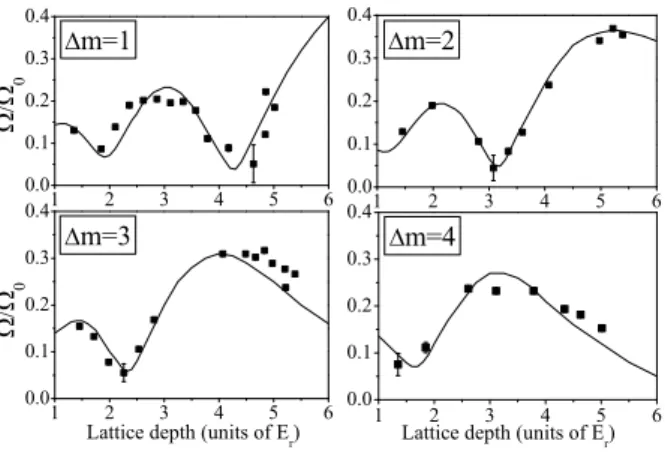
from which we extract the Rabi frequency. We repeat this procedure for different lattice laser power values. The measured coupling strengths of the ∆m = 0, 1, 2, 3 transitions are plotted in figure 8 as a function of the lattice laser power. The results have been normalized and the relation between lattice laser power and actual lattice depth has been adjusted for a better match with the theoretical predictions. Data points corresponding to minima in the couplings have larger error bars as inho-mogeneities in the Rabi frequencies damp so heavily the Rabi oscillations that almost no oscillations are observed. We attribute this inhomogeneity to the transverse spread of the atoms, which experience different lattice depths due to the Gaussian profile of the lattice beam.
The good agreement between the measurements and the theoretical predictions allow us to determine the depth with a resolution on the order of 0.1 Er from the direct comparison of the relative amplitudes of the peaks. Alternative techniques for the determination of the lat-tice depth are not as accurate here: diffraction in the thick grating limit [26] creates sidebands in the veloc-ity distribution which can hardly be resolved due to the width of the initial velocity distribution of the order of 2.5vr, and parametric excitation gives rise to very wide resonances due to the complete anharmonicity of the lat-tice potential.
II. LINEWIDTH
We then investigated the question of the linewidth of such transitions. Various effects are expected to con-tribute to the broadening of the transitions and to ul-timately limit the minimally attainable linewidth. One of them is the differential light shift (DLS) induced by the trapping laser beams. This effect is dominated by the light field of the transverse dipole trap, as atoms are trapped at the intensity maxima of the 1064 nm beam
1 2 3 4 5 6 0.0 0.1 0.2 0.3 0.4 1 2 3 4 5 6 0.0 0.1 0.2 0.3 0.4 1 2 3 4 5 6 0.0 0.1 0.2 0.3 0.4 1 2 3 4 5 6 0.0 0.1 0.2 0.3 0.4 0 m=4 m=2 m=3
Lattice depth (units of E r ) Lattice depth (units of E
r )
0
m=1
FIG. 8: Normalized Rabi frequencies measured as a function of the lattice depth, for ∆m = 1, 2, 3, 4. The normalization factor ΩU0=0is an adjustable parameter. Solid lines are the
result of numerical evaluation of equation 2.
and observe maximal DLSIR at its center. By perform-ing microwave spectroscopy on the |52
S1/2, F = 1, mF = 0i → |52
S1/2, F = 2, mF = 0i transition, we measure a shift in the center of the line of about 3 Hz/W, and a broadening of about 2 Hz/W, which gives a limit to the linewidth of 3 Hz at the 1.5 W we typically use. We have also measured the shift of the line induced by the lattice laser beam and found a much smaller effect of 0.4 Hz at full power.
10 100 1000
1 10
Raman transition without compensation
Raman transition with compensation
Microwave transition without compensation
Microwave transition with compensation
F W H M ( H z ) Pulse duration (ms)
FIG. 9: Linewidth (FWHM) of transitions between the hy-perfine states driven by a microwave probe in the same lattice well or by counterpropagating Raman lasers with ∆m = 3, as a function of the pulse duration τ . For each different pulse duration, the probe’s Rabi frequency Ω3 is adjusted so that
Ω3τ = π. The solid line shows the theoretical Fourier-limited
FWHM of a pulse of duration τ .
This broadening is illustrated in figure 9, which shows
the evolution of the linewidth as a function of the du-ration of the microwave pulse, where the microwave power has been adjusted for optimal transfer at reso-nance (which corresponds to the case of a π pulse), as well as in figure 10, which shows as a dotted line the mi-crowave spectrum corresponding to a pulse duration of 1.4 s. 8 12 16 20 24 0.0 0.2 0.4 0.6 0.8 T r a n s i t i o n P r o b a b i l i t y
Microwave frequency detuning (Hz)
FIG. 10: Transition probability as a function of the microwave detuning with (continuous line) or without (dotted line) the DLS compensation beam (see text), for a microwave pulse of τ = 1.4 s. The compensated transition’s detuning to the hyperfine frequency of 18.7 Hz is the Zeeman quadratic shift due to a bias field of 180 mG. The mean DLS imposed by the transverse trapping laser is −4.6 Hz.
The DLSIR induced by the transverse trapping laser can be compensated thanks to an additional laser beam with a blue detuning for the |ei state and a red detuning for the |gi state [27]. For that purpose, a small fraction of one of the two Raman beams is used, with an addi-tional detuning of 80 MHz in order to prevent undesired Raman transitions. This beam is superimposed with the transverse trapping laser beam and its size, position and power are adjusted to reduce the broadening of the mi-crowave transition. For a transverse trapping laser power of 1.5 W, the differential light shift is compensated with a power of 12 nW. Figure 10 displays as a continuous line the microwave spectrum for optimal compensation.
The linewidths of the Raman transitions are displayed in figure 9, for uncompensated (resp. compensated) DLSIR, as squares (resp. circles). The ratio between the intensities of the two Raman lasers is set to cancel (on average) the net differential light shift they induce. How-ever, due to differences in the spatial modes of the two Raman lasers and parasitic reflections, this compensation is not perfect, which leads to a broadening of the hyper-fine transition. As this broadening is proportional to the total Raman intensity, the linewidth is proportional to the Rabi frequency of the transition, only increased with
6
respect to the Fourier-limited microwave transition by a constant factor of about 1.5. Atom loss prevents us from driving longer transitions. Nevertheless, our system al-lows us to achieve a spectroscopic resolution of about 1 Hz, which can be of interest for selecting atoms in a single site of the lattice, as demonstrated in [28] with less resolved transitions.
In order to study the short term sensitivity of our sys-tem, we performed a spectroscopic measurement of the Bloch frequency by measuring alternately the frequency of the ∆m = +3 and ∆m = −3 and calculating the differ-ence to cancel any shift of the hyperfine clock frequency. We obtained a statistical uncertainty on the Bloch fre-quency of 2 × 10⁻⁵ in relative value after 1 s of integra-tion, which is a factor of 3 better than the previously reported sensitivity in [11] using Ramsey spectroscopy. The best sensitivity reported for a trapped accelerome-ter was 1.4 × 10⁻⁷ in relative value after one hour mea-surement time [10], which corresponds to an equivalent relative short term sensitivity of 9 × 10⁻⁶ at 1 s.
III. PROBING THE LATTICE’S LONGITUDINAL AND TRANSVERSE
STRUCTURES
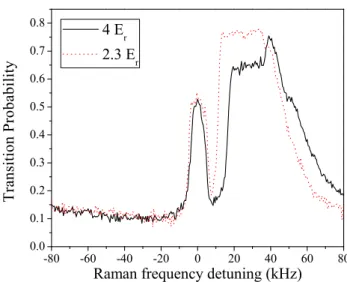
Performing the Raman scan over a larger frequency range reveals additional features. Figure 11 displays such a spectrum for two different lattice depths of 4 and 2.3 Er (measured by Raman spectroscopy as described in the last paragraph of section I). Note the large blue sideband, which corresponds to transitions from the bottom band to the first excited band. The absence of red sideband indicates that the trapped atoms have been loaded in the bottom band and that upper bands are not populated.
We have measured the lifetime of the atoms in the first excited band for a lattice depth of 4 Er. A Raman pulse of 2 ms detuned by 30 kHz transfers 60 % of the atoms initially in F = 1 in the excited band in the F = 2 state. When increasing the delay between the Raman pulse and the turning off of the lattice laser, and measuring the number of the atoms that have remained trapped, we observe a decay in the number of atoms in F = 2. Cor-responding data are displayed in figure 12, from which we extract an exponential lifetime of 16 ms. This rela-tively short lifetime explains that for trapping times as large as several hundreds of ms, only the bottom band is populated. Loading the shallow lattice from the initial thermal distribution simply selects atoms loaded in the bottom band.
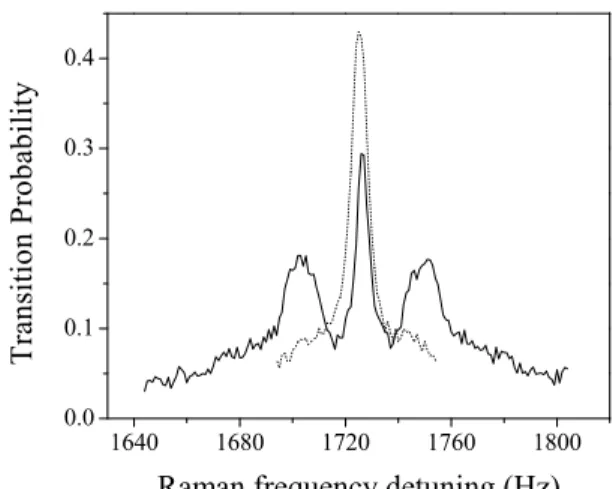
Transitions between vibrational states along the trans-verse directions can also be induced by the Raman lasers, provided that their effective wavevector projection along the transverse direction is not null. Such transitions are exploited for instance for Raman sideband cooling [29, 30]. To do so, we simply tilt the Raman retrore-flecting mirror. Figure 13 displays zooms of the Raman spectrum close to the ∆m = +3 transition, for a
Ra--80 -60 -40 -20 0 20 40 60 80 0.0 0.1 0.2 0.3 0.4 0.5 0.6 0.7 0.8 T r a n s i t i o n P r o b a b i l i t y
Raman frequency detuning (kHz) 4 E
r
2.3 E r
FIG. 11: Transition probability as a function of Raman fre-quency. The broad peak at vanishing relative Raman laser detuning (νRνeg= 0 corresponds to unresolved intersite
tran-sitions in the same lattice band. The large structure arising between 10 and 50 kHz is due to a coupling from the bottom to the first excited band.
0 100 200 0 5000 10000 15000 20000 25000 N u m b e r o f a t o m s i n t h e s e c o n d b a n d Trapping time (ms)
FIG. 12: Population in the first excited band as a function of trapping time. The solid line is an exponential decay fit to the data from which we extract a lifetime of 16 ms.
man pulse of 400 ms, for ~k perfectly vertical (continuous lines) and tilted by a few mrad (dotted line). We find red and blue sidebands about 25 Hz apart from the car-rier, which correspond to transitions ∆n = ±1, where n is the index of the transverse vibrational level. We find equal amplitude for both sidebands, indicating that atoms are distributed among many such n states. The transverse temperature was independently measured by
time of flight fluorescence imaging to be 1 µK. In addi-tion, the sidebands are significantly broadened with re-spect to the carrier. This broadening is attributed to the anharmonicity of the potential, the depth of the trans-verse dipole trap being only about 4 times the average transverse kinetic energy.
1640 1680 1720 1760 1800 0.0 0.1 0.2 0.3 0.4 T r a n s i t i o n P r o b a b i l i t y
Raman frequency detuning (Hz)
FIG. 13: Dotted line: Transition probability as a function of Raman frequency around the ∆m = +3 transition, when the Raman lasers wavevector is slightly misaligned from the lattice’s one. The two sidepeaks correspond to intersite tran-sitions involving a change in the transverse vibrational state. Solid line: the Raman lasers wavevector is aligned with the lattice’s one.
IV. CONCLUSION
We have investigated the possibility to drive intersite transitions in an optical lattice using Raman transitions.
We have shown that good couplings between neighboring wells and high resolution Raman spectroscopy could be achieved in a composite trap, formed by a shallow blue detuned vertical lattice combined with a 1064 nm laser progressive wave for transverse confinement. Broadening due to the inhomogeneity of the differential light shift of the trapping laser can be prevented using an additional laser beam for differential light shift compensation. Raman transitions allow for a precise determination of the parameters of the shallow 1D lattice (depth, band filling, radial oscillation frequency ...). This spectroscopic tool allows for a sensitive determination of the Bloch frequency, for instance using the Ramsey type interferometer scheme demonstrated in [11], and can be used for the measurement of short range forces, when such an interferometer is created close to a surface [12].
Acknowledgments
This research is carried on within the project iSense, which acknowledges the financial support of the Future and Emerging Technologies (FET) programme within the Seventh Framework Programme for Research of the European Commission, under FET-Open grant num-ber: 250072. We also gratefully acknowledge support by Ville de Paris (Emergence(s) program) and IFRAF. G.T. thanks the Intercan network and the UFA-DFH for financial support.
Helpful discussions with P. Wolf, S. Pelisson, M-C. An-gonin and R. Messina are greatfully acknowleged.
[1] M. Ben Dahan, E. Peik, J. Reichel, Y. Castin, and C. Salomon, Phys. Rev. Lett. 76, 4508 (1996)
[2] M. Gustavsson, E. Haller, M. J. Mark, J. G. Danzl, G. Rojas-Kopeinig, and H.-C. N¨agerl, Phys. Rev. Lett. 100, 080404 (2008)
[3] C. Sias, A. Zenesini, H. Lignier, S. Wimberger, D. Ciampini, O. Morsch, and E. Arimondo, Phys. Rev. Lett. 98, 120403 (2007)
[4] V. V. Ivanov, A. Alberti, M. Schioppo, G. Ferrari, M. Artoni, M. L. Chiofalo, and G. M. Tino, Phys. Rev. Lett. 100, 043602 (2008)
[5] E. Haller, R. Hart, M. J. Mark, J. G. Danzl, L. Re-ichs¨ollner, and H.-C. N¨agerl, Phys. Rev. Lett. 104, 200403 (2010)
[6] M. Greiner, O. Mandel, T. Esslinger, T.W. H¨ansch, and I. Bloch, Nature (London) 415, 39 (2002)
[7] M. Takamoto, F.-L. Hong, R. Higashi, and H. Katori, Nature (London) 435, 321 (2005)
[8] P. Clad´e, E. de Mirandes, M. Cadoret, S. Guellati-Kh´elifa, C. Schwob, F. Nez, L. Julien, and F. Biraben, Phys. Rev. Lett. 96, 033001 (2006)
[9] P. Clad´e, S. Guellati-Kh´elifa, C. Schwob, F. Nez, L. Julien, and F. Biraben, Europhys. Lett. 71 (2005), 730 [10] N. Poli, F.-Y. Wang, M. G. Tarallo, A. Alberti, M.
Prevedelli, and G. M. Tino, Phys. Rev. Lett. 106, 038501 (2011)
[11] Q. Beaufils, G. Tackmann, X. Wang, B. Pelle, S. P´elisson, P. Wolf, and F. Pereira dos Santos, Phys. Rev. Lett. 106, 213002 (2011)
[12] P. Wolf, P. Lemonde, A. Lambrecht, S. Bize, A. Landra-gin, and A. Clairon, Phys. Rev. A 75, 063608 (2007) [13] G. Ferrari, N. Poli, F. Sorrentino, and G. M. Tino, Phys.
8
Rev. Lett. 97, 060402 (2006)
[14] I. Carusotto, L. Pitaevskii, S. Stringari, G. Modugno, and M. Inguscio, Phys. Rev. Lett. 95, 093202 (2005) [15] A. Derevianko, B. Obreshkov, and V. A. Dzuba, Phys.
Rev. Lett. 103, 133201 (2009)
[16] M. de Angelis et al. , Proceedings of FET 11 conference to be published in Physics Procedia
[17] T. Kovachy, J. M. Hogan, D. M. S. Johnson, and M. A. Kasevich, Phys. Rev. A 82, 013638 (2010)
[18] G. Nenciu, Rev. Mod. Phys. 63, 91 (1991)
[19] S. R. Wilkinson, C. F. Bharucha, K. W. Madison, Qian Niu, and M. G. Raizen, Phys. Rev. Lett. 76, 45124515 (1996)
[20] Ch. J. Bord´e, Physics Letters, A140, 10-12 (1989) [21] P. Lemonde and P. Wolf, Phys. Rev. A 72, 033409 (2005) [22] L. Yi, S. Mejri, J. J. McFerran, Y. Le Coq, and S. Bize,
Phys. Rev. Lett. 106, 073005 (2011)
[23] R. Bouchendira, P. Clad´e, S. Guellati-Kh´elifa, F. Nez, and F. Biraben, Phys. Rev. Lett. 106, 080801 (2011)
[24] J. Le Gou¨et, T. E. Mehlst¨aubler, J. Kim, S. Merlet, A. Clairon, A. Landragin, and F. Pereira Dos Santos, Appl. Phys. B 92, 133 (2008)
[25] D.S. Weiss, B.C. Young and S. Chu, Appl. Phys. B 59, 217 (1994)
[26] Yu. B. Ovchinnikov, J. H. M¨uller, M. R. Doery, E. J. D. Vredenbregt, K. Helmerson, S. L. Rolston, and W. D. Phillips, Phys. Rev. Lett. 83 284 (1999)
[27] A. Kaplan, M. F. Andersen, and N. Davidson, Phys. Rev. A 66, 045401 (2002)
[28] M. Karski, L. Forster, J.M. Choi, A. Steffen, N. Belmechri, W. Alt, D. Meschede, and A. Widera , New J. Phys. 12 065027 (2010)
[29] S. E. Hamann, D. L. Haycock, G. Klose, P. H. Pax, I. H. Deutsch, and P. S. Jessen , Phys. Rev. Lett. 80 4149 (1998)
[30] H. Perrin, A. Kuhn, I. Bouchoule, and C. Salomon, Eu-rophys. Lett. 42, 395 (1998)