E L S E V I E R Magnetic Resonance Materials in Physics, Biology and Medicine 9 (1999) 85 91
M A G M A
Magnelk Resonance Materials in Physics, Biology and Medicinewww.elsevier.com/locate/magma
Single breath-hold slice-following CSPAMM myocardial tagging
M. Stuber ,,b.*, M.A. Spiegel a, S.E. Fischer a, M.B. Scheidegger a, P.G. Danias b,
E.M. Pedersen c p. Boesiger a
~ Institute o f Biamedieal Engineering and Medical ln/ormatics, Universi O, and E T H Zurich, Zurich, Switzerland
u Deparmwnt o f Medicine, Cardiovaseuktr Division, Beth Israel Deaconess Medical Center and Harvard Medical School, 330 Brookline Ave., Boston, MA 02215, USA
Department of Cardiothoracic attd [/asctdar Sargery, Skeiby Sygehus, Aarhus U4it'ersity Hospital, Aarhus, Denmark Received 17 May 1999: accepted 30 July t999
Abstract
Myocardial tagging has shown to be a useful magnetic resonance modality for the assessment and quantification of local myocardial function. Many myocardial tagging techniques suffer from a rapid fading of the tags, restricting their application mainly to systolic phases of the cardiac cycle. However, left ventricular diastolic dysfunction has been increasingly appreciated as a major cause of heart failure. Subtraction based slice-following CSPAMM myocardial tagging has shown to overcome limitations such as fading of the tags. Remaining impediments to this technique, however, are extensive scanning times ( ~ 10 min), the requirement of repeated breath-holds using a coached breathing pattern, and the enhanced sensitivity to artifacts related to poor patient compliance or inconsistent depths of end-expiratory breath-holds. We therefore propose a combination of slice-following CSPAMM myocardial tagging with a segmented EPI imaging sequence. Together with an optimized RF excitation scheme, this enables to acquire as many as 20 systolic and diastolic grid-tagged images per cardiac cycle with a high tagging contrast during a short period of sustained respiration. 9 1999 Elsevier Science B.V. All rights reserved.
Keywords: CSPAMM: Myocardial tagging; Myocardial motion analysis: Diastolic function; Torsion; Slice following
1. Introduction
Myocardial tagging has shown to be a useful mag- netic resonance (MR) modality for the assessment and quantification of local myocardial function [1-8] in the healthy and in the diseased state. This technology is also gaining greater use in the assessment of time dependent changes due to its non-invasive acquisition and ease for serial assessments at rest and during stress
[41.
M a n y myocardial tagging techniques suffer from the rapid fading o f the tags which m a y not be reliably detected after end-systole [9]. However, left ventricular diastolic dysfunction has been increasingly appreciated
* Corresponding author. Tel.: + 1-617-6678037; fax: + 1-617- 9755480.
E-mail address: [email protected],edu (M. Stuber)
as a major cause of heart failure [10,11]. Subtraction based C S P A M M [12] is a technique that prolongs the persistence o f the tags into diastole and has been ex- tended with a slice-following concept to avoid misregis- tration in short axis views [13] due to base-to-apex shortening [14]. These two advantages o f C S P A M M have recently been shown to be most valuable for clinical patient studies in which systolic and diastolic left ventricular torsion was investigated [15]. Major limitations to this technique are extensive scanning times, the requirement of repeated breath holds using a coached breathing pattern and the enhanced sensitivity to artifacts related to p o o r patient compliance or incon- sistent depths of end-expiratory breath-holds. While successful breath-hold tagging techniques have already been described [9], single breath-hold techniques in conjunction with slice-following C S P A M M M R my- ocardial tagging have not previously been reported.
86 M. Stuber et al. ,' Magnetic Resonance Materials in Physics, Biology and Medicine 9 (1999) 85-91
Tagging
Imaging
(repeated n times)90 ~ • ~ (a) (d) I ! G p~p~ation G ... (c) Cs I ,r
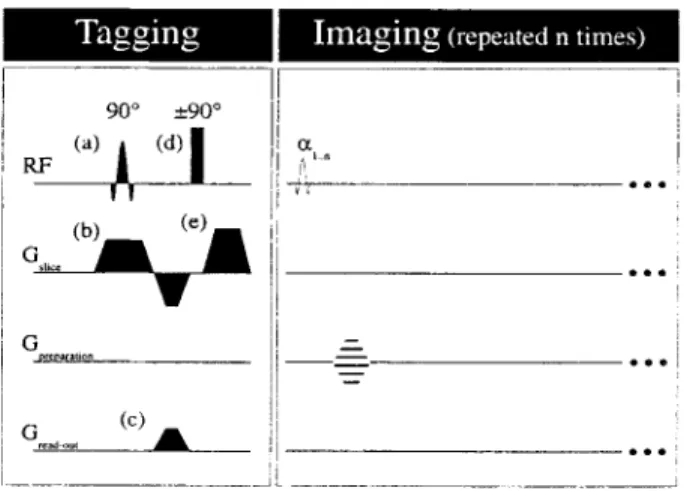
Fig. 1. CSPAMM myocardial tagging procedure in combination with a multi heart-phase segmented echo planar imaging (EPI) sequence. After slice selection (RF pulse (a) and gradient (b)), the transverse magnetization is spoiled with the tagging gradient (c). The RF block-pulse (d) rotates the modulated transverse magnetization into positive or negative z-direction. Gradient (e) finally spoils the remain- ing transverse magnetization. For the imaging part of the sequence. the EPI readout is performed for n heart-phases with corresponding RF excitation angles :q ... for imagingl
2. M e t h o d s
2.1. Background
F o r cardiac applications, tissue tagging (or the spa- tially dependent modulation o f the magnetization) is typically applied after the detection of the R-wave o f the ECG. Subsequently, different phases o f the cardiac cycle are imaged using a multi heart-phase imaging sequence.
The following considerations apply for multi heart- phase imaging sequences in which one R F excitation for imaging is applied per heart-phase and k-space segment. F o r a C S P A M M experiment in which n heart-
phase images are acquired per cardiac cycle (Fig. 1), the signal intensity Irk for the k t h (k = l...n) heart-phase image has been described [12] as
k - - I
Irk ~ Ms~TAG(x, y ) exp( - At~T1) 1-[ c~ sin(:~k)
j = l
(1)
where Mss is the steady state magnetization; T A G ( x , y ) is the spatially dependent ( x , y ) modulation o f the magnetization; At is the interval between the heart- phase images (i.e. temporal resolution); ~E...:~,, are the R F excitation angles (Figs. 1 and 2). The signal inten- sity Irk in Eq. (1) is (a) scaled by the tissue specific time constant T1 and (b) scaled b y the R F excitation angles which were applied for imaging. To obtain a constant signal intensity for each acquired image (lr~-= Irk_ ~), these two effects need to be compensated by the appli- cation o f the ramped flip angle series [14]::q- - t = a tan(sin(c~ D exp( - At~T1) ( 2 )
Using a repetitive, coached breathing pattern in which signal sampling is performed during a short, sustained breath-hold period every fourth heartbeat, an :~,, = 90 ~ was proposed [14] and has been utilized suc- cessfully [15] as a starting angle for the recursion in Eq.
(2).
However, for single breath-hold techniques in which signal sampling during each cardiac cycle would be preferable, the application o f :~,, = 90 ~ is not practical, since the steady state magnetization and consequently the signal-to-noise ratio (SNR) and contrast-to-noise ratio ( C N R ) would be c o m p r o m i s e d due to a shortened relaxation time treUx (Fig. 2). Thus, the R F excitation angle series :g...:q, needs to be adapted for single breath-hold C S P A M M applications. ECG RF excitation T R
I
"1
L ....
L
j
/ a ~ /...,, illllll[
A t n -J~ 41- t~llz,%
TimeFig. 2. Temporal relationship between the R-wave of the ECG, the tagging part of the sequence and the imaging part of the sequence. The tagging procedure is performed typically after the detection of the R-wave of the ECG. The time-intervaI in-between the tagging procedures is TR. The time delay between the n heart-phase images is At and the delay between the last RF excitation for imaging and the subsequent tagging procedure is trek, x. The variable RF excitation angles for imaNng are denoted as :g...zq,.
M. Stuber et al. Magnetic Resonance Materials in Physics, Biology and Medicine 9 (1999) 85-91 87
2.2. Numerical simulation
To maximize the relative signal amplitude, Irk, of Eq. (t) as a function of the RF excitation angles, a numer- ical simulation using Eqs. (1) and (2) was implemented under PV-Wave | 6.0, (Visual Numerics, Houston, TX). The simulation included a multi heart-phase tagging experiment in which acquisition of 20 images per car- diac cycle were simulated. The ranges of the parameters utilized in the simulation were 0 - 9 0 ~ for the initial R F excitation c~,,, 0 - I 0 0 ms for the time resolution At and
500-4000 ms for the repetition time TR. A myocardial
muscle T1 of 850 ms was assumed.
2.3. Implementation
Single breath-hold slice-following CSPAMM my- ocardial tagging was implemented on a Philips Gy- roscan ACS-NT 1.5T system (Philips Medical Systems, Best, NL) equipped with a CPR6 extended cardiac software package, a five element cardiac synergy coil and a PowerTrak6000 gradient system (23 mT/m; 105 mT/m per ms). A multi heart-phase segmented echo- planar imaging sequence with variable RF excitation flip angles was combined with the tagging part of the sequence (Figs. I and 2). The excitation angle c~ can be adjusted interactively by the operator. The dependent RF excitation angles c~,,_ 1.--0~1 are then calculated auto- matically by the scanner software according to Eq. (2). This implementation takes advantage of a reduced k- space acquisition scheme [9] in which horizontally and vertically line-tagged images are both acquired during a single breath-hold while the line orientation is automat- ically changed during the breath-hold period.
The thickness of the imaged volume (ds) and the
offcenter of the tagged slice with respect to the imaged volume (Zo) can be adjusted to account for variable amounts of systolic base-to-apex shortening at different anatomical levels of the heart (Fig. 3).
2.4. Examination protocol for in vivo applications
Six male volunteers (age 28 + 6 years) were investi- gated in the supine position using ECG triggering. In each individual, grid-tagged cine images were acquired on an apical, a mid and a basal myocardial level. In addition, line tagged images were acquired in a four- chamber view. For each slice, the volunteers were in- structed to hold their breath at end-expiration during 12 heartbeats. Twenty images were acquired with a temporal resolution (At) of 35 ms and a tag line distance of 8 mm. In one volunteer, a supplementary scan with an e, of 90 ~ was applied for comparison.
The field of view (FOV) was 300 m m with a sampled matrix of 128 data points in read-out direction. The
thickness of the tagged slice (dz, Fig. 3) was 8 mm.
Zo--..x/
:2
"... -. ,~ ) \ ' "7"
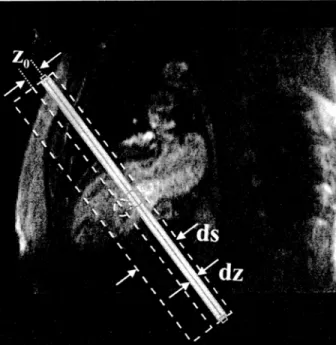
\ X X \ x k /Fig. 3. Planning of a double oblique short axis tagging experiment at a basal level of the heart. A single oblique end-diastolic long axis view is overlaid by the graphic elements which are interactively used for localization. The gray, solid rectangle refers to the tagged slice of the thickness dz. The hatched rectangle shows the volume which is imaged. This imaged volume has to encompass the extent of the motion (base to apex shortening) of the initially labeled thin slice during the cardiac cycle. The thickness of this imaged volume is ds and the offcenter of the center of the tagged thin slice with respect to the center of the imaged volume is z 0.
With a reduced k-space [9] acquisition scheme (25% of k.<profiles), an in-plane resolution of 2.3 x 2.3 mm is obtained after multiplication of the horizontally and vertically line tagged heart-phase images. After each RF excitation applied for imaging, nine echo-planar
read-outs with a TE of 5.4 ms were performed (Fig. 1).
The thickness (ds) of the imaged volume (Fig. 3) was 30
mm at the base, 25 mm at the mid-ventricle and 20 mm at the apex of the heart. For the four-chamber acquisi- tion, the thickness of the imaged volume was 15 mm. The offset (zo) of the tagged slice in relation to the imaged volume (Fig. 3) was 12 mm at the base, 6 mm at the mid-ventricle and 0mm at the apex. For the four chamber acquisition, no offset between the tagged and the imaged volume offcenters was used.
2.5. Image analysis
In all volunteers, the tagging contrast (CNR) was evaluated in a user specified region-of-interest (ROI) in the intraventricular septum. The difference between maximum and minimum signal within the septum was related to the noise level as determined from an ROI anterior to the sternum ( = standard deviation of the signal in this region). This analysis was performed for
88 M. Stuber et al.., Magnetic Resonance Materials in Physics, Biology and Medicine 9 (1999) 85-91
all four anatomical levels and for each heart phase image.
3. Results
3. I. Numerical simulation
Fig. 4, displays the results from the numerical simula- tion o f the Eqs. (1) and (2) using a heart-phase interval
0.40 0.30 E < "-~ 0.20 ._~ .~ 0. t0 0.0( 0 S 20 40 60 80 I O0 (a) (350 -8 o.-~o ~ 0.,30 ~:~ 0.20 }A ~ 010 0.00 & < ,.A
Last RF Angle a. [DEG]
, 9 , , 9 9 i 9 9 0 (bl i , , ~ i , i i i , ~ i i , ~ i i i 20 40 60 80 10@ Heart-phase Interval At [ms] 100 80 ~ 20 2O (r = . . . 40 60 80 100 Heart-phase Interval At [ms] --4000
J
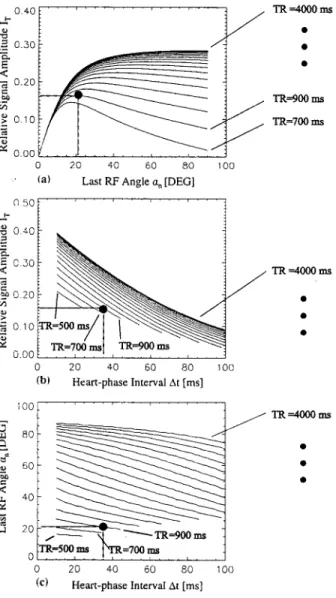
J ~ = 7 ~ J j TR =4000 msFig. 4. Signal optimization for n = 20 heart-phase images. (A) Rela- tive signal amplitude derived from the tagged component of the magnetization. The relative signal amplitude is plotted as function of the last RF excitation angle for imaging (~,,). The data are plotted for a fixed heart-phase interval At of 35 ms taking multiple repetition times TR into account. The black dot indicates maximum signal intensity for a repetition time of 900 ms. Maximum signal intensity is ensured if :~, = 21 ~ (B) Maximum relative signal amplitude which can be obtained by an optimized :~,,. It is plotted as a function of At and TR. (C) Optimized an as a function of At and TR (optimized for maximum relative signal intensity from the tagged component of the magnetization).
o f 35 ms and 20 heart-phase images per cardiac cycle. In Fig. 4A, the relative signal amplitude o f the tagged images is shown as a function o f the last R F excitation angle ~,, and the repetition time TR.
F o r coached breathing patterns in which image data are collected every fourth heartbeat ( T R ..~ 4000 ms), an ~,, = 90 ~ applied to the recursion shown in Eq. (2) yields a maximized relative signal amplitude (ITk ~ 0.29). This is consistent with previous findings [14]. I f T R is re- duced to time periods as typically required for single breath-hold experiments ( T R < 1000 ms), an e,, o f 90 ~ reduces significantly the relative signal amplitude. F o r such shortened TR values, m a x i m u m signal is obtained if an :~,, of 21 ~ is applied (Fig. 4A, black dot).
In Fig. 4B, the maximum relative signal amplitude (which may be obtained by the use of optimized R F excitation angles) is displayed as a function o f the heart phase interval (At) and the repetition time ( T R ) . En- hanced relative signal amplitude is predicted for pro- longed TR and shorter heart-phase intervals. Increasing At a n d / o r decreasing T R will result in signal reduction. Consistent with the findings o f Fig. 4A, the relative signal amplitude amounts to 0.16 if an optimized :~,, o f 21 ~ is utilized in combination with a TR o f 900 ms and a At o f 35 ms.
While the Fig. 4A and B display relative signal amplitudes as a function o f various imaging parame- ters, Fig. 4C shows the optimized R F excitation angles c~, which need to be applied for given At and T R values. Most obviously, lower R F excitation angles are pre- ferred for acquisition techniques in which data are acquired during successive cardiac cycles ( T R < 1000 ms). F o r a prolonged TR, the ~,, value m a y be increased.
3.2. Images
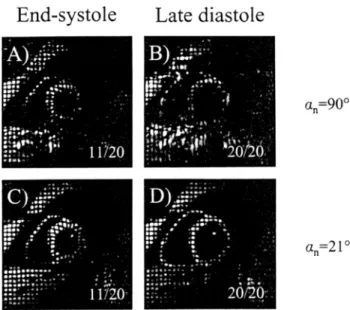
In Fig. 5, all 20 heart-phase images acquired at an apical level o f the heart in a volunteer (heart rate = 70) are displayed. The time series starts in early systole (35 ms after the R-wave o f the E C G ) and ends at 700 ms in diastole. The grid structure remains visible with a high tagging contrast up to the last acquired heart-phase image. N o fading o f the tags or degradation o f image quality is observed. In Fig. 6, three heart-phase images from a four chamber view are displayed. N o t e the vigorous base to apex shortening o f the basal right ventricle during systole (Fig. 5B, arrows, dotted line) with little movement at the apex (dashed line). Fig. 7 visualizes potential adverse effects on image quality which may occur if the R F excitation angles are utilized without optimization. The basal images displayed in Fig. 7 (upper panel) were acquired with an ~,, o f 90 ~ F o r comparison, the basal images in the lower panel were acquired with the optimized R F excitation scheme. The degradation in image quality is apparent
M. Stuber et al. " Magnetic Resonance Materials in Physics. Bioh~gy and Medicine 9 (1999) 8 5 - 9 1 I I i i l l l e i . - I i . i l i l i l , i + l I I I l i l i I ~ - . . . . - t = 3 5 m s I l i l I l i ~ aiii - - i i " l l i ~ i _ ~ , i l , t l I 9 i ~ t t I ~ I I i # l i l t o t i ,*~, - , r m s i I i i O o ,~ I l i l ~ I I l i i I l l l i e . l i l t ~ ~ l i t I t l " t i I + I I I I t ~l-,. i ~ t I # i l l i I i l l - t l - O ~ t Ii t l - " ' ' " ~'=3 [ 5 m s
t
I l 9 = ~ " l l l i * I f " l l O e i l i l l ~ - l t i l i 9 . . . . I I ~ i l t - l i p 9 l i i ~ . i - I I # l i " ' h ~ 4 5 5 ' . . . . m sillt;::'"
I
I l l " I I I ~ ~ l l I I I I i l ' - I I " * I l l I . . . t = 5 9 5 m s i I o ~ l I l l l ' ' . . . t = 7 0 m s I I l l FI-- i I i t ~ I I i t ~ . + I l l o ~ ,, i I 9 i l I 1 - l l i l t 9 I l l I I I I . . . , , t _ ~ 2 1 0 m s I I O I l i < - ~ I i t i ,~ , . ~ l i l i 'II;"
.,_,,';<
l l " =" " " " " ) I I ' . i . - - : ; : ; ; t = 3 5 0 m s I I I 9 l i f e I l l t i t l l @ i I ~ . 6 1 '~ I t i I I t ~ i l i i w l ~ l " ' : t 4 9 0 m s . | I I l e ~, 9 + I I l i l l l e ~ 9 l i l t " I l l . i e l e ~ l i P t " l i l i t i ~ ll - 9 9 i e ~ I i I i i , l l i . . . . t = 6 3 0 m s I g I II ~, i l l l l ) I l l t - i ~ l n i l ~ t i ~ t I O I l t l l ~ I I I ~ i ~ I ~ ~ ! i ~ i ~ i i ~ ~ . _ , , - ~ m s ~ i ' : : : . I I O @ l i p . l l e ~ " . i I l i l ; , i - ~ ._ 9 ~ = 2 4 5 m sf
i l l I , ~ ~ ' " I I l 9 i l l I e I l l O , . f i l l t + ,~ I I P I l l . . " ~ - 1 8 ' o ~ ,~ I i . i i I l l l l l l l l t ~ i i i t " : : " " : t ' = 3 8 5 m s lil i i o i - J I I ~ ' , I I e ill I t I I I I I P I " - I I I .., e I w ~_ I l l i i 9 4 O I Jill I . _ 9 - : t = 6 6 5 m s , . - - - t = 1 4 0 m s l i l l e I l i t e ~ ~t I 0 9 ~ - a~'_ e l l t l t t l ! ' ~ , ~" ~ = 2 8 0 m s - 9 '~ - . I i I O " - ~ I l l - I t 0 ~ ' , I I n . " - . . . . t = 4 2 0 m s ; | l l ; g : ' " I I O , I I O O e ~ I i i e ~ IOlP I F ' o J O o l B . . . . - t : - 5 6 0 "~ m s 89; | : : : : . . ~
, I . i I I I - I m ~ ,re;ira I l l 9 , 4 r " 4 ItlP ~, e l l ~ po ! I ; ; ~ - t = 7 0 0 m sFig. 5. Twenty apical phases of the cardiac cycle imaged in a double oblique short axis plane of the myocardium (healthy volunteer). The images are acquired using single-breath-hold slice-following CSPAMM myocardial tagging. The acquisition duration was 12 cardiac cycles. The heart-phase interval (time resolution) At was 35 ms.and the heart rate 70 beats/min.
in this case if non-optimized R F excitation angles are utilized (upper panel).
3.3. Tagging contrast
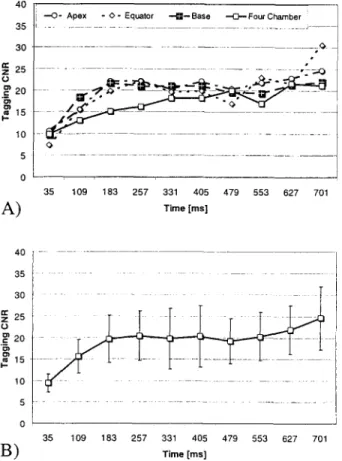
The results obtained from the evaluation of the tag- ging C N R at the apex, at the mid-ventricle at the base and in the four-chamber view are displayed in Fig. 8A. The tagging C N R for all four anatomical levels is plotted versus time. Consistently, a high tagging C N R is observed for all anatomical levels and for all the acquired heart phase images. In Fig. 8B, the tagging
C N R averaged over all measured anatomical levels including the standard deviations are given as a func- tion o f the measured heart-phase image. The average tagging C N R over the cardiac cycle was 19.1 _+ 2.6. A tendency o f an increasing tagging C N R as a function of the measured heart-phase image can be observed.
4 . D i s c u s s i o n
By the combination o f slice-following C S P A M M my- ocardial tagging with the proposed R F excitation
90 M. Stuber et al. / Magnetic Resonance MuteriaL~" in Physics, Biolo<' and Medicine 9 (1999) 85 91
End-diastole
A)
1/2 0~ A p e x ~
End-systole
Late diastole
Fig. 6. Four chamber view at three different points in the cardiac cycle. Three out of 20 images are displayed. Image (A) refers to end-diastole, image (B) to end systole and image (C) to diastole. Note the substantial base to apex shortening of the basal right ventricle during systole (dotted line and arrows). The apex remains almost at the same position (dashed line). RA, right atrium: RV, right ventricle; LA, left atrium: LV, left ventricle.
scheme and a segmented EPI imaging sequence, as m a n y as 20 grid-tagged heart-phase images per cardiac cycle can be acquired reliably during one short period o f sustained respiration. With respect to earlier C S P A M M studies, this yields a substantially increased coverage o f the cardiac cycle [14,15] while image acqui- sition duration is reduced typically from several min- utes to 12 s.
The tagging C N R is consistently high for both sys- tolic and diastolic phases o f the cardiac cycle. Since this applies for all the measured anatomical levels of the heart, the most sensitive [15] and fastest occurring m o t i o n components such as systolic torsion and dias- tolic untwist can be assessed within one imaging procedure.
Due to the slice following capabilities of the se- quence, adverse effects o f through plane motion as induced by systolic base-to-apex shortening (Fig. 6) may be avoided since always the same tissue elements are displayed in the multiple heart-phase images. This enables true myocardial m o t i o n tracking [14].
Breath-hold slice-following C S P A M M myocardial tagging is based on a subtraction technique. Thus, the m e t h o d has a potentially enhanced sensitivity on image artifacts related to inconsistent depths o f subsequent breath-holds [16]. Since the grid-tagged cine images o f one anatomical level are now referring to one single breath-hold, such sensitivity m a y be minimized. Still, diaphragmatic drift during prolonged periods o f sus- tained respiration has been reported [16] and could be a limiting factor. Hereby, the combination o f C S P A M M myocardial tagging with prospective real-time navigator tracking could be a valuable enhancement [17] of the present methodology. However, this remains to be fur- ther investigated.
The present data suggest that the tagging contrast is increasing as a function o f the acquired heart-phase
image. This m a y partly be explained by unspoiled transverse magnetization (which was not included in the numerical simulation) or a slight underestimation of myocardial muscle T1 (850 ms) which may additionally contribute to the signal o f later heart-phase images [18]. A further reduction in scanning time or breath-hold duration m a y be obtained by utilizing faster gradient systems, by a reduction o f the image resolution or by the application o f hybrid imaging techniques [19]. Real- time applications, however, are not likely to be feasible utilizing C S P A M M myocardial tagging since the tech- nique inherently requires two acquisitions for subtraction.
End-systole
Late diastole
a),&:
,~mp o . t ; l t - o . ; ; . . ? , , }~'.7:' 1;' 11'720 9 . e . . . ~ a l e , .o , 9 1 1 f t . , i l l . . . . . . . i : : : : : : ' : : " : 5i:" !'L:: : 1 1 / 2 0 :d'i,,b," -, : ' ' " "" ' 2 0 f 2 0 , ; z ; " . ~ . , ; ~ , . " - ~ i e . ~;: 2 0 / 2 0 % = 9 0 ~ an=21 oFig. 7. Effect of RF-excitation optimization for slice-following CSPAMM myocardial tagging. Two heart-phase images (end systole and end-diastole) out of 20 are displayed for an c~,, of 90 ~ (upper panel) and an optimized :e,, of 21 ~ (lower panel).
M. Stuber et al./ Magnetic Resonance Materials in Physics, Biology and Medicine 9 (1999) 85 91 91 40 35 30 ~ es 0 ~ 2o 1- 10 5 0
~--O-Apex _-O : E quat=or .,.-g-- Base .-~_ Four .C_ _ .h~bei_. ~ t
35 109 183 257 331 405 479 553 627 701
A)
Time [ms I 40 35 30 ~ 2s 0 .~ 20 ~ 15 I-- 10 35 109 183 257 331 405 479 553 627 701 B ) Time [ms]Fig. 8. Tagging CNR assessed in six volunteers as a function of time in the cardiac cycle. (A) Tagging CNR for all the measured anatom- ical levels. (13) The average tagging contrast of apex, the mid-my- ocardium, the base and the four chamber view are displayed including _+ one standard deviation.
5. C o n c l u s i o n s T h e p r e s e n t i m p l e m e n t a t i o n o f s l i c e - f o l l o w i n g C S P A M M m y o c a r d i a l t a g g i n g a l l o w s f o r g r i d - t a g g e d i m a g e a c q u i s i t i o n o n m u l t i p l e a n a t o m i c a l levels o f t h e h e a r t d u r i n g a s h o r t p e r i o d o f s u s t a i n e d r e s p i r a t i o n . H e r e b y , s y s t o l i c a n d d i a s t o l i c p h a s e s o f t h e c a r d i a c cycle c a n b e a s s e s s e d r e l i a b l y w i t h a h i g h t e m p o r a l r e s o l u t i o n . T h i s is a n i m p o r t a n t c o n d i t i o n for t h e a n a l - ysis o f systolic a n d d i a s t o l i c f u n c t i o n in t h e n o r m a l a n d in t h e d i s e a s e d s t a t e [15]. By t h e r e d u c t i o n o f t h e s c a n n i n g t i m e f r o m s e v e r a l m i n u t e s t o 12 s p e r a n a t o m i c a l level, t h e a d v a n t a g e s o f s l i c e - f o l l o w i n g C S P A M M m y o c a r d i a l t a g g i n g are p r e - s e r v e d a n d t h e s u s c e p t i b i l i t y o f t h e m e t h o d t o a r t i f a c t s as a s s o c i a t e d w i t h i n c o n s i s t e n t d e p t h s o f s u b s e q u e n t b r e a t h - h o l d s is m i n i m i z e d . T h i s m a k e s t h e m e a s u r e - m e n t o f systolic a n d d i a s t o l i c m y o c a r d i a l wall m o t i o n a fast, simple, a n d r e p r o d u c i b l e e x a m w h i c h m a y l e a d t o a n e n h a n c e d c l i n i c a l a p p l i c a b i l i t y o f the m e t h o d . References
[l] Zerhouni EA, Parish DM, Rogers WJ, Yang A, Shapiro EP. Human heart: tagging with MR imaging - - a method for noninvasive assessment of myocardial motion. Radiology
1988;169:59-63.
[2] Axel L, Dougherty L. MR imaging of motion with spatial modulation of magnetization. Radiology 1989;171:841 5. [3] Buchalter MB, Weiss JL, Rogers WJ, et al. Noninvasive quan-
tification of left ventricular rotational deformation in normal humans using magnetic resonance imaging myocardial tagging. Circulation t 990;81 : 1236-44.
[4] McVeigh ER. MRI of myocardial function: motion tracking techniques. Magn Reson Imaging 1996;14:t37-50.
[5] Clark NR, Reichek N, Bergey P, et al. Circumferential myocar- dial shortening in the normal human left ventricle. Assessment by magnetic resonance imaging using spatial modulation of magnetization. Circulation 1991:84:67- 74.
[6] Wyman BT, Hunter WC, Prinzen FW, McVeigh ER. Mapping propagation of mechanical activation in the paced heart with MRI tagging. Am J Physiol 1999:276:H881 91.
[7] Rogers WJ Jr. Kramer CM, Geskin G, et al. Early contrast-en- hanced MRI predicts late functional recovery after reperfused myocardial infarction [see comments]. Circulation 1999;99:744- 50.
[8] Bogaert J, Maes A, Van de Werf F, et al. Functional recovery of subepicardial myocardial tissue in transmural myocardial infarc- tion after successful reperfusion: an important contribution to the improvement of regional and global left ventricular function. Circulation 1999;99:36-43.
[9] McVeigh ER. Atalar E. Cardiac tagging with breath-hold cine MRI. Magn Reson Med 1992;28:318-27.
[10] Hess OM, Lavelle JF. Sasayama S, Kemper WS, Ross J. Dias- tolic myocardial wall stiffness of the left ventricle in chronic pressure overload. Enr Heart J 1982:3:315-24.
[11] Hess OM, Villari B, Krayenbuehl HP. Diastolic dysfunction in aortic stenosis. Circulation 1993:87:IV73-6.
[12] Fischer SE. McKinnon GC. Maier SE, Boesiger P. Improved myocardial tagging contrast. Magn Reson Med 1993;30:191- 200.
[13] Rogers WJ Jr, Shapiro EP, Weiss JL, et al. Quantification of and correction for left ventricular systolic long- axis shortening by magnetic resonance tissue tagging and slice isolation. Circulation 1991 ;84:721 - 31.
[14] Fischer SE, McKinnon GC, Scheidegger MB, Prins W, Meier D, Boesiger P. True myocardial motion tracking. Magn Resort Med 1994:31:401 - 13.
[15] Stuber M, Scheidegger MB, Fischer SE, et al. Alterations in the local myocardial motion pattern in patients suffering from pres- sure overload due to aortic stenosis. Circulation 1999;100:361-8. [16] Danias PG, Stuber M, Botnar RM, Kissinger KV, Chuang ML,
Manning WJ. Breath-hold duration: use of magnetic resonance navigators to assess the impact of supplemental oxygen and hyperventilation. Am J Roentgenol 1998:171:395-7.
[17] Chuang ML, Chen MH, Khasgiwala VC, McConnell MV, Edet- man RR, Manning WJ. Adaptive correction of imaging plane position in segmented k-space cine cardiac MRI. J Magn Reson Imaging 1997;7:811-4.
[18] Fischer SE. In: Zurich E, editor. Assessment of human heart wall motion by magnetic resonance imaging. Diss.; vol. 10926. Zurich: ETH Zurich. 1994.
[19] Spiegel M, Scheidegger MB, Stuber M, Boesiger P. Ultrafast and real time myocardial motion assessment by tagging. Proc Int Soc Magn Reson Med 1998;1:279.