Messenger RNA Expression of
Transporter and Ion Channel Genes
in Undifferentiated and Differentiated
Caco-2 Cells Compared to
Human Intestines
Pascale Anderle,1,3,4,5Vera Rakhmanova,1 Katie Woodford,2Noa Zerangue,2and Wolfgang Sade´e1,3
Received September 17, 2002; accepted October 10, 2002
Purpose. The purpose of this work was to study the influence of cell differentiation on the mRNA expression of transporters and channels in Caco-2 cells and to assess Caco-2 cells as a model for carrier-mediated drug transport in the intestines.
Method. Gene mRNA expression was measured using a custom-designed microarray chip with 750 deoxyoligonucleotide probes (70mers). Each oligomer was printed four times on poly-lysine-coated glass slides. Expression profiles were expressed as ratio val-ues between fluorescence intensities of Cy3 and Cy5 dye-labeled cDNA derived from poly(A) + RNA samples of Caco-2 cells and total RNA of human intestines.
Results. Significant differences in the mRNA expression profile of transporters and channels were observed upon differentiation of Caco-2 cells from 5 days to 2 weeks in culture, including changes for MAT8, S-protein, and Nramp2. Comparing Caco-2 cells of different passage number revealed few changes in mRNAs except for GLUT3, which was down-regulated 2.4-fold within 13 passage numbers. Caco-2 cells had a similar expression profile when either cultured in flasks or on filters but differed more strongly from human small and large intestine, regardless of the differentiation state of Caco-2 cells. Expression of several genes highly transcribed in small or large in-testines differed fourfold or more in Caco-2 cells.
Conclusions. Although Caco-2 cells have proven a suitable model for studying carrier-mediated transport in human intestines, the ex-pression of specific transporter and ion channel genes may differ substantially.
KEY WORDS: transporters; ion channels; microarrays; Caco-2 cells; intestinal drug transport.
INTRODUCTION
Drug absorption appears to occur predominantly via pas-sive transcellular and paracellular transport mechanisms (1). However, recent studies indicate that carrier-mediated drug transport may play a more important role than previously thought. Sequencing of the human genome has suggested the presence of 406 genes encoding ion channels and 883
encod-ing transporters, of which 350 are intracellular transporters (2). Generally, these proteins establish the electrochemical gradient across membranes and provide the means for trans-porting amino acids, dipeptides, monosaccharides, monocar-boxylic acids, organic cations, phosphates, nucleosides, and water-soluble vitamins (3,4). Frequently, transporters play a direct role in drug absorption, in particular from the intes-tines. The hPept1 transporter for instance is responsible for the carrier-mediated uptake of various peptide-like drugs, such as cephalexin, Angiotonsin converting enzyme (ACE) (1) inhibitors, and 5⬘-amino acid esters of the antiviral nucleo-sides acyclovir and AZT (5,6). L-Val-acyclovir is a prodrug for which the bioavailability was remarkably increased by a drug carrier, i.e., hPepT1. Further examples include pravas-tatin and salicylic acid, which are transported by a monocar-boxylic acid transporter (7,8). However, transporters can also limit drug absorption through secretion into the intestinal lu-men. P-glycoprotein, a member of the ABC superfamily (ABCB1, MDR1) is a prominent efflux pump, which limits the uptake of substrates, such as digoxin and cyclosporin (9,10). Further members of the ABC family might also con-tribute to reduced drug bioavailability.
Human adenocarcinoma cells, Caco-2, derived from a colon carcinoma, serve as a common in vitro model for esti-mating the fraction of compound absorbed via the intestinal tracts (11). The majority of drugs were thought to be passively transported. The fraction of a dose absorbed in vivo corre-lates significantly with the permeability of passively trans-ported compounds across the Caco-2 cells (12). If, however, the compound is absorbed by a carrier-mediated mechanism, correlations are often spurious. This could be related to dif-ferences in the expression of genes between Caco-2 cells and intestines that are involved in drug uptake, such as transport-ers and ion channels. Moreover, Caco-2 cells express different phenotypes, i.e., resembling colon crypt cells, small intestinal absorptive enterocytes, and follicle-associated epithelium en-terocytes (13); therefore, differentiation status and passage number could strongly affect expression of transporters and ion channels.
For a majority of drugs, it remains unknown which trans-porters play a role in their absorption and targeting in the body. The human genome project has made it possible to identify most if not all genes encoding transporters and ion channels. This provokes the challenge to determine which transporters interact with any given drug at a genomic scale. A first step in identifying genes relevant to drug absorption in the intestines is to obtain a catalog of all expressed mRNAs. In this study, we used a custom-designed oligonucleotide ar-ray to determine the mRNA expression profiles of transport-ers and ion channels in Caco-2 cells at different passage num-ber and differentiation state, in comparison with mRNA pro-files in human intestines. Also, we compared mRNA propro-files from small intestine and colon to assess the feasibility of tar-geting carrier-mediated drugs via different segments in the intestine. The results will be useful in understanding intestinal drug absorption at the molecular level.
MATERIALS AND METHODS Materials
FastTrack Kit 2.0 and tRNA were obtained from Invi-trogen (Carlsbad, CA, USA). Media for cell culture were
1Department of Biopharmaceutical Sciences, School of Pharmacy,
University of San Francisco, San Francisco, California.
2Xenoport Inc, Palo Alto, California.
3Department of Pharmacology, College of Medicine and Public
Health, Ohio State University, Columbus Ohio.
4Current address: ISREC, Epalinges s/Lausanne, Switzerland. 5To whom correspondence should be addressed. Chemin des
Boveresses 155, 1066 Epalinges s/Lausanne, Switzerland. (e-mail: [email protected])
from Cell Culture Facility at UCSF (San Francisco, CA, USA). Material for coating of slides, succinic anhydride and poly(A) + RNA was purchased from Sigma (St. Louis, MO, USA), Gold Seal Microslides from Fisher Scientific (Tustin, CA, USA), and Fluorolink Cy5 Monofunctional Dye 5 and Fluorolink Cy3 Monofunctional Dye 3 from Amersham (Pis-cataway, NJ, USA). Total RNA from colon (Lot# 1050229, pool from two healthy male Caucasians, age 35 and 50 years) and small intestine (Lot# 1070366, pool from five healthy male and female Caucasians, age between 20 and 65 years) was obtained from Clontech (Palo Alto, CA, USA). Extrtion of total RNA was performed by phenol extracExtrtion ac-cording to a company internal protocol. Oligomers were or-dered from MWG (High Point, NC, USA).
Cell Culture
Caco-2 cells passages 81 to 98 were cultured in Dulbec-co’s modified Eagle’s medium with 4.5 g/L of D-glucose),
which was supplemented with 20% fetal bovine serum, non-essential amino acids (1% v/v), and 100 units/mL penicillin and 100 g/mL streptomycin. Confluent monolayers were subcultured every 7 days by treatment with 0.5% trypsin and 0.2% EDTA and seeding at a density of 5 × 10⁵cells/80 cm2
into plastic flasks. Cultures were incubated at 37°C in a hu-midified atmosphere of 5%/95% CO2/O2. For mRNA expres-sion measurements in flasks, cells were seeded at a density of 1.5 × 10⁶cells/175 cm2, for mRNA expression studies in
fil-ters, at a density of 3.75 × 10⁵cells/44 cm2on polycarbonate
inserts (Costar Transwell, mean pore diameter of 0.4m). The transepithelial electrical resistance (TEER) was mea-sured with a Millicell-ERS (Millipore, Corp., Bedford, MA, USA).
Selection of Genes
Hidden Markov Models (HMMs) of transporter and ion channel genes were selected by searching the Pfam Database 6.1 (http://pfam.wustl.edu/) with keywords and seed se-quences chosen from known transporter and channel families (http://www-biology.ucsd.edu/∼msaier/transport/toc.html). HMMs were run against the Genpept database using hmmsearch/hmmer-2.1.1-intel-linux (http://hmmer.wustl. edu/). Only hits with a probability of 0.0001 or lower were selected. Using the multiple alignment program ClustalW, re-dundant accession numbers were filtered out. In addition, new putative transporter and channel gene sequences were collected. An automated search method was applied that uses converged PSI-Blast against the human expressed sequence tags (EST) (1) database for identification of new gene candi-dates (14). Resulting contig sequences representing two or more overlapping ESTs were used for the array. Because this work was performed before the release of the human se-quence, contigs identified in our search were then run against the human genome database, and annotated genes matching the contigs were identified. Several contigs did not match any annotated genes and, therefore, might represent yet unchar-acterized genes. Identity of these putative genes will be stud-ied separately. Housekeeping genes and negative controls were the same as in the Atlas 1.2 Human Array by Clontech.
Design of Oligomers
Coding region sequences only were used for the design of the oligomers. To select the 70mers, an algorithm was applied
that takes the following four criteria into account: uniqueness, internal palindrome structure (reverse Smith-Waterman algo-rithm is used to detect palindrome sequence), melting tem-perature, and localization of the 70mer probe within the gene sequence (15). For the design of the 70mers, a melting tem-perature of 70°C, an internal palindrome structure value of 100, and a uniqueness cutoff of 15 bp were chosen. All oligo-mers were designed to be located as close toward the 3⬘ end as possible. A list of all genes on the chip, including sequences of the 70mers, will be published on AAPS PharmSci, (URL to be provided.)
Preparation of Microarray Chips
Glass slides were coated according to DeRisi et al. (16). Oligomers were printed at a concentration of 33M in 3 × SSC. The entire set of 750 oligos was printed four times on each glass slide. After printing, slides were treated with suc-cinic anhydride before hybridization to block poly-L-lysine
(16).
Preparation of Poly(A) + RNA, Labeling, Hybridization, and Scanning
Poly(A) + RNA was extracted from cells using the Fast-Track 2.0 Kit by Invitrogen. Samples of 2g poly(A) + RNA or 20 g total RNA, respectively, were labeled with either Cy3 Dye or Cy5 Dye by amino-allyl coupling (http:// derisilab.ucsf.edu/pdfs/amino-allyl-protocol.pdf,), resus-pended in 20L of HEPES buffer (25 mM, pH 7.0) contain-ing 1L of tRNA, 1.5 L of yeast poly(A)+RNA, 0.45L of
10% SDS, and hybridized to the slides for 16 h at 65°C. For all hybridization reactions comparing Caco-2 cells poly(A) + RNA was used, whereas for hybridization reactions with hu-man tissue samples total RNA was used. Cells grown in flasks had passage numbers between 81 and 82. For studies in filters, two sets of experiments were done. In the first set, cells had passage numbers between 82 and 98 and in the second set between 82 and 85. Slides were washed and dried before scan-ning according to DeRisi et al. (16). Slides were scanned on a GenePix 4000A (Foster City, CA, USA) to detect Cy3 and Cy5 fluorescence.
Quantitative Real-Time Polymerase Chain Reaction (RT-PCR)
Single-stranded DNA was prepared from Caco-2 total RNA using oligo-dT priming (Thermoscript RT Kit, Invitro-gen, Carlsbad, CA, USA), and the same batch of ssDNA was used in all subsequent mRNA-profiling reactions. RT-PCR was performed using the MJ Research Opticon and SYBR-green detection (Applied Biosystems, Foster City, CA, USA). The threshold cycle for PCR products was defined as the cycle at which the SYBR green fluorescent signal was 20 stan-dard deviations above background fluorescence. The thresh-old cycle for beta-actin and GAPDH mRNA was used to normalize ssDNA for comparison between samples. Calibra-tions were performed using known concentraCalibra-tions of plasmid cDNA or amplified PCR product. PCR products were checked for appropriate size by gel electrophoresis and were sequenced to verify specificity. For routine studies, melt peak analysis was performed at the end of quantitative PCR ex-periment to evaluate amplification of the correct product. In
all, ∼60 mRNAs encoding transporters were analyzed by RT-PCR. A full report on these data will be provided sepa-rately. Sequences of the PCR primers are available upon request.
Analysis of Data
Background subtraction and calculation of average of medians was conducted using GenePix Software 3.0 (Foster City, CA, USA). Cut-off values for selecting differentially expressed genes were based on control studies, i.e., hybrid-ization of identical, but differently labeled poly(A+) RNA. For hybridization studies with combined RNA sources, i.e., total RNA and ploly (A) + RNA, more stringent cut-off val-ues were applied. K-means clustering was done using Spotfire software (Somerville, MA, USA).
RESULTS
Selection of Transporter and Ion Channel Genes
Seventy-nine HMMs were run against the GenePept DB representing various gene families encoding transporters, ion exchangers, and ion channels. The resulting gene sequences were compared with an existing transporter and ion channel database (http://www.aapspharmsci.org/scientificjournals/ pharmsci/journal/20.html). A total 670 transporter genes and 261 channel genes (including splice variants) were collected. The search for putative new genes by using a converged PSI-Blast against the human EST database (14) resulted in 236 contigs that differed from known genes. For some gene se-quences, 70mer probes could not be designed under the speci-fied conditions. These were either sequences containing single nucleotide polymorphisms or splice variants of known genes. In these cases, a probe sequence was chosen that rep-resented all splice variants. In the case of single nucleotide polymorphisms an oligomer was designed that did not contain the SNP site. After eliminating duplicated sequences, 316 oligomers were designed for transporter genes, 151 for chan-nel genes, 156 for contigs representing putative transporter genes not in the nr database at the time (∼January 2001), and 12 for controls. In addition to the above-mentioned genes, the array contained 100 genes representing RGS, ADAM, and EGF-like gene families. These are not further considered in the present study.
Passage Number and Differentiation in Caco-2 Cells
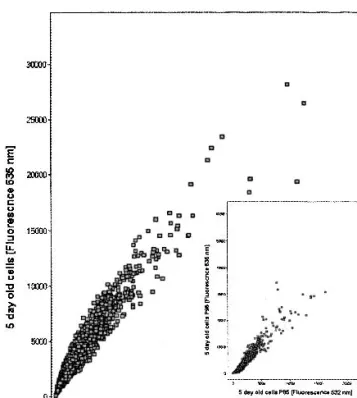
Caco-2 cells were grown over a period of 3 weeks. Under the conditions used, the cells were confluent after 1 week when grown in flasks. When cultured on filters, the TEERs increased between 5 days and 2 weeks and remained stable between 2 weeks and 3 weeks, indicating that cells were dif-ferentiated after 2 weeks. For all studies in flasks, Caco-2 cells with passage numbers between 81 and 83 were used, whereas for studies on filters, cells with passage numbers ranging from 82 to 98 were used. To test the error associated with measur-ing relative mRNA levels between two samples, we compared two identical poly(A) + samples obtained from Caco-2 cells cultured for 5 days, labeled with Cy3 or with Cy5. The mean intensity values for Cy3 and Cy5 fluorescence, from four ob-servations for each probe (spotted four times on a single slide), were plotted as shown in Fig. 1. The scatter along the diagonal is acceptable, and there are no outliers. Deviations
from the line of unity were 1.5-fold maximally. Using three replicate slides, or a total of 12 observations, a change of 1.3-to 1.5-fold in mRNA expression level over the control can be reliably measured, depending upon the probe and fluores-cence intensity of the signal. Thus, we used as a cut-off 0.45 for the log2ratio values, unless noted otherwise.
To assess the influence of passage number on the mRNA expression profile, we compared cells that were grown on filters with passage numbers 85 and 98 (cf. Fig. 1, insert). Table I shows all genes that were significantly up- or down-regulated. GLUT3 was the only gene that showed a 2-fold change in mRNA expression between the different passage numbers. A few genes displayed a change in mRNA expres-sion of 1.5-fold or higher, indicating that the cellular pheno-type does change detectably with passage number.
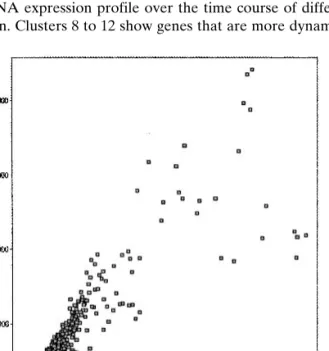
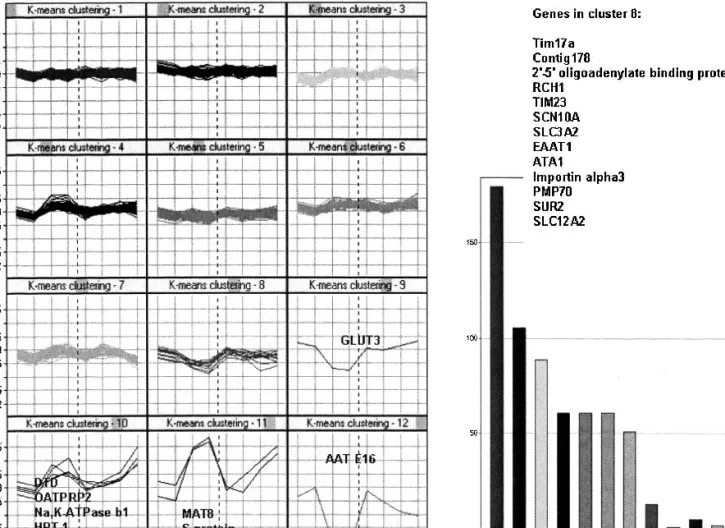
The next series of experiments addressed the question how the mRNA expression profile changes with differentia-tion of Caco-2 cells. Poly(A) + RNAs of cells cultured for 5 days, 1 week, 2 weeks, and 3 weeks were fluorescently labeled and their mRNA expression profiles analyzed. Over a period of 3 weeks, the mRNA expression profile changed markedly. Figures 1–4 show the fluorescence intensity of Cy3 labeled mRNA of 5-day-old cells (Cy3) vs. the fluorescence of Cy5-labeled mRNA of 1-, 2-, and 3-week-old cells. Changes occur mainly between 5 days and 1 week and between 1 week and 2 weeks (cf. Fig. 5). Tables II and III show all genes that are significantly up- or down-regulated over a period of 3 weeks. Only a few genes had a 2-fold or higher change in mRNA expression levels measured by the ratio value. There were no major differences observed between cells grown on filters or in plastic flasks. All genes that had a 2-fold or higher change in mRNA expression ratio in cells grown on flasks were simi-larly regulated in cells grown on filters. Figure 6 shows the
Fig. 1. Comparison of flourescence intensities of identical mRNA samples from 5-day Caco-2 cells passage 82 grown in flasks, labeled with Cy3 or Cy5, respectively. Scatter represents the analytical error. Insert shows comparison of 5-day Caco-2 cells passage 85 vs. 95.
K-means clustering of relative mRNA expression levels in flask and filters. This groups genes together that have a simi-lar mRNA expression profile over the time course of differ-entiation. Clusters 8 to 12 show genes that are more
dynami-cally regulated over time than genes represented in clusters 1 to 7. Clusters 8 and 12 contain genes that show a trend to down regulation upon differentiation, whereas clusters 10 and 11 contain genes with a trend to up regulation. In summary, transporter genes that that are up-regulated upon differentia-tion include GLUT5, amino acid and ion transporters, such as
Nramp2, MAT8, and Na+
,K+
-ATPase, whereas amino acid
transporter E16 and the glucose transporter GLUT3 were
Fig. 2. Comparison of flourescence intensities of mRNA samples from 5-day and 1-week Caco-2 cell cultures (all passage P82) grown in flasks, labeled with Cy3 or Cy5, respectively.
Fig. 3. Comparison of flourescence intensities of mRNA samples from 5-day (P82) and 2-week Caco-2 cell cultures (P81) grown in flasks, labeled with Cy3 or Cy5, respectively.
Fig. 4. Comparison of flourescence intensities of mRNA samples from 5-day (P82) and 3-week (P82) Caco-2 cell cultures grown in flasks, labeled with Cy3 or Cy5, respectively.
Table I. Genes Showing Significant Changes in mRNA Expression with Increasing Passage Numbers in Caco-2 Cells
Name ID
Log ratio values SD
ABCG5 gi|11692799 −0.60 0.48
ACCN3 gi|9998947 0.66 0.22
Bak-3 pseudogene gi|595923 0.75 0.10 Ca-act. Cl channel protein gi|5726286 −0.87 0.87 Connexin 59 CX59 gi|9957541 −0.68 0.74 Contig101⳱ protein
similar to AQP7
gi|9367917 −0.89 0.82 Contig103⳱ AQP7 gi|4502186 −0.61 0.50 Contig14⳱ ABCA5 gi|20559208 −0.64 0.52 Contig17⳱ HepG2/SLC2A1 gi|183302 0.62 0.47 Contig171⳱ cofactor required for Sp1 gi|13937750 −0.63 0.54 Contig223⳱ FLJ23784 gi|18676946 −0.84 0.60 Contig81⳱ SLC7A8, CAT, y+ system gi|14751202 0.61 0.33 Electrogenic Na+ bicarbonate cotrans. gi|4877551 −0.63 0.63 GLUT3 gi|183684 1.26 0.19 LTRPC7 gi|13959784 −0.60 0.37
SLC12A3: Na/Cl transporters gi|4506976 0.71 0.36 SLC21A14: organic anion
transp. polypeptide 14
gi|7839586 −0.81 0.66 SLC30A3, zinc transporter gi|4508042 0.70 0.21
Stromelysin gi|36632 0.74 0.43
TIRC7 gi|3603174 0.63 0.37
Note: Relative mRNA expression levels are log2ratio values of Cy5
intensities in P95 cells over Cy3 intensities in P85 cells. Cut-off for log2ratio values was 0.6 (n⳱ 2 × 4).
significantly down-regulated. In addition, genes of the ABC superfamily were regulated upon differentiation. The array contains probes for 40 of the currently known 48 ABC trans-porter genes—an indication of the overall coverage of the probe array for a well-defined transporter family (14). No influence of the state of differentiation was observed for the dipeptide transporter hPept1 and the monocarboxylic acid transporters—that is, ratio values were smaller than∼1.2, i.e, log2 ratio values were all lower or equal to∼0.26). This result is surprising because hPepT1 is thought to be prominently up-regulated in differentiated Caco-2 cells (17). Other factors, including protein expression at the cell surface rather than at intracellular membranes, may play a role in the enhanced drug/dipeptide transport in differentiated Caco-2 cells.
Quantitative RT-PCR
To validate the results obtained with array, we also mea-sured mRNA expression by RT-PCR, an accepted quantita-tive method. With quantitaquantita-tive RT-PCR, an up-regulation of hPept1 was observed in Caco-2 cells upon differentiation over 2 weeks. In general, RT-PCR was more sensitive in detecting changes of gene expression during differentiation than the microarray. All genes with a 5-fold or higher increase over 2 weeks (ABCC2, ABCG1, OCTN1, RBAT, ABCA1,
ABCA5, ABCC3, GLUT5, SLC5A3, NPT-4, DRA) using
RT-PCR were also found to be up-regulated in both flasks and filters (except NADC1) using the microarray, but with an average log2 value of only 0.22 in filters and 0.36 in flasks. However, genes with a log2value of 0.45 or higher in micro-arrays (ABCC1, ABCA5, ABCC3, GLUT5, SLC5A3,
OATPRP2) were always confirmed with RT-PCR (Table IV)
Moreover, we compared the mRNA expression of 22 genes (OAT1, MCT1, MCT3, CAT2, and 18 ABC transporters) that did not change significantly during 2-week differentiation measured by RT-PCR (2-fold or lower with RT-PCR), to results obtained with microarray data. Consistent with the
RT-PCR data, the average log2value was 0.04 using micro-arrays, indicating no significant change. With RT-PCR, abso-lute levels of the mRNAs can be estimated, whereas the array only detects changes in mRNA expression (because signal intensity is subject to many variables).
Comparison between Caco-2 Cells and Intestinal Tissue
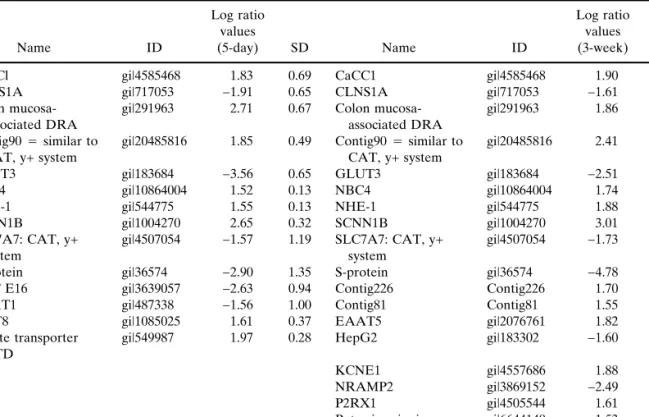
The mRNA expression of transporter and ion channel genes in undifferentiated 5-day-old and differentiated 3-week-old Caco-2 cells were compared with mRNA from human intestinal tissue. Differences between Caco-2 cells and tissue were more pronounced than between undifferentiated and differentiated Caco-2 cells. The mRNA expression of numerous genes differed by 2-fold or more. Genes that are known to be specifically expressed in defined segments in the intestine were found to be more highly expressed relative to Caco-2 (cf. Tables V and VI), such as SCNN1B (18) and colon mucosa-associated DRA (19) in the colon, and SGLT1 (20) and CaCC1 (21) in the small intestine. Confirmation of high mRNA levels for these intestinal tissue-selective genes vali-dates further the results obtained with the custom-design ar-ray. As expected, GLUT3 mRNA was at low abundance in colon and small intestine (22). The mRNA expression of sev-eral genes that were significantly regulated in Caco-2 cells upon differentiation was similar between human intestines and differentiated Caco-2 cells. For example, MAT8, was strongly up-regulated upon differentiation, reaching a similar level of mRNA expression as found in colon tissue. In con-trast, MAT8 was expressed to similar levels in undifferenti-ated Caco-2 cells and small intestine. Other examples that showed a similar pattern are S-protein, sulfate transporter
DTD, and Na,K-ATPase b1 gene. No members of the ABC
transporters, the dipeptide transporters, and monocarboxylic acid transporters had a log ratio value of one or higher.
How-Fig. 5. Plot of relative mRNA expression levels between 2-weeks and 1-week Caco-2 cell cultures and between week and 3-week cell cultures. Points along the diagonal indicate little change in expression ratio between 2-and 3-week cultures.
Table IIA. Genes That Are Regulated in Caco-2 Cells Grown in Flasks over a Period of 3 We eks Name (K-means cluster) a ID Log ratio values (1 week) SD Name (K-means cluster) a ID Log ratio values (2 weeks) SD Name (K-means cluster) a ID Log ratio values (3 weeks) SD AAT E16 (12) gi|3639057 − 0.46 0.50 AAT E16 (12) gi|3639057 − 2.08 0.82 AAT E16 (12) gi|3639057 − 0.90 0.32 ATA1 (8) gi|11640742 − 0.70 0.59 ATA1 (8) gi|11640742 − 0.91 0.64 ABC-1 (5) gi|4128032 0.61 0.61 ABC-1 (5) gi|4128032 0.61 0.48 ABCC3 (6) gi|9955969 0.54 0.58 ABCC3 (6) gi|9955969 0.47 0.56 Contig8 ⳱ ABCA5 (4) gi|20559208 0.46 0.41 Contig8 ⳱ ABCA5 (4) gi|20559208 0.52 0.22 GLUT3 (9) gi|183684 − 0.72 0.24 GLUT3 (9) gi|183684 − 0.76 0.52 Importin alpha 3 (8) gi|1928974 − 0.58 0.50 Importin alpha 3 (8) gi|1928974 − 0.73 0.62 MAT8 (11) gi|1085025 − 0.49 0.47 MAT8 (11) gi|1085025 1.42 0.51 MAT8 (11) gi|1085025 1.85 0.42 Na,K-ATPase b1 (10) gi|806753 0.86 0.23 Na,K-ATPase b1 (10) gi|806753 0.6 7 0.80 NRAMP2 (10) gi|3869152 0.68 0.32 NRAMP2 (10) gi|3869152 1.10 0.40 PMP70 (9) gi|35552 − 0.70 0.54 PMP70 (8) gi|35552 − 0.91 0.60 RCH1 (8) gi|791184 − 0.56 0.36 RCH1 (8) gi|791184 − 0.60 0.43 S-protein (11) gi|36574 1.38 0.34 S-protein (11) gi|36574 1.69 0.41 SUR2 (8) gi|3127138 − 0.48 0.43 SUR2 (8) gi|3127138 − 0.50 0.52 SUR2 (8) gi|3127138 − 0.55 0.68 Tim17a (8) gi|4378528 − 0.56 0.61 Tim17a (8) gi|4378528 − 0.65 0.94 TIM23 (8) gi|2599128 − 0.67 0.54 TIM23 (8) gi|2599128 − 0.84 0.66 Note: Relative expression levels are log 2 ratio values of Cy5 intensities in 1-, 2-, and 3-week-old cells over Cy3 int ensities in 5-day-old cells. Cut-off for log 2 ratio values was 0.45 (n ⳱ 4 × 3). aK-means cluster number according to Fig. 6.
Table IIB. Genes That Are Regulated in Caco-2 Cells Grown in Flasks over a Period of 3 Weeks Name (K-means cluster) a ID Log ratio values (1 week) SD Name (K-means cluster) a ID Log ratio values (2 weeks) SD Name (K-means cluster) a ID Log ratio values (3 weeks) SD Bcl-xL/bcl-2 ass. death promoter B (5) gi|2660728 − 0.47 0.52 BCL2/adenovirus E1B (1) gi|558845 0.60 0.44 EAAT1 (8) gi|487338 − 0.67 1.37 CAT, y+ system (1) gi|7657682 − 0.60 0.59 Contig223 ⳱ FLJ23784 (7) gi|18676946 − 0.47 0.73 FCGRT (6) gi|4758345 0.45 0.35 Contig222 ⳱ ATP9B (3) gi|20554286 − 0.48 0.39 SLC5A3: Na+/myo-inositol cotrans. (6) gi|662842 0.46 0.16 HK1 (5) gi|184100 − 0.45 0.46 Contig72 ⳱ clone hCIT.281_F_24 (3) gi|3176728 − 0.56 0.45 Sulfate transporter DTD (10) gi|549987 0.49 0.30 HPT-1 (10) gi|483391 0.55 0.24 Contig9 ⳱ ABCA6 (7) gi|20559210 − 0.46 0.58 OATPRP2 (10) gi|11990588 0.58 0.33 Creatine transporter (3) gi|493131 − 0.46 0.52 SCN10A (8) gi|4838144 − 0.52 0.27 hASCT1 (3) gi|765233 − 0.45 0.58 SLC17A4: sodium phosphate (4) gi|4885440 0.63 0.63 Stimulator of Fe transport (7) gi|2738924 − 0.47 0.58 SLC3A2: act. of dibasic and neutral AAT (8) gi|4505140 − 0.51 0.31 SLC21A14: organic anion transp. polypeptide 14 (7) gi|7839586 − 0.52 0.53 SRP1 homolog (5) gi|913392 − 0.52 0.69 SLC21A3: organic anion transporter (4) gi|4827013 − 0.49 0.41 Note: Relative expression levels are log 2 ratio values of Cy5 intensities in 1-, 2-, and 3-week-old cells over Cy3 intensities in 5-day-old cells. Cut-off for log 2 ratio values was 0.45 (n ⳱ 4 × 3). Genes listed here reached the cut-off value at only one time point. aK-means cluster number according to Fig. 6.
Table IIIA. Genes That Are Regulated in Caco-2 Cells Grown in Filters over a Period of 3 W eeks Name (K-means cluster) a ID Log ratio values (1 week) SD Name (K-means cluster) a ID Log ratio values (2 weeks) SD Name (K-means cluster) a ID Log-ratio values (3 weeks) SD AAT E16 (12) gi|3639057 − 0.54 0.23 AAT E16 (12) gi|3639057 − 0.81 0.71 AAT E16 (12) gi|3639057 − 1.46 0.33 ATA1 (8) gi|11640742 − 0.48 0.57 ATA1 (8) gi|11640742 − 0.58 0.45 MAT8 (11) gi|1085025 0.62 0.73 MAT8 (11) gi|1085025 0.92 0.65 MAT8 (11) gi|1085025 2.29 0.52 NRAMP2 (10) gi|3869152 0.77 0.23 NRAMP2 (10) gi|3869152 2.24 0.19 S-Protein (8) gi|36574 0.52 1.46 S-Protein (8) gi|36574 1.92 0.40 SLC21A14: organic anion transp. polypeptide 14 (7) gi|7839586 − 0.53 1.07 SLC21A14: organic anion transp. polypeptide 14 (7) gi|7839586 − 0.50 0.43 Note: Relative expression levels are log 2 ratio values of Cy5 intensities in 1-, 2-, and 3-week-old cells over Cy3 int ensities in 5-day-old cells. Cut-off for log 2 ratio values was 0.45 (n ⳱ 4 × 3). aK-means cluster number according to Fig. 6. Table IIIB. Genes That Are Regulated in Caco-2 Cells Grown in Filters over a Period of 3 W eeks Name (K-means cluster) a ID Log ratio values (2 weeks) SD Name (K-means cluster) a ID Log ratio values (3 weeks) SD BCL2/adenovirus E1B 19kD-interacting protein 1) gi|558845 0.53 0.35 Contig101 ⳱ novel gene similar to AQP7 (7) gi|9367917 − 0.57 0.48 Contig223 ⳱ FLJ23784 (7) gi|18676946 − 0.55 0.55 Contig103 ⳱ AQP7 (7) gi|4502186 − 0.60 0.56 SLC12A2: Na/K/Cl transporters (8) gi|4506974 − 0.55 0.71 EAAT1 (8) gi|487338 − 0.69 0.65 FCGRT (6) gi|4758345 0.74 0.54 GLUT3 (9) gi|183684 0.64 0.46 GLUT5 (6) gi|183297 1.10 0.32 HepG2 (2) gi|183302 0.76 0.36 HPT-1 (10) gi|483391 1.19 0.14 Importin alpha 3 (8) gi|1928974 − 0.45 0.28 Na,K-ATPase b-1 (10) gi|806753 1.82 0.22 OATPRP2 (10) gi|11990588 1.23 0.21 PMP70 (8) gi|35552 − 0.72 0.27 RCH1 (8) gi|791184 − 0.69 0.15 Sulfate transporter DTD (10) gi|549987 1.64 0.41 SUR2 (8) gi|3127138 − 0.51 0.32 Tim17a (8) gi|4378528 − 0.54 0.27 Note: Relative expression levels are log 2 ratio values of Cy5 intensities in 1-, 2-, and 3-week-old cells over Cy3 intensities in 5-day-old cells. Cut-off for log 2 ratio values was 0.45 (n ⳱ 4 × 3). Genes listed here reached the cut-off value at only one time point. aK-means cluster number according to Fig. 6.
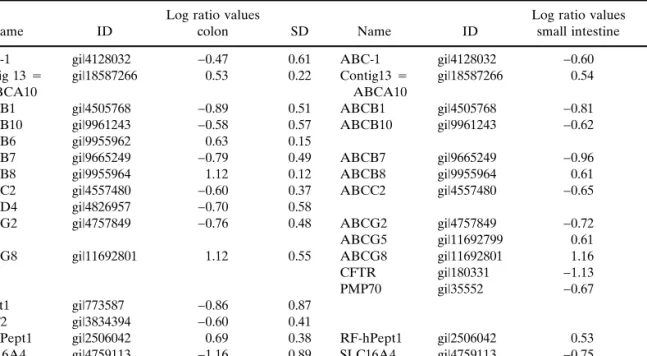
ever, this cut off value is rather stringent as we can detect smaller changes using four replicate samples per array and three separate experiments. Table VII lists all members of these families that were differently regulated in 3-week-old Caco-2 cells compared with intestinal tissue assuming that a cut-off value of 0.45 is significant. This includes hPepT1, which is selectively expressed in small intestines.
Comparison between Colon and Small Intestine
Genes that were found earlier (Tables V and VI) to be specific for either the colon or the small intestine in compari-son to differentiated Caco-2 cells were confirmed by direct comparison of mRNAs from small intestine with colon (cf. Table VIII). For instance CaCC2, contig90, a gene similar to
CAT, y + system (gi|20485816), and MAT8 were found to be
more highly expressed in colon, and GLUT5 and SGLT1 in small intestine. By lowering the cut-off value from 0.6 to 0.45, only three additional members of the ABC transporter, and the dipeptide transporter hPepT1 were found to be differ-ently expressed in small intestines and colon: ABCG8 (−0.60 ± 0.45), ABCB8 (0.41 ± 0.33), and hPept1 (−0.56 ± 0.24).
DISCUSSION
The importance of carrier-mediated transport on drug bioavailability remains to be assessed for many drugs. The large number of transporter genes in the human genome sug-gests that transport mechanisms may play a pervasive role in drug absorption and tissue targeting. Moreover, ATPases and ion channels determine the electrochemical gradient across the plasma membrane and generate the driving force for
pri-Fig. 6. K-means clustering of relative mRNA expression [log2(Cy5/Cy3)] levels after 5-day, 1-, 2-, and 3-week cultures in flasks (5*, 1*, 2*,
3*) and on filters (5, 1, 2, 3). Similarity measure: Euclidean distance. Cluster initialization: Data centroid based search. Bar chart shows the number of genes per each cluster.
Table IV. Comparison of RT-PCR and Microarray
Name ID
Microarray: log ratio value SD
RT-PCR: log ratio values OATPRP2a gi|11990588 1.23 0.21 2.40 GLUT5a gi|183297 1.10 0.32 6.91 ABC-1 gi|4128032 0.61 0.48 5.01 OATPRP2 gi|11990588 0.58 0.33 2.40 ABCA5 gi|20559208 0.52 0.22 2.17 ABCC3 gi|9955969 0.47 0.56 8.29 SLC5A3b gi|662842 0.46 0.16 3.53 Note: Listed are genes with a log2ratio value of 0.45 or higher using
microarray. Relative mRNA expression levels are log2ratio values of
Cy5/Cy3 intensities for 3-week vs. 5-day-cell cultures. aOn filters.
mary and secondary active transport. The present study pro-vides a survey of those genes that are expressed in Caco-2 cells and in human intestines, as a first step in understanding the overall transport capacity of human intestinal tissue rel-evant to drug bioavailability, and the utility of Caco-2 cell culture as a model of intestinal drug absorption. Microarray technology allows one to measure mRNA expression levels of a large number of genes. We used two methods for identifying gene targets for our chip: 1) screening the NCBI database for ESTs that are putative members of transporter/channel fami-lies (14) and 2) screening the Genepept database with HMMs that represent transporter and channel genes. This strategy
allowed us to design a chip that contained genes with known function, putative transporter/channel genes with known open reading frame, and new putative genes not represented in NCBI as open reading frames at the time. Upon comple-tion of the study, we have checked all contigs—assembled from overlapping ESTs—against the nr database of NCBI, and have identified those genes that have since been anno-tated. The newly listed genes represented by contigs are in-dicated in the tables. For example, among the 48 known ABC transporter genes, we had probes for 32 genes listed at the time and for eight contigs representing genes listed subse-quently. The coverage of our probes may vary from one gene
Table V. Comparison of Genes That Are Differently Regulated in Caco-2 Cells and Colon Tissue
Name ID Log ratio values (5-day) SD Name ID Log ratio values (3-week) SD
CaCCl gi|4585468 1.83 0.69 CaCC1 gi|4585468 1.90 0.63
CLNS1A gi|717053 −1.91 0.65 CLNS1A gi|717053 −1.61 0.66
Colon mucosa-associated DRA
gi|291963 2.71 0.67 Colon mucosa-associated DRA
gi|291963 1.86 0.44 Contig90⳱ similar to
CAT, y+ system
gi|20485816 1.85 0.49 Contig90⳱ similar to CAT, y+ system
gi|20485816 2.41 0.39
GLUT3 gi|183684 −3.56 0.65 GLUT3 gi|183684 −2.51 1.25
NBC4 gi|10864004 1.52 0.13 NBC4 gi|10864004 1.74 0.39
NHE-1 gi|544775 1.55 0.13 NHE-1 gi|544775 1.88 0.21
SCNN1B gi|1004270 2.65 0.32 SCNN1B gi|1004270 3.01 0.35
SLC7A7: CAT, y+ system
gi|4507054 −1.57 1.19 SLC7A7: CAT, y+ system
gi|4507054 −1.73 1.40
S-protein gi|36574 −2.90 1.35 S-protein gi|36574 −4.78 1.55
AAT E16 gi|3639057 −2.63 0.94 Contig226 Contig226 1.70 0.28
EAAT1 gi|487338 −1.56 1.00 Contig81 Contig81 1.55 0.21
MAT8 gi|1085025 1.61 0.37 EAAT5 gi|2076761 1.82 0.35
Sulfate transporter DTD
gi|549987 1.97 0.28 HepG2 gi|183302 −1.60 1.19
KCNE1 gi|4557686 1.88 0.35 NRAMP2 gi|3869152 −2.49 0.71 P2RX1 gi|4505544 1.61 0.34 Potassium ionic channel Kv4.3 gi|6644149 1.53 0.14
Note: Relative mRNA expression levels are log2ratio values of Cy5 intensities in colon tissue over Cy3 intensities in 5-day-old
or 3-week-old cells. Cut-off for log2ratio values was 1 (n⳱ 4 × 3).
Table VI. Comparison of Genes That Are Differently Regulated in Caco-2 Cells and Small Intestinal Tissue
Name ID Log ratio values (5-day) SD Name ID Log ratio values (3-week) SD
CaCCl gi|4585468 2.59 0.98 CaCC1 gi|4585468 1.91 0.89
GLUT3 gi|183684 −3.75 0.74 GLUT3 gi|183684 −2.84 1.05
S-protein gi|36574 −3.70 1.07 S-protein gi|36574 −4.13 1.48
AAT E16 gi|3639057 −2.13 0.43 CLNS1A gi|717053 −1.95 0.87
ATA1 gi|11640742 −1.58 0.54 MAT8 gi|1085025 −2.85 0.74
C1 channel regulatory protein
gi|717053 −2.13 0.45 Na,K-ATPase b1
gi|806753 −1.86 0.58
EAAT1 gi|487338 −1.82 0.98 NRAMP2 gi|3869152 −2.40 0.63
HepG2 gi|183302 −1.63 1.08
Karyopherin alpha 3 gi|2190277 −1.96 0.42
RCH1 gi|791184 −1.84 0.51
SGLT1 gi|338054 1.99 0.77
Note: Relative expression levels are log2 ratio values of Cy5 intensities in small intestinal tissue over Cy3 intensities in
family to another, but in the case of the ABC transporters, it is 40 of 48 known genes. However, additional genes may exist that have not yet been annotated; in our search of the human EST database (14) we have identified numerous EST single-tons that could not be assembled into contigs. These could
represent unknown transporter genes, but EST singletons were not included with the microarray.
Many of the genes that are responsible for active trans-port in the intestine are known to be expressed in Caco-2 cells. Consequently, we investigated the mRNA expression of
Table VII. Comparison of Genes of the ABC Transporter, the Monocarboxylic Acid Transporter, and the Dipeptide Transporter Families That Are Differently Regulated in Caco-2 Cells and Colon and Small Intestinal Tissue
Name ID
Log ratio values
colon SD Name ID
Log ratio values small intestine SD
ABC-1 gi|4128032 −0.47 0.61 ABC-1 gi|4128032 −0.60 1.01
Contig 13⳱ ABCA10
gi|18587266 0.53 0.22 Contig13⳱ ABCA10
gi|18587266 0.54 0.25
ABCB1 gi|4505768 −0.89 0.51 ABCB1 gi|4505768 −0.81 0.68
ABCB10 gi|9961243 −0.58 0.57 ABCB10 gi|9961243 −0.62 0.53
ABCB6 gi|9955962 0.63 0.15
ABCB7 gi|9665249 −0.79 0.49 ABCB7 gi|9665249 −0.96 0.68
ABCB8 gi|9955964 1.12 0.12 ABCB8 gi|9955964 0.61 0.22
ABCC2 gi|4557480 −0.60 0.37 ABCC2 gi|4557480 −0.65 0.39
ABCD4 gi|4826957 −0.70 0.58
ABCG2 gi|4757849 −0.76 0.48 ABCG2 gi|4757849 −0.72 0.28
ABCG5 gi|11692799 0.61 0.37
ABCG8 gi|11692801 1.12 0.55 ABCG8 gi|11692801 1.16 0.32
CFTR gi|180331 −1.13 0.53
PMP70 gi|35552 −0.67 0.58
hPept1 gi|773587 −0.86 0.87
MCT2 gi|3834394 −0.60 0.41
RF-hPept1 gi|2506042 0.69 0.38 RF-hPept1 gi|2506042 0.53 0.24
SLC16A4 gi|4759113 −1.16 0.89 SLC16A4 gi|4759113 −0.75 0.88
SUR2 gi|3127138 −0.69 0.62
Note: Relative expression levels are log2ratio values of Cy5 intensities in colon or small intestinal tissue over Cy3 intensities
in 3-week-old cells. Cut-off for log2ratio values was 0.45 (n⳱ 4 × 3).
Table VIII. Comparison of Small Intestinal and Colon Tissue
Name ID
Log ratio
values SD Name ID
Log ratio values SD
ABCA2 gi|9957466 0.80 0.20 AQP3 gi|9257193 −0.71 0.28
ABCC3 gi|9955969 0.85 0.51 Citrate transporter gi|950003 −0.71 0.44 SERCA3b gi|3004458 0.61 0.30 Contig224⳱ FATP gi|16162902 −0.69 0.28
CaCC2 gi|5726288 0.78 0.67 FPN1 gi|7109248 −0.65 0.29
Contig19⳱ ACATN gi|6042194 0.64 0.30 GLUT5 gi|183297 −0.90 0.36 Contig26⳱
HepG2/SLC2A1
gi|5730050 0.62 0.23 NADC1 gi|1098556 −0.66 0.25
Contig90⳱ similar to CAT, y+ system
gi|20485816 0.83 0.36 SERCA3 gi|2052511 −0.78 0.58
KCNE1 gi|4557686 0.89 0.25 SGLT1 gi|338054 −1.53 0.37
MAT8 gi|1085025 0.80 0.52 SLC20A2: phosphate transporter gi|5803172 −0.65 0.40 Neurotransmitter transporter, glycine gi|5902093 0.61 0.35 SLC9A3R1: sodium/hydrogen exchanger gi|4759139 −0.95 0.29 SCNN1B gi|1004270 0.83 0.51 Sodium-coupled nucleoside transporter gi|4759131 −0.66 0.39 SCNN1G gi|1004272 0.71 0.26 Na channel, nonvoltage-gated 1 alpha gi|4506814 0.63 0.43
Note: Relative expression levels are log2ratio values of Cy5 intensities in small intestinal tissue over Cy3 intensities in colon
transporter and channel genes in Caco-2 cells and compared them with small intestine and colon using microarrays. Caco-2 cells spontaneously convert from undifferentiated cells into polarized cells, requiring the expression of different proteins at the basolateral and apical sides of the cells. Therefore, we investigated the impact of differentiation on gene mRNA ex-pression (23–26) at a genomic level.
Relative mRNA expression levels clearly changed over time. However, the relative increases of mRNA expression levels measured by microarrays were smaller than expected based on quantitative PCR results of some selected genes. This is common to oligonucleotide arrays measuring mRNA levels and may be related to a background level of non-specific binding under the conditions used. However, genes that were significantly up-regulated, i.e.,∼1.4-fold increase or higher, could be confirmed by quantitative PCR (GLUT5,
OATPRP2, ABCC3, ABCA5 [Contig8], SLC5A3, ABC1), or
were implicated in Caco-2 cell differentiation in previous studies on individual genes. Gene mRNA expression changed during the first 2 weeks and reached a plateau between 2 to 3 weeks, which parallels changes of the TEERs. This pattern correlates with the stage of morphological differentiation (27). As shown earlier, Caco-2 cells differentiate spontane-ously after having reached confluency and are fully differen-tiated after 2 weeks. Only a few genes were strongly regulated over time. Most of these genes encode amino acid transport-ers, sugar transporttransport-ers, and ion transporters. MAT8, the
S-protein, Nramp2, and Na,K-ATPase b1 had the most
signifi-cant increase in mRNA expression levels. These channels and transporters are either related to chloride and iron homeo-stasis of the cells or to cell adhesion (28–31). This indicates that the development of an ion gradient and cell adhesion are crucial factors for polarization of the cells.
In human intestines, mRNA expression of a number of genes differed markedly from that in Caco-2 cells, regardless of the state of differentiation. For several genes, e.g., MAT8,
Nramp2, Na,K-ATPase b1, EAAT1, and HepG2,
differentia-tion of Caco-2 cells cause changes in mRNA expression that approximate the mRNA expression found in either small or large intestines. A few genes were more highly expressed in Caco-2 than in intestines: GLUT3 and the S-protein. GLUT3 is known to be expressed in Caco-2 cells (32). Earlier studies have demonstrated that GLUT3 does not appear to be ex-pressed in healthy intestinal tissue, but it was shown to be expressed in various tumors (22,33). Hence, the decrease of
GLUT3 mRNA expression upon differentiation is consistent
with a phenotypic change from colon-carcinoma-like into a non-tumor like epithelial cell. The over-expression of
S-protein, a cell adhesion-promoting plasma and tissue S-protein,
compared to intestinal tissues, and the increased mRNA ex-pression upon differentiation in Caco-2 cells indicate that cell adhesion mechanisms are crucial in Caco-2 cell differentia-tion. Overall, upon differentiation, Caco-2 cells become more similar to small intestinal cells (Tables V and VI). Many genes were similarly expressed in these two tissues, i.e., their rela-tive mRNA expression values were below the cut-off 0.45 of the log ratio values. Similarly, Engle et al. (13) showed that after reaching confluence, Caco-2 cells expressed proteins characteristic of colonocytes and small intestinal enterocytes. Thereafter, the content of colonocyte-specific proteins de-creased, whereas those specific for the enterocytes increased. However, a number of genes appear to be differently
expressed in Caco-2 cells compared to the small intestine and colon.
As to members of the ABC transporter, the monocar-boxylic acid transporter, and the dipeptides transporter fam-ily, well-known transporters that act as carriers of a variety of drugs, we observed significant mRNA expression changes only for a few ABC transporters during differentiation. Un-der less stringent but still significant criteria, hPept1 was ex-pressed less in the colon than in 3-week-old Caco-2 cells, whereas it was more highly expressed in the small intestine, which confirms earlier studies (17,34). As for the monocar-boxylic acid transporters we were unable to observe any sig-nificant changes during differentiation, or among the tissues examined. It needs to be kept in mind that the use of mRNA expression arrays—although providing a global picture of the mRNA expression of multiple genes—is less sensitive than other methods such as RT-PCR.
In summary, we have characterized the mRNA expres-sion profiles of numerous genes encoding transporters and ion channels, in differentiating Caco-2 cells and human small intestine and colon. The list of genes and oligonucleotide probes will be available elsewhere (AAPS PharmSci, URL to be provided). Fully differentiated Caco-2 cells can serve as a useful model for studying active drug transport, but the ex-pression of a number of transporters does not appear to re-flect mRNA levels in human intestines.
ACKNOWLEDGMENTS
This work was supported in part by NIH General Medi-cal Sciences, grant GM99004, Plasma Membrane Transporter Group at UCSF. We thank Dr. Rick Graul for his support with respect to the development of search strategies of puta-tive new genes. We also thank Dr. Joe DeRisi and Dr. Adam Caroll for help in the development of our microarrays.
REFERENCES
1. P. Stenberg, K. Luthman, and P. Artursson. Virtual screening of intestinal drug permeability. J. Control. Release. 65:231–243 (2000).
2. J. C. Venter, M. D. Adams, E. W. Myers, P. W. Li, R. J. Mural, G. G. Sutton, H. O. Smith, M. Yandell, C. A. Evans, R. A. Holt, et al. The sequence of the human genome. Science 291:1304–1351 (2001).
3. V. H. Lee. Membrane transporters. Eur. J. Pharm. Sci. 11:S41– S50 (2000).
4. A. Tsuji and I. Tamai. Carrier-mediated intestinal transport of drugs. Pharm. Res. 13:963–977 (1996).
5. H. Han, R. L. de Vrueh, J. K. Rhie, K. M. Covitz, P. L. Smith, C. P. Lee, D. M. Oh, W. Sadee, and G. L. Amidon. 5⬘-Amino acid esters of antiviral nucleosides, acyclovir, and AZT are absorbed by the intestinal PEPT1 peptide transporter. Pharm. Res. 15:1154–1159 (1998).
6. M. E. Ganapathy, M. Brandsch, P. D. Prasad, V. Ganapathy, and F. H. Leibach. Differential recognition of beta-lactam antibiotics by intestinal and renal peptide transporters, PEPT 1 and PEPT 2. J. Biol. Chem. 270:25672–25677 (1995).
7. H. Takanaga, I. Tamai, and A. Tsuji. pH-dependent and carrier-mediated transport of salicylic acid across Caco-2 cells. J. Pharm. Pharmacol. 46:567–570 (1994).
8. I. Tamai, H. Takanaga, H. Maeda, Y. Sai, T. Ogihara, H. Hi-gashida, and A. Tsuji. Participation of a proton-cotransporter, MCT1, in the intestinal transport of monocarboxylic acids. Bio-chem. Biophys. Res. Commun. 214:482–489 (1995).
9. S. Hoffmeyer, O. Burk, O. von Richter, H. P. Arnold, J. Brock-moller, A. Johne, I. Cascorbi, T. Gerloff, I. Roots, M. Ei-chelbaum, et al. Functional polymorphisms of the human
multi-drug-resistance gene: multiple sequence variations and correla-tion of one allele with P-glycoprotein expression and activity in vivo. Proc. Natl. Acad. Sci. USA 97:3473–3478 (2000).
10. M. M. Gottesman, T. Fojo, and S. E. Bates. Multidrug resistance in cancer: role of ATP-dependent transporters. Nat. Rev. Cancer 2:48–58 (2002).
11. P. Artursson, K. Palm, and K. Luthman. Caco-2 monolayers in experimental and theoretical predictions of drug transport. Adv. Drug Deliv. Rev. 46:27–43 (2001).
12. H. Lennernas. Human intestinal permeability. J. Pharm. Sci. 87:403–410 (1998).
13. M. J. Engle, G. S. Goetz, and D. H. Alpers. Caco-2 cells express a combination of colonocyte and enterocyte phenotypes. J. Cell Physiol. 174:362–369 (1998).
14. S. Brown and W. Sadee. A semi-automated approach to gene discovery through EST data mining: Discovery of new human transporter genes. AAPS Pharm. Sci. 3:E9 (2002).
15. P. K. Rathod, K. Janesan, R. E. Hayward, Z. Bozdeck, and J. L. DeRisi. DNA microarrays for malaria. Trends Parasitol. 18:39–45 (2002).
16. J. L. DeRisi, V. R. Iyer, and P. O. Brown. Exploring the meta-bolic and genetic control of gene expression on a genomic scale. Science 278:680–686 (1997).
17. D. Herrera-Ruiz, Q. Wang, O. S. Gudmundsson, T. J. Cook, R. L. Smith, T. N. Faria, and G. T. Knipp. Spatial expression pat-terns of peptide transporters in the human and rat gastrointesti-nal tracts, Caco-2 in vitro cell culture model, and multiple human tissues. AAPS Pharm. Sci. 3:E9 (2001).
18. J. D. Horisberger. Electrogenic Transepithelial Na+ Transport in the Colon. In K. E. and Barrett, M. Donowitz (eds.), Gastroin-testinal Transport: Molecular Physiology, Volume 50, Academic Press, San Diego, California 2001 pp 413–425.
19. D. G. Silberg, W. Wang, R. H. Moseley, and P. G. Traber. The Down regulated in Adenoma (dra) gene encodes an intestine-specific membrane sulfate transport protein. J. Biol Chem. 270:11897–11902 (1995).
20. W. S. Lee, Y. Kanai, R. G. Wells, and M. A. Hediger. The high affinity Na+/glucose cotransporter. Re-evaluation of function and distribution of expression. J. Biol. Chem. 269:12032–12039 (1994). 21. M. Agnel, T. Vermat, and J. M. Culouscou. Identification of three novel members of the calcium-dependent chloride channel (CaCC) family predominantly expressed in the digestive tract and trachea. FEBS Lett. 455:295–301 (1999).
22. H. Yano, Y. Seino, N. Inagaki, Y. Hinokio, T. Yamamoto, K. Yasuda, K. Masuda, Y. Someya, and H. Imura. Tissue distri-bution and species difference of the brain type glucose trans-porter (GLUT3). Biochem. Biophys. Res. Commun. 174:470–477 (1991).
23. P. Anderle, E. Niederer, W. Rubas, C. Hilgendorf, H. Spahn-Langguth, H. Wunderli-Allenspach, H. P. Merkle, and P. Lang-guth. P-Glycoprotein (P-gp) mediated efflux in Caco-2 cell mono-layers: the influence of culturing conditions and drug exposure on P-gp expression levels. J. Pharm. Sci. 87:757–762. (1998). 24. A. Mordrelle, E. Jullian, C. Costa, E. Cormet-Boyaka, R.
Bena-mouzig, D. Tome, and J. F. Huneau. EAAT1 is involved in trans-port of L-glutamate during differentiation of the Caco-2 cell line. Am. J. Physiol. 279:G366–373 (2000).
25. M. Pan, M. Malandro, and B. R. Stevens. Regulation of system y+ arginine transport capacity in differentiating human intestinal Caco-2 cells. Am. J. Physiol. 268:G578–585 (1995).
26. L. Mahraoui, M. Rousset, E. Dussaulx, D. Darmoul, A. Zweibaum, and E. Brot-Laroche. Expression and localization of GLUT-5 in Caco-2 cells, human small intestine, and colon. Am. J. Physiol. 263:G312–G318 (1992).
27. V. Bohner. Mechanisms and Pathways of Intestinal Peptide Ab-sorption: Permeation, Metabolism and Secretion, Eidgeno¨ssische Technische Hochschule Zurich, 1996 pp 84–85.
28. R. J. Wood and O. Han. Recently identified molecular aspects of intestinal iron absorption. J. Nutr. 128:1841–1844 (1998). 29. B. W. Morrison, J. R. Moorman, G. C. Kowdley, Y. M.
Kobaya-shi, L. R. Jones, and P. Leder. Mat-8, a novel phospholemman-like protein expressed in human breast tumors, induces a chloride conductance in Xenopus oocytes. J. Biol. Chem. 270:2176–2182 (1995). 30. S. Honore, V. V. Pichard, C. Penel, V. Rigot, C. Prev t, J. Mar-valdi, C. Briand, and J. B. Rognoni. Outside-in regulation of in-tegrin clustering processes by ECM components per se and their involvement in actin cytoskeleton organization in a colon adeno-carcinoma cell line. Histochem. Cell Biol. 114:323–335 (2000). 31. S. J. Keely and K. E. Barrett. Integrated signaling mechanisms
that regulate intestinal chloride secretion. In K. E. Barrett and M. Donowitz (eds.), Gastrointestinal Transport: Molecular Physiol-ogy, Volume 50, Academic Press, San Diego, California 2001 pp 249–299.
32. D. S. Harris, J. W. Slot, H. J. Geuze, and D. E. James. Polarized distribution of glucose transporter isoforms in Caco-2 cells. Proc. Natl. Acad. Sci. USA 89:7556–7560 (1992).
33. T. Yamamoto, Y. Seino, H. Fukumoto, G. Koh, H. Yano, N. Inagaki, Y. Yamada, K. Inoue, T. Manabe, and H. Imura. Over-expression of facilitative glucose transporter genes in human can-cer. Biochem. Biophys. Res. Commun. 170:223–230 (1990). 34. T. R. Ziegler, C. Fernandez-Estivariz, L. H. Gu, N. Bazargan, K.
Umeakunne, T. M. Wallace, E. E. Diaz, K. E. Rosado, R. R. Pas-cal, J. R. Galloway, et al. Distribution of the H+/peptide trans-porter PepT1 in human intestine: up-regulated expression in the colonic mucosa of patients with short-bowel syndrome. Am. J. Clin. Nutr. 75:922–930 (2002).