Figure S1. And1 and And2 antibodies react with different target proteins.
(A-C) Western blots of 3 dpa fin regenerates analyzed with And1 and And2 antibodies. Different amounts of proteins (5 µg, 15 µg and 45 µg) were loaded.
(A) And1 antibody detects a protein at approx. 75 kDa, which is higher than the predicted relative molecular weight of And1 (64 kDa). A higher size of the band as compared to the calculated value suggests that And1 might be post-translationally modified.
(B) And2 antibody detects a protein at approx. 57 kDa, which accurately matches the predicted molecular weight of the target protein (57 kDa). Additional faint bands below the strongest signal were detected in the lane containing most protein, which might indicate a presence of the cleaved forms of And2 or a low level of unspecific antibody binding.
(C) Overlay of And1- and And2-stained membranes demonstrates that both antibodies react with distinct proteins. 70 55 35 25 100 130 5 µg 15 µg 45 µg 5 µg 15 µg 45 µg 70 55 35 25 100 130 5 µg 15 µg 45 µg 70 55 35 25 100 130
And1 And2 And1 / And2
Ladder Ladder Ladder
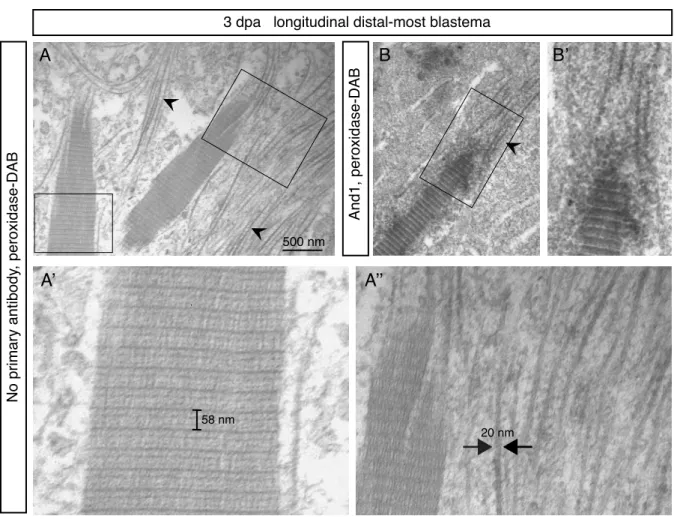
3 dpa longitudinal distal-most blastema And1, peroxidase-DAB No primary antibody , peroxidase-DAB 500 nm
A
B
B’
A’
A’’
20 nm 58 nmFigure S2. Assembly of actinotrichia detected by electron microscopy of the distal-most blastema.
(A-B) Electron microscopy of the distal-most blastema at 3 dpa was performed after peroxi-dase-DAB immunohistochemical staining following no primary antibody (control; A) or in com-bination with And1 antibody (darker immunolabeled actinotrichia; B). Thin fibrils of a constant width of ≈ 20 nm (arrowheads; A’’) assemble into higher order striated fibers (A’). (A’) The main periodic striation of ≈ 60 nm is further subdivided into finer bands. (A’’) An accretion of fibrils on the extremities and surface of the actinotrichia are observed, so that the units may grow in width and in length.
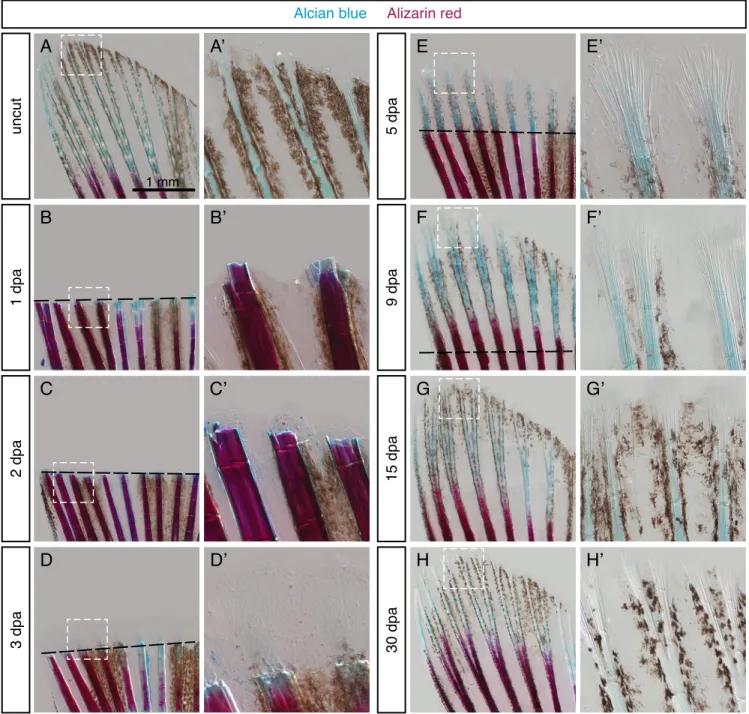
uncut 1 dpa 2 dpa 3 dpa 5 dpa 9 dpa 15 dpa 30 dpa
Alcian blue Alizarin red
1 mm
A
A’
B
B’
C
C’
D
D’
E
E’
F
F’
G
G’
H
H’
Figure S3. Dynamics of bone matrix formation during regeneration.
(A-H’) Dynamics of bone matrix formation during fin regeneration visualized by Alcian blue and Alizarin red histological staining. Calcified lepidotrichia/bone in pink, non-calcified lepidotrichia in blue. Actinotri-chia seen in contrast in the magnified panels. Black dashed lines represent plane of amputation. N ≥ 4 fins for each time point.
Uncut 3 dpa 30 µm 30 µm 100 µm 100 µm And1 3D projections A B C D
xy-view zy-view xy-view zy-view
Figure S4. Actinotrichia fibers form palisades on both sides of the distal blastemal mesenchyme.
(A-D) 3D projections of actinotrichia (And1; green) in uninjured (A, B) and at 3 dpa (C, D) fins. Images extracted from S1 Movie. Side views (B, D) show that actinotrichia fibers form two-sided palisades.
Supplementary Movies:
S1 Movie. Movie of 3-D reconstruction of the actinotrichia-containing portion of uncut and 3 dpa fins.
Reconstruction from a whole-mount immunostaining for And1 (green). Confocal images were acquired with a z-step of 0.2 µm.
S2 Movie. Movie of 3-D reconstruction of one half of a blastema at 3 dpa. Reconstruction from a
whole-mount immunostaining for And1 (green). Confocal images were acquired with a z-step of 0.4 µm.
Figure S5. Actinotrichia resume regeneration after a pulse inhibition of signaling pathways.
(A-C) Pulse exposure to the inhibitors of the IGF (AEW541), TGFβ/Activin-βA (SB431542) and FGF (PD173074) signaling pathways. (A) Experimental design. (B) Live-imaging at 4 and 10 dpa. Fins resumed regeneration without major morphological defects after interruption of treatments. N = 4 fish per treatment. (C) Whole-mount immunofluorescent staining for And1 (green) and Zns5 (red) of 10 dpa fins shows recovery of actinotrichia fibers after arrest of treatment. Bone autofluorescence in blue. N = 4 fish per treatment.
(D-F) Pulse inhibition of the FGF pathway through heat-shock activation of the dominant negative FGF receptor type 1 (hsp70:dnfgfr1-egfp fish). (D) Experimental design (E) Live-imaging at 2, 3 and 10 dpa shows recovery after pulse inhibition of the FGF pathway. Persistent morphological defects in 2 of 4 transgenic fins. (F) Whole-mount immunofluorescent staining for And1 (green) and Zns5 (red) of 2, 3 and 10 dpa fins. Bone autofluorescence in blue. After heat-shock actinotrichia fibers decreased in the blastema (3 dpa). At 10 dpa, actinotrichia recovered. N ≥ 3 fish per group per time point. hs: heat shock.
4 dpa
10 dpa
Control(0.1% DMSO) 5 µM AEW541
2 mm
And1 Zns5 autofluorescence
10 dpa
0 dpa 2 dpa 4 dpa 10 dpa
Inhibitor collect 200 µm wild-type hsp70:dnfgfr1 2 dpa 3 dpa 10 dpa
0 dpa 2 dpa 3 dpa hs (1h;37°C) 10 dpa 2 mm wild-type hsp70:dnfgfr1 2 dpa (before hs) 3 dpa (1d post-hs) And1 Zns5 autofluorescence 10 dpa (recovery) 200 µm 10 µM SB431542 10 µM PD173074