Life Cycle Management (Section Editor: Gerald Rebitzer)
A New LCA Methodology of Technology Evolution (TE-LCA) and its
Application to the Production of Ammonia (1950
−2000)
Ramon Mendivil1, Ulrich Fischer1*, Masahiko Hirao2 and Konrad Hungerbühler1
1 Institute for Chemical and Bioengineering, Safety & Environmental Technology Group, ETH Zurich, 8093 Zurich, Switzerland 2 Department of Chemical System Engineering, The University of Tokyo, 113-8656 Japan
* Corresponding author ([email protected])
and which the economic consequences of changes in environ-mental legislation were. The new methodology has to be ap-plied to additional case studies, i.e. to other chemical sectors than basic chemicals and to other branches than chemicals. In other chemical sectors, toxic emissions from the production proc-ess might have to be considered and trade-offs between these and the overall energy consumption might result.
Keywords: Ammonia production; environmental impact as a function of time; life cycle assessment methodology; regulation impact; technology evolution (TE-LCA)
DOI: http://dx.doi.org/10.1065/lca2005.08.222 Abstract
Goal, Scope and Background. This paper presents a new LCA
method of technology evolution (TE-LCA), and its application to the production of ammonia, the second largest chemical prod-uct in the world, over the last fifty years. The TE-LCA of a chemical process is the procedure in which historical informa-tion on a process, mainly the evoluinforma-tion of technical parameters, is translated by simulation to mass and energy balances as a function of time. These mass and energy balances are then trans-formed into environmental impact indicators using common LCA approaches. Finally, the evolution of environmental im-pact resulting from the investigated process can be related to its technical and other, i.e. legislative, developments.
Methods. The technological evolution of the production of
am-monia was compiled according to three basic sources of infor-mation: patents, publications and industry data. From these sources in a first step, the major technological advances of the process were identified as a function of time delivering different process variants that were modelled using the simulation soft-ware Aspen Plus®. In a second step, the evolution of environ-mental regulations is studied. For those energy related emis-sions that were regulated, e.g. SOx and NOx, it was assumed that threshold values defined in legislation were realized imme-diately. The aggregation of both steps allows the calculation of the emissions resulting from the production (cradle to gate view) of the investigated chemical as a function of time.
Results and Discussion. The application of the TE-LCA to the
production of ammonia revealed when and to which extent tech-nological and legislative developments resulted in the reduction of energy related emissions in the production of this chemical compound. Overall, the reduction of emissions from ammonia production was highly influenced by the technological develop-ment and only to a lower extent by environdevelop-mental regulations.
Conclusion. The results obtained from the TE-LCA method is
useful to reveal how the environmental performance of a proc-ess developed in the past and to identify the reasons for this development. The investigated case study of ammonia produc-tion shows that investment in technological development also paid off in terms of being ahead of tightened environmental legislation that might bear potential cost consequences such as carbon dioxide tax.
Outlook. The presented method can be easily extended by
in-cluding an economic analysis, which provides additional infor-mation on why certain technological developments were enforced
Introduction
LCA methodologies were originally developed to create de-cision support tools for distinguishing between products, product systems, or services on environmental grounds. In chemical process design, LCA is used as a tool to compare different process alternatives [1–4].
The performance of a chemical process is influenced by many variables during its lifetime. The introduction of new tech-nologies, changes of the market situation and new environ-mental regulations among others are continually affecting environmental and economic performance. In order to iden-tify the ecological drivers and barriers in the long term evo-lution of a technology, tools have to be developed to moni-tor the long term dynamics of the ecological process per-formance [5–8]. Here, inventories are needed that display the temporal development of the system under investiga-tion. Dynamic models in LCA have been used by [9,10].
2 Methodology
The TE-LCA will be presented using the production of am-monia as a case study. The TE-LCA methodology is divided into four steps following the LCA framework [11]: goal and scope definition, inventory analysis, impact assessment, and interpretation (Fig. 1).
2.1 Goal and Scope Definition
The goal of the study is to obtain the TE-LCA of the pro-duction of ammonia for the last fifty years. Thus, the TE-LCA represents an environmental learning curve that
com-plements the economic perspective on the performance of a chemical process over time. By this in particular, technology managers in industry obtain valuable information on the per-formance of certain technologies, which they might use for process improvements. TE-LCAs also contribute to the defi-nition of benchmarks and Best Available Technologies (BAT). Ammonia, after sulfuric acid, is the second largest chemical produced worldwide [12]. It is the main raw material for fertilizer production (about 80% of ammonia is used for fertilizers) [13] and is the basic building block of most of the large tonnage chemicals that contain nitrogen. The ammo-nia process is known since 1913. A number of technological changes in the ammonia production occurred which render this process an excellent case study for the new method pre-sented here.
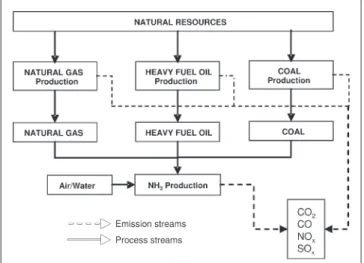
The process boundaries considered are shown in Fig. 2. No impact due to service processes such as transportation or storage will be considered. The functional unit considered is the production of one kilogramme of ammonia in a cradle to gate perspective, i.e. besides the ammonia process also the feedstock processes and energy conversion is taken into
account. An average production technology was assumed and technological advances were considered in the year of their publication. Each technological advance resulted in a new process layout, for which updated mass and energy balances were obtained by simulation. For those energy re-lated emissions that were regure-lated, e.g. SOx and NOx, it was assumed that threshold values defined in legislation were realized immediately. Therefore, these emissions are obtained from the evolution of environmental regulations, i.e. the development of emission limits in the US.
The environmental impact as considered in this work only stems from energy supply and raw material production which again requires energy services. Production of energy also requires certain energy consumption. It is assumed that this energy will come from the respective energy source produced. This means that for the production of natural gas the source of energy will be natural gas and the emissions from natural gas production will be considered to come from natural gas combustion. To illustrate the principle of TE-LCA and to cover a time frame of 50 years for the ammonia process, only air emissions are considered in the case study presented here.
2.2 Inventory Analysis
The inventory analysis within the TE-LCA method consists of two major steps, data collection and data analysis (see Fig. 1).
2.2.1 Data collection
The data collection step for the ammonia case study and the period from 1950 to 2000 is based on three basic sources of information: patents, publications and industry data. The av-erage ammonia technology considered is depicted in Fig. 3. Ammonia Process. The classical Haber-Bosch plant used coal as a source of hydrogen [14] and the first plant was built in 1940 in Oppau, Germany. To avoid the expensive coking step, direct gasification of coal was explored [12]. Around 1940, natural gas became cheap in huge quantities in North America [15] and ten years later in Europe [16]. During this Fig. 1: Methodology of the LCA of technology evolution (TE-LCA)
period of European delay, ICI (Imperial Chemical Industries) succeeded with steam-reforming of light naphtha. The first plant went on stream in 1959 [17]. By 1952, about 80% of the synthetic ammonia in the USA was produced by plants using the methane-steam reaction. All these plants operated at essentially atmospheric pressure [18].
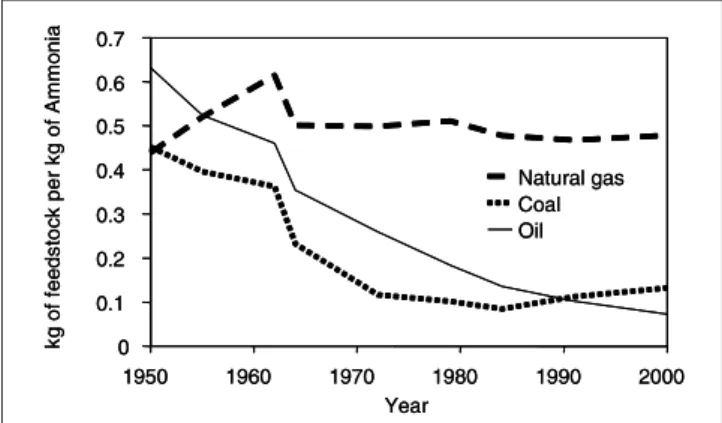
At the same time, oil producers (Texaco and Shell) devel-oped partial oxidation processes. They are used for the gasi-fication of heavy feedstock such as residual oils and coal. Extremely viscous hydrocarbons and plastic wastes may also be used as fractions of the feed [19]. An air separation unit is required for the production of oxygen for the partial oxi-dation step. The nitrogen is added in the liquid nitrogen wash to remove impurities from the synthesis gas and to obtain the required hydrogen/nitrogen ratio. As compared to steam reforming of natural gas, partial oxidation of fuel oil consumes 20% more energy. Fig. 4 shows the evolution of the different raw materials used in the ammonia produc-tion. Due to its superior energy performance and based on the
known resources of fossil raw materials, natural gas domi-nated and will dominate as the feedstock for ammonia for the next 50 years at least. In the long term, one might expect coal to take over, based on world reserves and consumption rates. Fig. 4 shows how coal is slowly increasing its market share, which is due to the fact that China is basing its ammonia pro-duction on this feedstock. Heavy oil may be attractive under special environmental concerns, when natural gas is not avail-able and the partial oxidation process could solve a waste problem (heavy residues, plastic recycling).
One important aspect of partial oxidation is gasification at elevated pressures, which takes advantage of the volume expansion from feedstock to product gas. This constitutes considerable savings in compression energy. It is even more effective if the feedstock is available at an elevated pressure, as is the case for natural gas. For this reason, in 1953, reforming process designers began to raise the operating pressure. The extent to which this could be done, however, was limited by the tube material. For equilibrium reasons, the residual meth-ane content in the product gas increases with raising pressure, which can be compensated by higher temperature or, less eco-nomically, by a higher steam-on-carbon ratio [12,20]. The steam/air reforming concepts (conventional, unconven-tional and autothermal reforming) [21,22] based on natural gas and other light hydrocarbons are considered to be the dominating technologies. The performance of the three al-ternatives is similar. In this study, only the evolution of con-ventional steam reforming was investigated. For heavy feedstocks, partial oxidation is considered as the best pro-duction process. The heat for the reforming process is sup-plied by burning natural gas or other gaseous fuel, the flue-gas is one of the main sources of emissions from the plant. These emissions are mainly CO2, NOx, with small amounts
of SO2 and CO, depending on the energy source. Fig. 3: Scheme of the average ammonia production process
Fig. 4: Evolution of the feedstock in the world ammonia production Synthesis Gas Production
FEED STEAM AIR M-1 Low Temperature Shift Converter Primary
Reformer SecondaryReformer
High Temperature Shift Converter Reforming Gasification Section Shift Conversion NATURAL GAS HEAVY FUEL OIL COAL Air and Steam Separation CO2 CO2 Absorption Methanation CO2 removal Ammonia Loop PRODUCT BLEED Ammonia Converter High Pressure Flash Low Pressure Syngas Compression Ammonia Converter NH3
Synthesis Gas Production
FEED STEAM AIR M-1 Low Temperature Shift Converter Primary
Reformer SecondaryReformer
High Temperature Shift Converter Reforming Gasification Section Shift Conversion NATURAL GAS HEAVY FUEL OIL COAL Air and Steam Separation CO2 CO2 Absorption Methanation CO2 removal Ammonia Loop PRODUCT BLEED Ammonia Converter High Pressure Flash Low Pressure Syngas Compression Ammonia Converter NH3
The outlet from the reforming/partial oxidation section leads to the shift converter zone where carbon monoxide is re-acted with water to carbon dioxide, producing hydrogen. The CO2 is removed in a chemical or a physical absorption process. The small amounts of CO and CO2 remaining in
the synthesised gas are poisonous for the ammonia synthe-sis catalyst and must be removed by conversion to CH4 in
the methanator. Dried synthesis gas consists of nitrogen and hydrogen in stoichiometric proportions (1:3). Inert gases, argon and methane are also introduced into the ammonia loop. The equilibrium reaction that takes place in the loop converter yields 20% to 28% in ammonia. The ammonia is then liquefied and separated from the non-reacted synthe-sised gas. Since inert gases are introduced into the loop, a purge is required.
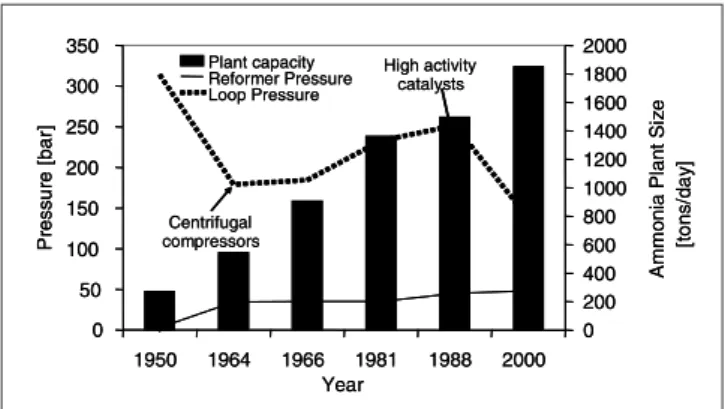
The growing demand of fertilizers due to an increase of world population generated a necessity for ammonia that together with the economy of scale resulted in an increase in the size of ammonia plants [12]. This increase reached a critical point when radial converters [21] and centrifugal compressors [23,24] appeared during the mid-sixties. During this period, improvements in the construction technology resulted in the large ammonia plant concept propagated by Kellogg. Fig. 5 shows the evolution of the ammonia plant capacity over time. The technological advances achieved in the reformer sec-tion focused on reducing the overall energy consumpsec-tion of the plant [16,25–28]. For this reason, an increment in the operating pressure of the reformer took place to reduce the operating costs of the loop compressors. The development of centrifugal compressors [23,29] allowed working at higher pressures with lower costs (see Fig. 5). This change forced an increase in the temperature of the reforming section to obtain an equivalent conversion.
From the very beginning, only one stage of high tempera-ture shift converter (HTSC) was used [18]. Beginning in 1962, two stages of HTSC were used [14,19,20,30,31]. In 1963, the low temperature shift converter (LTSC) appeared. In 1966, 47% of the plants used LTSC. In 1971, the Selectoxo process appeared. In this study, a conversion of 90% of car-bon monoxide in one stage of HTSC [32] was assumed, while 96% of the conversion was assumed for an LTSC.
The energy consumption for solvent regeneration has always been the major driving force of technology improvement in
the CO2 absorption process. Chemical absorption processes have periodically decreased their steam requirements. Physi-cal absorption processes resulted in a large technology jump when higher overall operating pressures were achieved, al-though hybrid processes can nowadays be considered as the process with lower energy requirements [27,33–44]. Fig. 6 shows the energy consumption per kmol of CO2
ab-sorbed for the different separation processes. The major barrier for the further development of these processes was the high investment cost of switching to a different technol-ogy. For example, at a certain point in time it may have been cheaper to change the additives of a chemical absorp-tion process instead of switching to a physical absorpabsorp-tion. The carbon dioxide produced can be sold after purification. Changes in the technological development of the ammonia loop focused on obtaining catalysts with higher activity and converters with lower pressure drop and higher conversion [17,30,45,46] (see Fig. 5). The development of new compres-sors highly influenced the operating pressure of the ammo-nia loop. It is evident how centrifugal compressors influenced the ammonia loop pressure operation, because the economic optimum of centrifugal compressors was at 150 bar [29,47]. Pressure increased slowly to obtain higher yields until the introduction of new, highly active catalysts at the end of the 1980s allowed a pressure reduction [48]. The development of low pressure converters with a smaller pressure drop dur-ing the 1980s also justified a lower workdur-ing pressure in the ammonia loop [49,50].
In a typical ammonia plant, the purge of inert gases repre-sents 4–6% of the total synthesised gas [22]. Before 1950, the purge exited the process without any treatment. In 1952, the purge was used as combustion gas in the reformer because of its high hydrogen content. In 1964, cryogenic separators for the recovery of hydrogen became available. In 1971, a new technology based on semi-permeable membranes competed with the cryogenic separators. Efficiencies in hydrogen re-covery are 85–95% in membrane rere-covery and 90–95% in cryogenic recovery [51]. Both technologies are improving and it is difficult to consider one better than the other. Fig. 5: Technical parameters of ammonia plants as a function of time
Fig. 6: Evolution of energy consumption for the CO2 absorption process
in ammonia production 0 50 100 150 200 250 300 350 1950 1964 1966 1981 1988 2000 Year P re ssu re [ba r] 0 200 400 600 800 1000 1200 1400 1600 1800 2000 A m m o ni a P lant S iz e [t o n s /d a y ] Plant capacity Reformer Pressure Loop Pressure Centrifugal compressors High activity catalysts 0 50 100 150 200 250 300 350 1950 1964 1966 1981 1988 2000 Year P re ssu re [ba r] 0 200 400 600 800 1000 1200 1400 1600 1800 2000 A m m o ni a P lant S iz e [t o n s /d a y ] Plant capacity Reformer Pressure Loop Pressure Centrifugal compressors High activity catalysts 0 50 100 150 200 250 1950 1959 1972 1975 1984 1987 1991 Year E n e rgy c o n s u m pt io n [k J/k m ol CO 2 ] MEA Benfield (single stage) Benfield (single stage + ejector) Selexol 90% Selexol 100% Benfield (LowHeat) aMDEA (double stage) 0 50 100 150 200 250 1950 1959 1972 1975 1984 1987 1991 Year E n e rgy c o n s u m pt io n [k J/k m ol CO 2 ] MEA Benfield (single stage) Benfield (single stage + ejector) Selexol 90% Selexol 100% Benfield (LowHeat) aMDEA (double stage)
In energy terms, a cryogenic purification represents an en-ergy saving of up to 0.7 GJ per ton ammonia [52], as com-pared to having a purge. Nowadays, membrane purge tech-nology has similar energy consumption.
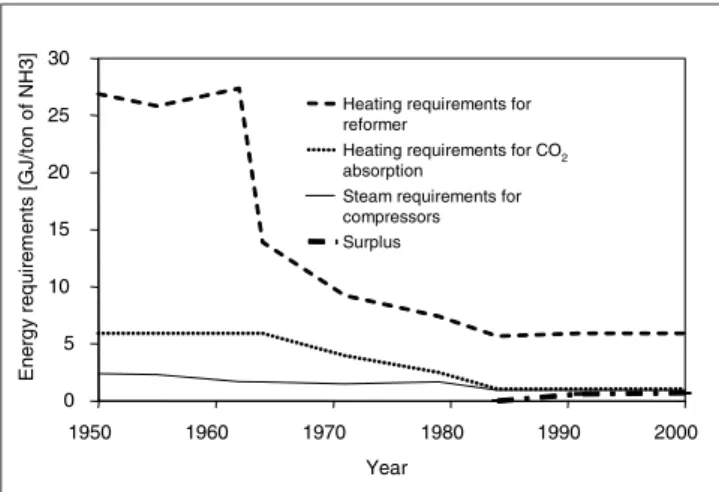
In 1965, surplus heat from a reformer produced 1.2 tons of steam at a pressure higher than 100 bar per ton of ammonia produced [47]. This heat could be used in different parts of the ammonia plant. As an effect of the oil crisis, a higher integration (integrated auxiliary boilers) of the different parts of an ammonia plant was conducted. In 1976, about 85% of the total energy demand of the plant was supplied by waste heat [12]. The steam generated in the reformer step provides most of the power required for synthesis gas compression (85% in 1976) [12]. During the early 80s, waste heat recov-ery was conducted in a way that the generated surplus of energy was exported outside the ammonia plant [53]. Natural Gas, Oil and Coal Production and Combustion Proc-esses. During the past two decades, the technological evolu-tion of the oil and gas industry focused on improving explora-tion and producexplora-tion technology [54–56]. This led to significant levels of commercial production from a new class of natural gas collectively called unconventional natural gases. Efficiency improvements in oil refineries are limited mainly by the lack of competitive financial conditions [56]. Due to the low price of oil, capital investments in refinery upgrades often would not provide a competitive economic return. The same is true for coal processing upgrades. Low prices of fossil fuels are consequences of many traditional policies like direct and indirect subsidies, non-inclusion of external costs associated with their production and use (environmental and social costs), large scale of consumption and long time pres-ence in the market. These factors allowed the creation of an optimized production, transportation and commercializa-tion structure.
Later regulations on methane emissions forced the coal, oil and gas industries to reduce such emissions. Due to the STAR programme, the natural gas industry has been reducing meth-ane emissions over the last 10 years. Similar efforts have been made in the coal and oil production [57].
These small changes and the low impact of the production technology of natural gas itself have led to discard an in-depth study of its technology evolution. A similar situation was assumed for the oil and coal sectors where the produc-tion itself did not undergo dramatic changes over the last fifty years [58,59].
Evolution of Environmental Legislation. In this section, the evolution of the environmental regulations relevant to the case study [60] is summarized. In 1955, the US federal gov-ernment decided that the air pollution problem needed to be dealt with on a national level and created the Air Pollu-tion Control Act [61]. Eight years later, Congress passed the nation's Clean Air Act of 1963 [62]. This act dealt with reducing air pollution by setting emission standards for sta-tionary sources such as power plants and steel mills. Amend-ments to the Clean Air Act were passed in 1965, 1966, 1967, and 1970 [63–66].
During the 70s [67], the issue was addressed again because the existing laws were deemed inadequate. Although tech-nically an amendment, the Clean Air Act of 1970 established new primary and secondary standards for ambient air qual-ity, set new limits on emissions from stationary and mobile sources, and increased funds for air pollution research. In 1990 [68], the federal government revised the Clean Air Act due to growing environmental concerns. The Clean Air Act of 1990 addressed five main areas: air-quality stand-ards, motor vehicle emissions and alternative fuels, toxic air pollutants, acid rain, and stratospheric ozone depletion. In many ways, this law set out to strengthen and improve ex-isting regulations. The 1990 Clean Air Amendment author-ized the EPA to establish standards for a number of atmos-pheric pollutants, including SO2 and NOx.
2.2.2 Data Analysis
In this step, the results obtained in the data collection step are converted into mass and energy balances for the pro-duction of ammonia. For this purpose, the process simula-tion software Aspen Plus® was used to model different
vari-ants of the ammonia process representing different points in time. Fig. 7 shows the evolution of the average feedstock for the production of one kilogramme of ammonia. These val-ues include the amounts of natural gas, coal and oil required for the reaction and the amount of these materials required as an energy source.
SimaPro 5.0 data for oil [69], coal [70] and natural gas [71] combustion were used as a basis for calculating the emis-sions per amount of energy carrier over time. Restrictions produced by environmental regulations were applied to these emissions to obtain an evolution of the emission levels per GJ over time. According to the SimaPro 5.0 database, 54MJ [71] of energy are obtained from the combustion of one kg of natural gas assuming 100% efficiency. Simple natural gas combustion produces low SOx and NOx emissions. Information about emissions for the production of natural gas, coal, and oil can be found in the literature [69–75]. As an assumption, all the emissions from the production of these sources of energy will be considered to come from the com-bustion of the respective energy sources. As a result, 2.7 MJ, 1.465 MJ, and 5.41 MJ of energy are required for the
pro-Fig. 7: Calculated feedstock requirements per kilogramme of ammonia as a function of time 0 0.1 0.2 0.3 0.4 0.5 0.6 0.7 1950 1960 1970 1980 1990 2000 Year k g of f e eds to c k pe r k g o f A m m oni a Natural gas Coal Oil 0 0.1 0.2 0.3 0.4 0.5 0.6 0.7 1950 1960 1970 1980 1990 2000 Year k g of f e eds to c k pe r k g o f A m m oni a Natural gas Coal Oil
duction of one kg of natural gas, coal and oil, respectively. A major criticism of coal as a fuel source for energy genera-tion is that it produces large amounts of pollutants, prima-rily sulfur dioxide (SO2), nitrogen oxides (NOx), and small
particulate matter (SPM), as well as carbon dioxide (CO2), which is implicated in global climate change.
According to the SimaPro 5.0 database from the combus-tion of one kg of coal and oil, 29.3 MJ and 41 MJ of energy are obtained respectively assuming 100% efficiency [73,74]. Over the last fifty years, advanced technologies have dra-matically improved the environmental performance of flue gas desulphurization systems for SO2 control and NOx re-duction technologies [76]. The evolution of the resulting emissions of NOx, SOx and SPM due to changes in
environ-mental regulations is shown in Fig. 8.
2.3 Impact Assessment
For this study, the environmental indicators considered com-prise nitrogen oxides (NOX including N2O), carbon
mon-oxide (CO), carbon dimon-oxide (CO2), volatile organic com-pounds (VOCs, including CH4), sulfur dioxide (SO2), and
small particulate matter (SPM) [69–72].
Amounts of energy and raw materials required in the am-monia process are used to obtain the resulting emissions and were finally added up to obtain the overall emissions of ammonia production. Emissions of CO2, NOx and VOC
were aggregated into one single impact category, the global warming potential (GWP).
2.4 Interpretation
The results of the TE-LCA method represent the environmen-tal impact of the process as a function of time. For the case study on ammonia production, these findings reflect the influ-ence of the technological development and environmental regu-lations on the environmental performance of the process.
3 Results and Discussion
In this study, the environmental assessment of ammonia pro-duction has been based on the total energy and raw mate-rial consumption of the production process and the upstream
processes. Combustion of natural gas, coal and oil has been considered as a direct source of emissions. Fig. 9 shows four major aspects of the energy consumption in the ammonia production: The heating required for running the plant, mainly the reformer section, the requirements for carbon dioxide absorption, the requirements for running the com-pressors before the loop and the surplus generated from the beginning of the early nineties on. These results show that ammonia production has dramatically changed over the last fifty years. Changes in feedstock, but most importantly changes in technology, have led to a more efficient process in which energy consumption has been reduced to about 25% of the requirements in 1950.
Ammonia production had a fast technological improvement as displayed in Figs. 5 and 6. Reasons for this are based on the importance of ammonia. Another reason is the owner-ship of the technology. There are several companies that li-cense ammonia technology such as ICI, Kellog, Topsoe, Uhde, Ammonia Casale and competition increased efforts for further development of the ammonia process.
The emissions from the ammonia production (Fig. 10) are influenced by two factors, the evolution of its technology and the feedstock production. During the first ten years stud-ied, the most important factor that affected the emissions was just the feedstock mix used. During this period, a slight descent in the emissions can be observed due to the intro-Fig. 8: Evolution of coal and heavy oil combustion emissions over time as
function of environmental regulations Fig. 9: Calculated energy requirements in ammonia production as a func-tion of time
Fig. 10: Evolution of emissions from ammonia production 0 5 10 15 20 25 30 1950 1960 1970 1980 1990 2000 Year E nerg y r e q u ir em ent s [ G J /t o n o f N H 3 ]
Heating requirements for reformer
Heating requirements for CO2
absorption Steam requirements for compressors Surplus 0 1 2 3 4 5 1950 1955 1962 1964 1971 1979 1984 1991 2000 Year Emi s s ions [kg/ G J ] NOx SOx SPM He av y O il Coal 0 1 2 3 4 5 1950 1955 1962 1964 1971 1979 1984 1991 2000 Year Emi s s ions [kg/ G J ] NOx SOx SPM He av y O il Coal 0 20 40 60 80 100 120 140 160 1950 1960 1970 1980 1990 2000 Year E m is s ions [k g/ ton NH 3 ] 0 500 1000 1500 2000 2500 3000 3500 4000 4500 CO 2 e m ission s [k g CO 2 /t o n N H3 ] SPM SOx VOC NOx CO CO2
duction of natural gas as the main raw material. The trend to raise the reformer working pressure during the following years increased the overall energy demand due to a higher steam to carbon ratio. Emissions did not increase during this period due to the continuous introduction of natural gas as a main feedstock. The development of centrifugal com-pressors around 1960 allowed the increase of loop and re-former working pressures at lower energy cost and decreased the overall energy consumption of the plant significantly. Emissions kept decreasing during the following years due to the combined effect of the operating conditions and the feedstock mix. The development of centrifugal compressors also allowed the Kellog and Topsoe concept of bigger am-monia plants. This concept allowed higher energy efficiency, thus decreasing the emissions per kilogramme of ammonia produced. The 1970–1980 period was highly influenced by the energy crisis and many actions were conducted to in-crease energy efficiency. Heat integration and improved CO2
absorption systems together with the continuous introduc-tion of natural gas as preferred feedstock decreased the over-all energy consumption and thus the total emissions. Fi-nally, the development of new catalysts with a higher yield at lower pressure combined with the introduction of high capacity and low pressure drop converters during the last part of the eighties shaped ammonia processes almost to those as known nowadays.
The values of CO2, SOx and NOx emissions evolved in a similar way until the beginning of the seventies (see Fig. 10). Since then, two factors affected the different behaviour of the curves, the feedstock mix and the legislation. Cleaner natural gas increased its market share in comparison to coal or oil, and highly affected the emissions of SOx. The clean air act introduced in 1971, 1979 and 1984 controlled NOx
and SOx emissions. The effect of legislation can be observed
as a steeper descent of the SOx and NOx curves versus the CO2 curve, since CO2 was not regulated.
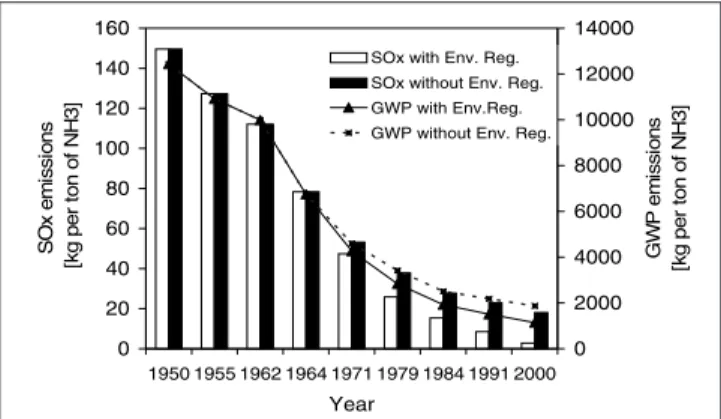
Fig. 11 shows the evolution of the GWP emissions, and the SOx emissions with and without the effect of environmental
regulations. The results of not having environmental regu-lations were obtained by using the emissions from 1950 during the whole time of study. A difference between the curves can be observed as soon as the clean air act of 1971 established first emission limits resulting in the implementa-tion of end of pipe cleaning technologies.
From the environmental point of view, Fig. 11 shows that emissions have decreased as a result of the technological im-provements and environmental regulations. Some of the re-ductions are due to the combined effect of technology and regulations, such as for NOx, SOx and VOC. In the case of CO2, the reduction in emissions was only due to the effect of technological change which resulted in a more efficient use of energy. The values for SOx emissions and GWP calculated for the year 2000 are close to the corresponding values for am-monia processes that are given in the database ecoinvent [77]. Fig. 11 shows that the emissions from ammonia production have dramatically changed over the last fifty years. The in-troduction of the Clean Air Act started to restrict the amounts of air pollutants released from combustion of energy carri-ers. Nevertheless, energy savings have been the major driv-ing force for the reduction of emissions. Since only emis-sions from energy consumption were taken into account in this case study, no trade-offs between reductions in energy consumption and chemistry-specific emissions were revealed. The scenario might be different for cases in which emissions from the (chemical) production process itself have to be con-sidered. Then, a trade-off between energy consumption and emission limits might result and the role of environmental regulations might be higher.
4 Conclusions
In this paper, a new methodology to obtain the LCA of tech-nology evolution (TE-LCA) of the production of a chemical product was presented. The objective of the method is to ob-tain an overall evolution of the environmental performance of the different processes involved. The methodology was ap-plied to the case study of ammonia production. The results revealed that the environmental performance of this process was highly influenced by the technological development and to a lower extent by the environmental regulations. Thus, it can be concluded for the case of ammonia, that not prima-rily legislation but technical progress led to a better envi-ronmental performance. This case study shows that invest-ment in technological developinvest-ment also paid off in terms of being ahead of tightened environmental legislation, with potential cost consequences such as carbon dioxide tax. In summary, the information obtained from this method is useful to understand how the environmental performance of a process including its precursors developed in the past. It reveals the mechanisms of technical innovation, for a spe-cific process as well as in general, and how it is linked to and triggered by business and legislative constraints. Fur-thermore, the review of technological developments in a cer-tain field identifies those technologies that hold the most promise for further improvements towards sustainability. The presented method can be extended by also including the analysis of economic performance of the system investigated.
Acknowledgement. We thank Hironori Hamanaka (Ministry of Envi-ronment, Japan), Gregory J. McRae (MIT) and Stefanie Hellweg (ETH) for valuable comments on this manuscript. This work is part of the collaboration between ETH, MIT and The University of Tokyo under the Alliance for Global Sustainability (AGS).
Fig. 11: Evolution of emissions of SOx and GWP gases resulting from the
ammonia production 0 20 40 60 80 100 120 140 160 1950 1955 1962 1964 1971 1979 1984 1991 2000 Year S O x em is s ions [ k g per t on of N H 3 ] 0 2000 4000 6000 8000 10000 12000 14000 G W P em is s ions [k g per t on of N H 3 ]
SOx with Env. Reg. SOx without Env. Reg. GWP with Env.Reg. GWP without Env. Reg.
References
[1] Cano-Ruiz JA, McRae GJ (1998): Environmentally conscious chemi-cal process design. Annu Rev Energy Environ 23, 499–536
[2] Azapagic A (1999): Life cycle assessment and its application to process selection, design and optimization. Chem Eng J 73, 1–21
[3] Hoffmann VH, Hungerbühler K, McRae GJ (2001): Multiobjective screening and evaluation of chemical process technologies. Ind Eng Chem Res 40, 4513–4524
[4] Hoffmann VH, McRae GJ, Hungerbühler K (2004): Methodology for Early-Stage Technology Assessment and Decision Making under Un-certainty: Application to the Selection of Chemical Processes. Ind Eng Chem Res 43, 4337–4349
[5] Hirao M (2002): Integration of Product and Process Life Cycles for Environmentally Conscious Process Design. Proceedings of PSE Asia 2002, Taipei
[6] Fukushima Y, Hirao M (2002): A structured framework and language for scenario-based Life Cycle Assessment. Int J LCA 7, 317–329 [7] Shimada M, Miyamoto K, Fukushima Y, Hirao M (2000): Lifecycle
Modeling for Dynamic LCA. Proceedings of the 4th International Con-ference on EcoBalance, Tsukuba, Japan, pp 165–168
[8] Miyamoto K, Shimada M, Fukushima Y, Hirao M (2000): Lifecycle analysis of time-dependent scenario for competing products made of different materials. Proceedings of the 4th International Conference on EcoBalance, Tsukuba, Japan, pp 161–164
[9] Van Beukering PJH, Janssen MA (2001): A Dynamic Integrated Analysis of Truck Tires in Western Europe. J Ind Ecol 4 (2) 93–115
[10] Kandelaars PA, Van den Bergh JM (1997): Dynamic analysis of mate-rials-product chains: An application to window frames. Ecol Econom 22, 41–61
[11] ISO 14040 (1997): Environmental management – Life cycle assess-ment – Principles and framework. International Organisation of Stand-ardisation, Geneva, Switzerland
[12] Appl M (1976): A brief history of ammonia production from the early days to the present. Nitrogen 100, 47–58
[13] Lauriente DH (1999): Ammonia. In: Chemical Economics Handbook, SRI Consulting, Menlo Park CA, USA
[14] Anonymous (1962): Trends in Ammonia Manufacture. Nitrogen 16, 35–49
[15] Anonymous (1957): Natural gas in Canada. Sulphur 16, 26–29 [16] Anonymous (1965): Furnaces for Steam Reforming of Hydrocarbon
to Give Synthesis Gas. Nitrogen 36, 26–32
[17] Anonymous (1988): Reforming catalysts for the production of ammo-nia. Nitrogen 174, 23–34
[18] Anonymous (1959): The Texaco-Casale Ammonia process. Nitrogen 1, 23–26
[19] Anonymous (1962): Hydrogen and Synthesis Gases by Continuous Catalytic Reforming. Nitrogen 18, 24–32
[20] Slack AV, James GR (1974): Ammonia. Marcel Dekker, New York, USA [21] Appl M (1992): Modern ammonia technology: Where have we got to,
where are we going? Nitrogen 200, 27–38
[22] Appl M (1993): Modern ammonia technology: Where have we got to, where are we going? Nitrogen 202, 44–53
[23] Anonymous (1965): Monsanto's News 600 s. Tons p.d. Ammonia Plant Medium. Nitrogen 36, 34–35
[24] Anonymous (1968): Large Ammonia Plants. Nitrogen 51, 21–25 [25] Anonymous (1964): I.C.I. Catalyst 35-4 for Ammonia Synthesis.
Ni-trogen 28, 30–32
[26] Anonymous (1964): Pressure Holds Key to Kellogg Process for Am-monia Synthesis Gas. Nitrogen 29, 32
[27] Low G (1984): Revamping Ammonia Plants. Supplement to Nitrogen 147 [28] Houken J (1984): Aspects of 25 years of catalyst progress. Nitrogen
152, 91–93
[29] Anonymous (1968): Compressors for Ammonia Synthesis. Nitrogen 55, 37–38
[30] Anonymous (1987): LTS catalysts. Nitrogen 168, 29–37
[31] Anonymous (1989): Removing the carbon oxides from ammonia syn-thesis gas. Nitrogen 180, 20–30
[32 Buckthorp CM (1978): Ammonia plant productivity boosted by selec-tive CO oxidation. Nitrogen 113, 34–39
[33] Eickmeyer AG (1958): Method for purification of carbon dioxide. US Patent # 2842941
[34] Eickmeyer AG (1960): Method for separation of fluid gases. US Patent # 2944966
[35] Eickmeyer AG (1961): Process for production of sulfur from sour gas. US Patent # 2994588
[36] Eickmeyer AG (1974): Method for removing acid gases from gaseous mixtures. US Patent # 2994588
[38] Hohl A, Miller FE (1960): Process for carbon dioxide absorption. US Patent # 2926753
[39] Giammarco G (1962): Process for separating and recovering carbon dioxide from gaseous mixtures. US Patent # 3037844
[40] Field JH, Benson EH (1959): Method for separating CO2 and H2S from gas mixtures. US Patent # 2886405
[41] Wagner E (1985): Removal of CO2 and H2S from natural gases. US
Patent # 4537753
[42] Wagner E (1991): Removal of CO2 and H2S from natural gases. US
Patent # 4997630
[43] Stokes KJ (1980): The Economics of CO2 Removal in Ammonia Plants.
Ammonia Plant Safety 22, 178–184
[44] Stokes KJ (1981): Choosing an ammonia plant CO2 removal system for today's conditions. Nitrogen 131, 35–38
[45] Anonymous (1961): I.C.I. Improved Catalyst for Ammonia Produc-tion. Nitrogen 14, 28
[46] Anonymous (1991): Improvements in ammonia synthesis catalyst. Ni-trogen 193, 17–31
[47] Karsch D (1965): High-pressure Steam Production in exothermic Cata-lytic Processes. Nitrogen 37, 21–25
[48] Manen A (2002): Technology assessment of the ammonia production. Trabajo Final de Carrera, Instituto Químico de Sarrià, Barcelona, Spain [49] Anonymous (1982): The design of ammonia converters. Nitrogen 140,
30–37
[50] Anonymous (1984): Ammonia Casale, once again at the heart of am-monia production. Nitrogen 152, 130–131
[51] Anonymous (1979): Pressure Swing Adsorption. Nitrogen 121, 37–43 [52] Finn A (1988): Cryogenic purge gas recovery boosts ammonia plant
productivity and efficiency. Nitrogen 175, 25–32
[53] Silberring L (1979): Ammonia plant steam systems. Nitrogen 120, 35–41 [54] Medici M (1974): The Natural Gas Industry: a Review of World
Re-sources and Industrial Applications. Butterworth, London
[55] Katz DL (1959): Handbook of Natural Gas Engineering. New York, McGraw-Hill
[56] Adelman MA (1997): My education in mineral (especially oil) eco-nomics. Annu Rev Energy Environ 22, 13–46
[57] US Environmental Protection Agency (EPA) (1999): U.S. Methane Emis-sions 1990–2020: Inventories, Projections and Opportunities for Re-ductions. Washington DC, USA
[58] Alpert SB (1991): Clean Coal Technology And Advanced Coal-Based Power Plants. Annu Rev Energy Environ 16, 1–23
[59] Rose A, Torries T, Labys W (1991): Clean Coal Technologies And Fu-ture Prospects For Coal. Annu Rev Energy Environ 16, 59–90 [60] Rogers G (1990): The clean air act of 1970. EPA Journal 1, 21–23 [61] US Congress (1955): Air Pollution Control Act. P.L. 84–159 [62] US Congress (1963): Clean Air Act Amendments. P.L. 88–206 [63] US Congress (1965): Motor Vehicle Air Pollution Control Act. P.L.
89–272, title I
[64] US Congress (1966): Clean Air Act Amendments of 1966. P.L. 89–675 [65] US Congress (1967): Air Quality Act of 1967. P.L. 90–148
[66] US Congress (1970): Clean Air Act Amendments of 1970. P.L. 91–604 [67] US Congress (1977): Clean Air Act Amendments of 1977. P.L. 95–95 [68] US Congress (1990): Clean Air Act Amendments of 1990. P.L. 101–549 [69] Pré Consultants (2002): Oil industrial furnace Archive-06684500207.
Sima Pro 5.0 Database, Amerstfoort, The Netherlands
[70] Pré Consultants (2002): Coal industrial furnace Archive-06684500210. Sima Pro 5.0 Database, Amerstfoort, The Netherlands
[71] Pré Consultants (2002): Gas industrial furnace Archive-06684500195. Sima Pro 5.0 Database, Amerstfoort, The Netherlands
[72] Pré Consultants (2001): Natural Gas combustion. Netherlands Agency for Energy and Environment, The Netherlands
[73] Pré Consultants (2002): Heat from oil BUWAL25006555300005. Sima Pro 5.0 Database, Amerstfoort, The Netherlands
[74] Pré Consultants (2002): Heat from coal BUWAL25006555300001. Sima Pro 5.0 Database, Amerstfoort, The Netherlands
[75] Pré Consultants (2002): Natural gas high pressure Europe ETH3DATA 07088900467. Sima Pro 5.0 Database, Amerstfoort, The Netherlands [76] US Department of Energy (DOE) (2001): Environmental Benefits of
Clean Coal Technologies. Topical report number 18
[77] Althaus H-J, Chudacoff M, Hellweg S, Hischier R, Jungbluth N, Osses M, Primas A (2004): Life Cycle Inventories of Chemicals. ecoinvent report No. 8. Swiss Centre for Life Cycle Inventories, Dübendorf, Switzerland
Received: February 18th, 2005 Accepted: August 5th, 2005 OnlineFirst: August 6th, 2005