© by Oldenbourg Wissenschaftsverlag, München
Heterogeneous Chemistry of Cl
2O and HOCl on
Frozen Natural Sea Salt, Recrystallized Sea
Salt, KCl and NaCl Solutions at 200 and 215 K
By Pascal Pratte and Michel J. Rossi*Ecole Polytechnique Fédérale de Lausanne (EPFL), Laboratoire de Pollution Atmosphérique et sol (LPAS), Station 6, CH-1015 Lausanne, Switzerland
Dedicated to Prof. Dr. Reinhard Zellner on the occasion of his 65thbirthday (Received December 11, 2009; accepted March 21, 2010)
Heterogeneous Chemistry. Sea Salt . Cl2O. HOCl
The HOCl heterogeneous reaction on frozen natural (NSS) and recrystallized (RSS) sea salt, KCl and NaCl solutions was studied using a low pressure flow reactor in order to measure the uptake coefficientγ and products of reaction. The HOCl sample used in these experiments always contained up to 25% Cl2O which was also studied separately as a pure gas in order to
understand the heterogeneous chemistry of both gases. By performing HOCl uptake on frozen NSS solution at 200 K and a gas-phase residence time of (1.6±0.6) s we obtained a steady state uptake coefficientγHOCl on NSS= (2.5±0.7)!10K3andγCl2O on NSS= (2.8±0.8)!10K3. On frozen
KCl solution at 200 K we obtainγHOCl on KCl= (2.8±1.3)!10K3, identical to NSS, andγCl2O on KCl= (4.6±0.8)!10K4. The main product formed during the uptake on frozen NSS solution is
Cl2 which is sustained for at least one hour. In contrast, only a transient Cl2 flow (pulse)
decreasing on the time scale of 100 s was observed on frozen KCl (NaCl) solution. 25±10 % of the HOCl taken up on all chloride-containing frozen substrates at 200 K react to produce Cl2at high HOCl concentration (4.5!1011molecule cmK3) and at a residence time of 1.6 s in
comparison with twice that for Cl2O. For smaller concentrations such as [HOCl] =
3.7!1010molecule cmK3and.or a shorter residence time (0.137±0.004s), HOCl uptake did not generate Cl2in contrast to Cl2O. A single Br2burst event was monitored when a Cl2O or
HOCl.Cl2O mixture is taken up on fresh frozen NSS solution during the first uptake at 200 K.
Further Cl2O or HOCl.Cl2O uptake on the same sample, even after annealing at 240 K does
not show an additional Br2 pulse. This Br2 release may be significant in the autocatalytic
ozone destruction mechanism in the troposphere during polar sunrise. Some of the atmospheric implications of the present results are highlighted with emphasis on the preequilibrium Cl2O(ads) + H2O(ice) $ 2 HOCl(ads) between adsorbed HOCl and Cl2O, with the latter being
the gateway to reactive uptake of HOCl at low temperatures.
* Present address: Paul Scherrer Institut (PSI), Laboratorium für Atmosphärenchemie (LAC), OFLA008, CH-5232 Villigen PSI, Switzerland; E-mail: michel.rossi@epfl.ch.
1. Introduction
Essentially complete ozone loss is frequently observed in the boundary layer of the Arctic in the springtime [1]. Field measurements revealed that the ozone concentration decreases by approximately a factor of ten in a few hours [1] which seems to be correlated to a local maximum of [BrO] during sunrise [2– 4]. This event has been called polar sunrise chemistry and has been associated with the presence of bromine containing species collected on filters. This sug-gests that bromine-containing species such as Br, HBr and HOBr play a leading role in the mechanisms of O3destruction. Moreover, there is experimental
evi-dence from the field that chlorine atom concentrations are also elevated during these ozone-depletion periods owing to the observed chlorination of naturally occurring hydrocarbons that is consistent with the presence of an important ma-rine halogen source [5]. Recent experimental results have confirmed the presence of Br and Cl precursor concentrations on the tens to hundreds of ppt level such as Br2[6,7], BrCl [6], HOBr, Cl2 and HOCl [7]. Therefore, the search for an
explanation of the underpinning chemical mechanism has focussed on catalytic cycles of Br which is well known from studies of global and polar stratospheric ozone depletion and is displayed in reactions (1) to (3):
Br2+ hν/2Br (1)
Br + O3/BrO + O2 (2)
2 BrO/Br2+ O2 (3)
Owing to the extremely short time scale of ozone destruction in polar sunrise chemistry the search for a mechanism has focussed on autocatalytic processes that include a degenerate chain branching step and are similar to combustion or explosion of hydrocarbon fuels, hence the alternative term “bromine explosion” for the description of polar sunrise chemistry. An autocatalytic process is one where one or more of the resulting reaction products are catalysts for the reaction under study in contrast to a case where a catalyst is added externally. A number of possible chemical reactions listed in reactions (4) to (7) including photochem-istry involving aqueous sea salt (marine aerosol) [8,9] or frozen sea salt solution [10] have been proposed in order to explain the extremely short time scale of ozone loss, the chlorination of hydrocarbons and the postulated high halogen free radical concentration in the polar region which can attain values of up to 105Cl•cmK3[11,12]. HOBr + ClK /BrCl +OHK (4) HOBr + BrK /Br2+ OH K (5) HOCl + BrK /BrCl + OHK (6)
BrCl + hν/Br•+ Cl• (7) During polar sunrise, a significant part of Br2, Cl2and BrCl may be generated
by heterogeneous chemistry of HOCl and HOBr which are mainly formed from the homogeneous gas phase reaction of OH and XO (X = Cl, Br) radicals, reac-tion (8):
HO2 •
+ XO•/HOX + O2 (8)
The formation of HOX (X = Cl, Br) compounds contributes therefore to-wards a temporary reservoir of halogen compounds activated by their heteroge-neous reactions on sea salt aerosol and.or frozen sea salt according to reactions (4) and (5) [11–13].
The autocatalytic nature stems from the fact that one Br atom, once reacted to HOBr following reaction (8), is able to volatilise marine bromide from sea spray aerosols or from frozen sea salt following reaction (5) and thereby form two potentially active Br atoms after photolysis of the precursor Br2. It is the
catalyst and needs to be present in only minute concentrations. This amounts to degenerate chain branching afforded by a heterogeneous reaction and continues until the BrO concentration is sufficiently high such that the catalytic cycle (reac-tions (1) to (3)) will take over. The rate determining step of the autocatalytic mechanism is the formation of HOBr in reaction (8) and is superseded by reac-tion (3) once the reacreac-tion has switched from autocatalytic to catalytic. The mech-anistic investigations have mainly focussed on the role of Br rather than Cl because of faster heterogeneous reaction rates of HOBr [14]. In addition, there are potential complications with HOCl because it is unstable with respect to its anhydride Cl2O which is also reactive with marine halides XKas shown below.
Sea salt deposited on the polar snow pack may contribute to the conversion of halogen reservoir molecules to reactive species by heterogeneous processes that deplete the ice.salt surface. This process competes with similar heterogene-ous reactions that involve deliquescent sea salt aerosols. Only when the heteroge-neous reactions (4) and (5) of HOBr on ice and snow are included does the simulation of tropospheric ozone destruction agree with field measurements through halogen activation [15]. However, only few data are available for HOCl heterogeneous reactions on marine aerosol and sea ice in comparison to uptake experiments of HOBr or HOCl performed on solid substrates [16–20].
It was suggested that HOCl could be an important temporary reservoir for chlorine in the marine boundary layer because it reacts very slowly with ozone (kII< 4.0!10K16cm3moleculeK1sK1) [21] and does not react with hydrocar-bons. Despite the fact that HOCl has never been measured in the dark winter season in the polar boundary layer, it may in principle be formed by radical recombination (8) [22]. The absorption coefficient of HOCl is given in the litera-ture [23,24] within the critical 300–380 nm wavelength region and leads to a photolysis lifetime of less than one hour using the measured photodissociation rate constant at the surface of the earth. This short lifetime suggests that HOCl
is an ineffective chlorine reservoir under solar radiation but in turn could be effective in the arctic region during the winter season in the absence of actinic radiation.
Huff and Abbatt performed uptake experiments of HOCl(g) in a laminar low pressure flow reactor in which the walls were coated with a frozen NaCl solution at 233 K [25]. They used [HOCl] = 3!1012 cmK3 at a total pressure of He between 1 and 2 Torr and concluded that HOCl is unreactive on frozen sea salt. We took this work as a starting point of the present contribution towards the knowledge of heterogeneous reactions of HOCl which has not been as thor-oughly investigated as HOBr owing to the fact that the role of HOCl in polar sunrise chemistry is less clear than for HOBr. In addition, the equilibrium be-tween HOCl and Cl2O, the latter of which is currently of no atmospheric interest,
and the anticipated reactivity of both components on liquid and frozen halide solutions make this a chemical system that we wished to investigate further. The observational evidence for HOCl is fairly weak for the troposphere, however, it has been unambiguously identified in the middle and lower stratosphere in satel-lite IR and FIR spectrometry [26]. Recently, the rate constant of reaction (8) has come under debate in the interest of obtaining a satisfactory fit to HOCl profiles obtained by satellite measurements [26].
We present here kinetic results of HOCl uptake mainly on frozen KCl and natural sea salt (NSS) solutions at 200 and 215 K that are in the range of relevant temperatures during the polar winter in the MBL. In addition, the products of reaction released into the gas-phase were monitored in order to quantify the rate at which gas-phase HOCl is converted to Cl2, the precursor for chlorination of
naturally occurring hydrocarbons. We also focussed on differences between HOCl uptake coefficients measured on frozen KCl, recrystallised sea salt (RSS) and natural sea salt (NSS) solutions as well as products formed. In addition, we tested the role of acidity for the formation of products both on NSS and KCl frozen solution.
2. Experimental setup
Experiments were performed in a Teflon-coated low pressure flow reactor that is suited for the measurement of heterogeneous process. A detailed description of this technique has been given elsewhere [28]. Briefly, the Knudsen flow reac-tor is mounted on a differentially pumped high vacuum chamber equipped with a cryogenic and a turbomolecular pump. A given number of molecules are in-jected into the reactor by a glass capillary inlet before effusing out of the escape orifice after a lifetimeτ (1.kesc (sK1) with kescbeing the measured escape rate
constant .sK1) to form a modulated (thermal) molecular beam by a rotating chopper located in the upper chamber. The quadrupole mass spectrometer signal is then processed by a digital lock-in amplifier in order to separate the contribu-tion of the molecular beam from the background gas phase.
Table 1. Escape rate constants kescof HOCl, Cl2and Cl2O measured at 300 K and typical gas
concentrations [G] for the 4 and the 14 mm diameter escape aperture. kesc(±0.2 sK1). [G]!1011molecule cmK3
Escape aper- HOCl Cl2 Cl2O
ture (mm)
4 0.6. 4.5 0.5. 0.4. 2.7
14 7.3. 0.37 6.3. 5.7. 0.19
In order to measure the uptake coefficientγ(HOCl,Cl2O) on the frozen
sub-strates we quantitatively measured the HOCl and the Cl2O molecules that have
been taken up as a function of time. To this end, steady state experiments were performed in the low pressure flow reactor using concentrations ranging from 1010to 1012molecule cmK3. An initial flow rate Fin(molecule sK1) is admitted
into the reactor and after a short transition time, the effusive flow rate Foutequals
the incoming flow rate Fin if no chemical loss is admitted, that is when the
sample compartment is isolated from the inflow. The residence time τ and the gas concentration may be varied by changing either the flow or the size of the escape orifice. When the sample compartment is open to the flow, part of the gas is lost on the substrate resulting in a competition between the escape rate (kescN, with N being the total number of gas molecules in the reactor) and the
rate of loss (klossN). At steady state we obtain the following balance: dN
dt = FinKNkescKNkloss= 0 (9)
Rearrangement of equation (9) leads to equation (10) which relates the ratio Fin.Foutto the escape rate constant kescand results in the heterogeneous loss rate
constant kloss: kloss= (
Fin
FoutK1)kesc (10)
Commonly, we used a normalised form of kloss, namely the uptake coefficient
γ that expresses the probability that a molecule colliding with a surface is cap-tured. We definedγ simply by the first order loss rate constant klossdivided by
the frequency of collisionω in sK1. In addition, kescwas measured by monitoring
the exponential decay rate of the MS signal by halting Fin in the absence of
substrate. The escape rates kescwere measured for the different escape apertures,
namely for the 4 and 14 mm diameter orifices (Table 1). The concentration of a gas G was calculated by using the initial flow rate Fin and the measured kesc
using the expression [G] = Fin.Vkescwith values summarized in Table 1. HOCl,
Cl2O, Cl2and Br2were monitored at m.e 52, 51, 70 and 160, respectively. 2.1 Sample preparation
Three types of salt samples were used, namely KCl (NaCl) (Fluka, purity > 99.5%), recrystallized sea salt RSS (Hawaiian Salt, Honolulu, PA AKAI INC.)
and NSS (sel de Guérande, DIEPAL-NSA) which is a natural non-processed sea salt obtained by pan evaporation (open air). Solutions of KCl (NaCl), NSS and RSS were made from the dissolution of salts in bidistilled water (35g.L) and subsequent filtration in order to mimic the salt concentration of sea water [29]. The salt solutions were degassed in a vacuum line by performing two freeze-pump-thaw cycles before pouring the salt solution, typically 5 ml, into the gold coated copper cryogenic support that is described elsewhere [30]. Subsequently, the temperature of the salt solution was decreased at a rate of 0.2 K sK1down to 200 or 215 K in order to produce frozen sea salt [27]. All frozen solutions were cooled down following the same procedure. In fact, different ice prepara-tion methods led to different uptake kinetics in the past [31]. It is known that the cooling rate affects the halide distribution in the bulk and on the surface of ice [32]. If the freezing rate is slow bulk ice will concentrate most of the salt on the substrate surface by segregation processes. However, in an atmospheric con-text sea water freezes too quickly to allow segregation of halide from the bulk. In some cases, KCl (NaCl) solutions were acidified using a commercial buffered solution containing 0.068 M NaOH, 0.056 M citric acid and 0.044 M NaCl to buffer the frozen salt solution at pH = 4 in order to study the effect of acidity on the rate of Cl2formation.
2.2 HOCl and Cl2O synthesis
Cl2 was admitted to a vessel containing HgO powder (Fluka, puriss > 99.0%)
held at 77 K which was kept for 24 hours at 190 K to allow the following reaction to occur:
HgO(s)+2Cl2(g)/Cl2O(g)+HgCl2(s) (11)
Cl2O, absorbing atλ < 700 nm, was transferred to a trap containing
approxi-mately 2 ml of frozen bidistilled water at 77 K that was subsequently warmed in a water bath to ambient temperature. The cherry-colored Cl2O liquid reacts
with liquid water to produce HOCl(l) upon Cl2O hydrolysis according to reaction
(12).
Cl2O(l) + H2O(l)$2 HOCl(l) (12)
The HOCl sample was kept at 190 K as a stock solution for further use.
2.3 Calibration procedure
Because HOCl is in equilibrium (12) with Cl2O, increasing concentrations of
HOCl will shift the equilibrium towards Cl2O under static conditions. In order
to limit the formation of Cl2O, we pumped on the sample in order to lower the
total pressure. Even under those non-equilibrium conditions 25±10 % of Cl2O
remained in the HOCl sample. At these experimental conditions the flow rate measurement of HOCl into the flow reactor (Fin(HOCl)) could not be performed
by observing the pressure drop in the calibrated volume because the pressure in the vacuum line is under 50 mTorr which is too small for a reliable pressure measurement using an absolute Baratron gauge (MKS Baratron 122AA-00010AB). In order to calibrate the MS signal for HOCl, a titration was per-formed on a vapor-deposited ice substrate. In contrast, the impurity Cl2O has
been calibrated in the usual way by measuring its pressure drop in a calibrated volume as described in the literature [31]. In order to enable the titration of HOCl, Bulk (B) ice was prepared at 200 K in the cryogenic support device [30]. Subsequently, we deposited an amount of HCl on B ice in excess over HOCl before isolating the sample by sealing off the sample compartment. The HOCl source was held at 197±1 K under differential pumping conditions by using a roughing pump protected by a cold trap. A steady-state flow of HOCl was estab-lished into the flow reactor and was allowed to react with the HCl.ice sample. The gas phase HOCl and the Cl2O impurity are titrated by excess adsorbed HCl
following reactions (13) and (14):
Cl2O(g) + HCl(ads)/Cl2(g) + HOCl(ads) (13)
HOCl(g) + HCl(ads)/H2O(ads) + Cl2(g) (14)
Cl2O(g) + 2HCl(ads)/2Cl2(g) + H2O(ads)
The same titration procedure was performed for pure Cl2O. This leads to the
conclusion that for each Cl2O taken up, two Cl2were released to the gas phase.
In addition, we believe that HOCl(ads) generated in reaction (13) is converted to Cl2(g) in reaction (14). By using these reactions for the titration of the HOCl.
Cl2O mixture, the calibration constant for HOCl is given by equation (15).
Kcal (HOCl) = Kcal (Cl2)I(Cl2)K2K cal (Cl2O)I(Cl2O) I(HOCl) (15) where I(X) and Kcal(X) are the measured MS signal and the calibration constant
for the molecule X (X = Cl2, Cl2O, HOCl), respectively. The absolute calibration
for the Cl2mass signal was obtained from authentic samples of pure Cl2.
3. Results and discussion on Cl
2O and HOCl uptake
3.1 Uptake kinetics of HOCl and pure Cl2O on bulk ice at 200 KThe HOCl sample used in the present work inevitably contains up to 25% Cl2O
following equation (12). It is likely that the Cl2O “impurity” in HOCl does
not correspond to the equilibrium fraction because the mixture was not let to equilibration under the used experimental conditions. Consequently, we need to take into account the presence of Cl2O by performing uptake experiments of pure
the uptake experiment of the HOCl.Cl2O mixture. Before performing uptake
experiments on the frozen salt solution, we have studied the uptake of pure Cl2O
and the HOCl.Cl2O mixture on bulk (B) ice from frozen liquid water [31].
The uptake coefficient γ for the HOCl.Cl2O mixture on bulk ice is
γss(HOCl) = (5.5±0.4)!10K4andγss(Cl2O) = (5.3±0.6)!10K4, respectively. For
uptake of pure Cl2O, we obtainγss(Cl2O) = (2.8±0.7)!10K4, lower by a factor
of two compared to the mixture. These results directly follow from displays in Figures 9 and 10 (see Appendix). These uptake experiments show that γss for
each component of the HOCl.Cl2O mixture is similar while pure Cl2O uptake
results in a γss value smaller by a factor of two compared to the simultaneous
measurement ofγss(Cl2O) andγss(HOCl). It seems that Cl2O uptake on pure B
ice is accelerated by HOCl, perhaps by hydrogen bonding owing to the presence of adsorbed HOCl.
In addition, we note (Figure 9) that no product was formed for the HOCl. Cl2O mixture at 200 K. Conversely, in the case of pure Cl2O uptake, slow HOCl
formation and Cl2O decomposition to Cl2 occurred (Figure 10) as displayed in
equations (16) and (17):
Cl2O/Cl2+ ½ O2 (heterogeneous decomposition) (16)
H2O + Cl2O/2HOCl (heterogeneous hydrolysis) (17)
This shows that HOCl and Cl2O are not rapidly converted to Cl2on pure B
ice at 200 K. These reference experiments performed on Bulk (B) ice enable the comparison of the conversion efficiency of HOCl and Cl2O to Cl2on frozen salt
solutions performed under the same conditions. The chosen HOCl and Cl2O
concentrations are high in order to enable observation of the possible formation of Cl2, namely 4.5!1011 and 1.5!1011 molecule cmK3, respectively. In the
absence of any major product formation we conclude that the uptake of both HOCl and Cl2O is non-reactive and leads to adsorption of both gases on the
surface of ice. Without investigation of the condensed phase we are unable to state on the possible inverse of reaction (12) upon HOCl adsorption.
3.2 Pure Cl2O uptake on frozen KCl and NSS solution at [Cl2O] > 1011molecule cm−3
Figure 1a (upper left panel) displays a Cl2O uptake experiment on frozen KCl
solution as a function of time using [Cl2O] = 2.3!1011 molecule cmK3
corre-sponding to Fin(Cl2O) = 1.7!1014molecule sK1. This is similar to the
concentra-tion of the Cl2O impurity found in the used HOCl.Cl2O mixture. When the
frozen KCl solution is exposed to Cl2O at t = 80 s, a transient production of Cl2
is observed that is accompanied by a continuous production of HOCl reaching a steady state level at t = 400 s. In contrast, the Cl2production is decreasing to a
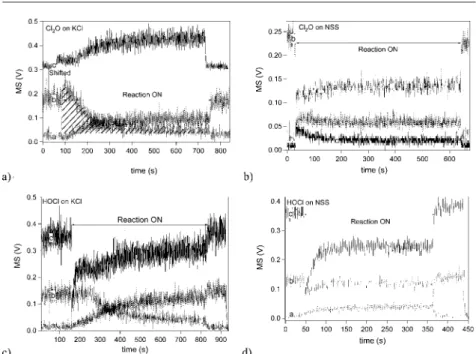
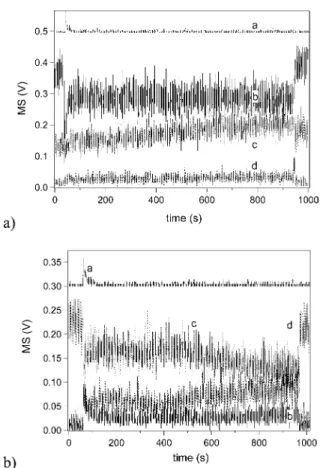
Fig. 1. a) and b) represent Cl2O uptake performed on frozen KCl and NSS solution, respectively,
at 200 K and using the 4 mm diameter escape aperture. c) and d) represent HOCl uptakes performed on frozen KCl and NSS solution, respectively. The dotted line (trace a) represents Cl2, the hashed curve is Cl2O (trace b) and the solid curve is the HOCl (trace c) MS signal. In
a) FCl2O= (1.7±0.4)!1014, in c) FHOCl= 7.6!1014and FCl2O= 1.9!1014molecule sK1. In b)
FCl2O= (1.9±0.5)!1014and in d) FHOCl= (9.0±0.3)!1014and FCl2O= (2.1±0.5)!1014
mole-cule sK1.
low steady state level after the primary burst, presumably because of the accumu-lation of OH¯ on the surface according to reactions (12), (18) and (19):
Cl2O(g) + H2O(ads)$2 HOCl(ads) (12)
HOCl(ads)+ClK +M+/Cl2(g)+M++OHK(M+= Na+,K+,Ca++,…) (18) Cl2O(g) + Cl K /ClOK + Cl2(g) (19)
Uptake experiments of pure Cl2O were also performed on frozen NSS
solu-tion at 200 K for which a typical uptake is shown in Figure 1Ib for [Cl2O] given
in Table 1. At t = 30 s, the plunger is lifted and the substrate exposed to Cl2O
which leads to steady state formation of Cl2accompanied by slow formation of
HOCl. This steady state formation of Cl2displayed in Figure 1b is in contrast to
the corresponding uptake of Cl2O performed on KCl frozen solution (Figure 1a).
Cl2O uptake was also performed on frozen NaCl and RSS solution which show
solution. This is in contrast to uptake of Cl2O on NSS that is characterized by
sustained formation of Cl2and slow formation of HOCl. The major difference
between NSS and RSS frozen solution is that NSS contains fatty acids, polyfunc-tional partially oxidized organics or humic acid-like substances (HULIS) [33] that may affect the formation of Cl2. We believe that NSS is sufficiently
inter-nally buffered to be able to neutralize the resulting hydroxyl ion in reaction (18) so as to support a sustainable formation of Cl2. In contrast, the formation of Cl2
comes to a halt in unbuffered frozen solutions such as KCl and RSS because the halide displacement resulting in Cl2is a general acid catalyzed reaction requiring
the presence of HOCl rather than ClOK. Alternatively, NSS may contain organic
matter that is easily oxidized by either HOCl or Cl2O thereby reducing the
chlo-rine to Cl2.
3.3 Mass balance for pure Cl2O uptake
After each uptake experiment, the substrate is isolated from the reactive gas in order to halt the reaction and measure the flow rate. The area of the MS signal corresponding to the reactant lost or product formed was evaluated and leads to the number of molecules taken up or produced during the reaction. As an exam-ple, the dashed area in Figure 1a corresponds to the yield of Cl2 on the time
scale of the experiment. After the experiment, the surface was annealed at 240 K in order to measure desorbed products at 240 K.
The mass balance from Figure 1a between Cl2O uptake on frozen KCl
solu-tion and product formasolu-tion may be expressed as follows: 7.3!1016Cl2O
mole-cules were taken up against production of 8.4!1016 HOCl and
4.9!1016 Cl2 molecules produced (see Table 5). After uptake, the frozen
solu-tion was annealed at 240 K resulting in the desorpsolu-tion of 1.6!1015Cl2O
corre-sponding to approximately 2% of the total Cl2O initially taken up. However,
an important fraction of adsorbed HOCl is collected during thermal desorption corresponding to 2!1016 molecules. During thermal desorption, no Cl2 was
measured even if the plunger was lowered for 20 minutes in order to let the frozen film react. Consequently, no delayed Cl2 production is observed in the
isolated sample compartment.
The mass balance expressed per chlorine atom is established including the products of desorption listed in Table 5 for Cl2O uptake according to equation
(20) where the brackets correspond to molar yields:
2!(Cl2Otaken up) = HOClproduced+ HOCldesorbed+ 2!(Cl2Odesorbed) + (Cl2)produced
(20) In equation (20), we assume that for each Cl2produced, one Cl•came from
the Cl2O source while the second Cl• was contributed as halide from the salt
substrate surface.
The chlorine mass balance displayed in Table 5 between Cl dosed and recov-ered is excellent, namely 1.46!1017Cl dosed vs. 1.56!1017Cl recovered. This
means that all chlorine deposited is recovered from the KCl frozen solution held at 200 K for initial [Cl2O] > 1!1011 molecule cmK3. The data taken from
Figure 1a and Table 5 reveal that 4.9!1016 Cl2 were produced which means
that 4.9!1016surface (or near-surface) chloride ions were consumed. The ratio of the surface ClKto the total chlorine taken up is 4.9!1016.2!0.73!1017=
0.33±005 which means that 33% of the deposited Cl from Cl2O react with ClK
at the substrate interface on frozen KCl solution at 200 K for [Cl2O] > 1011
mole-cule cmK3(see Table 5, next to last column).
The same mass balance check was performed for pure Cl2O uptake at 200 K
on NSS frozen solution and again leads to excellent agreement between depos-ited and recovered chlorine as displayed in Table 5 as well. As an example, data on Cl2O uptake on NSS frozen solution at 200 K for [Cl2O] > 1011
mole-cule cmK3, displayed in Figure 1b are summarized in Table 5. In Figure 1b, 1.41!1017Cl2O were taken up whereas 0.97!1016 HOCl and 1.96!1017 Cl2
were generated. Thermal desorption led to 3.7!1015Cl2O and 7!1016 HOCl.
Using equation (20) we obtain excellent agreement between dosed and recovered chlorine (2.82!1017 vs. 2.83!1017 molecule). The ratio of the unreacted to dosed Cl2O is approximately 2.5%, and approximately 70±7 % of the deposited
chlorine reacts with surface ClK
. We note an important relative increase in sur-face reactivity of ClKto Cl
2in going from frozen KCl to NSS solution at 200 K
for [Cl2O] > 1011molecule cmK3.
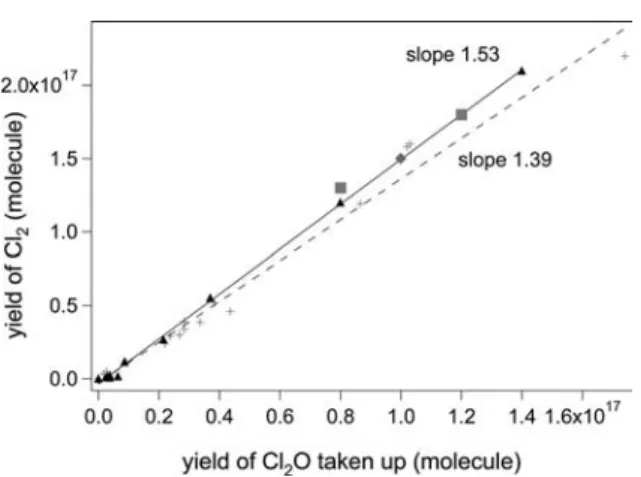
The yield of Cl2on frozen KCl and NSS solution was plotted in Figure 2 as
a function of Cl2O taken up for several experiments. Figure 2 shows that the
yield of Cl2per Cl2O taken up is larger on frozen NSS than on KCl solution at
200 K. As an example, 1!1017Cl2 have been produced on NSS compared to
0.3!1017 on KCl, NaCl and RSS frozen solution for 1!1017 Cl2O taken up.
This difference in slope is consistent with the fast rate of formation of Cl2and
the slow rate of formation of HOCl as displayed in Figure 1b. It results in a slope of 1.11±0.30 displayed in Figure 2. In contrast, the experiment displayed in Figure 1a shows a slow rate of formation of Cl2and a fast rate of formation
of HOCl resulting in a slope of 0.40±0.11 in Figure 2, a factor of 2.8 lower than NSS. Apparently, the rates of formation of Cl2by surface halogen exchange with
chloride and formation of HOCl by hydrolysis are competing against each other in Cl2O uptake at 200 K. The predominant formation of Cl2from pure Cl2O on
frozen NSS may be either explained by oxidation of organic matter and concomi-tant reduction of Cl2O or by predominant reverse disproportionation (or halogen
exchange). Hydrolysis of Cl2O resulting in HOCl is apparently not competitive
and therefore represents the minority channel on NSS. In contrast, on frozen KCl salt solutions the competitive situation is reversed with the hydrolysis channel
Fig. 2. Correlation between the yield of Cl2and Cl2O taken up. Uptake experiment of pure
Cl2O on frozen KCl (▲), NSS (+), NaCl (◆) and recrystallized RSS (■) solution at 200 K for
[Cl2O] = 2.7!1011molecule cmK3. Each point corresponds to a separate experiment and the
integration time is 700±50 s.
being dominant and the oxidation.reduction channel being outrun by hydrolysis, perhaps owing to the absence of organic matter in the KCl salt solution.
3.4 Uptake of the HOCl/Cl2O mixture on frozen KCl and NSS solution
The uptake of the HOCl.Cl2O mixture on frozen KCl and NSS solution has
been measured relative to pure Cl2O uptake. Figure 1c shows a typical uptake
experiment of a HOCl.Cl2O mixture on frozen KCl solution as a function of
time at 200 K for [HOCl] > 1011molecule cmK3. At t = 160 s, the plunger is lifted and a constant rate of formation of Cl2is observed to 250 s, after which
the Cl2 rate of formation decreases. In contrast, the uptake of a HOCl.Cl2O
mixture on frozen NSS solution reveals a continuous formation of Cl2 upon
lifting the plunger at t = 50 s (Figure 1d). The formation of Cl2remains constant
during more than one hour (data not shown). Repetitive uptake experiments of HOCl.Cl2O mixtures on fresh and poisoned frozen KCl solutions are displayed
in Figures 11a and 11b, respectively. It appears that the Cl2yield is smaller for
frozen KCl solution that has already been exposed to the HOCl.Cl2O mixture
compared to the fresh substrate. Furthermore, the Cl2O uptake (Figure 11a and
11b, trace (b)) saturates at 250 s for a poisoned substrate whereas it saturates after 400 s on a fresh frozen KCl solution. Despite the saturation of the Cl2O
uptake Cl2 formation is still on-going at F(Cl2) = 3!1013 molecule sK1. The
only possible source for the production of Cl2is therefore HOCl uptake from the
HOCl.Cl2O mixture at a flow rate of 1!1014molecule sK1. On a relative basis,
for ten HOCl taken up, three are converted to Cl2while seven stay adsorbed on
the substrate and will be recovered during thermal desorption at 240 K in mass balance experiments.
Fig. 3. Correlation between the yield of Cl2 and Cl2O taken up. Uptake experiment of the
HOCl.Cl2O mixture on frozen KCl solution (▲), NSS (+), NaCl (◆) and recrystallized sea
salt (■) at 200 K for [HOCl] = 4.5!1011molecule cmK3. Each point corresponds to a separate experiment and the integration time is 700±50 s.
Role of acidity on frozen KCl solution
In order to find out how acidity could affect the yield of Cl2formation, we have
performed uptakes of HOCl.Cl2O mixtures on buffered frozen KCl solutions at
200 K and pH = 4 for [HOCl] > 1011molecule cmK3as displayed in Figure 12. The formation of Cl2remains nearly constant during uptake of the HOCl.Cl2O
mixture on the buffered frozen KCl solution akin to neutral frozen NSS solution as shown in Figure 1d. In fact, the buffered solid allows the neutralisation of OHKproduced in reaction (18). Buffering is obviously not necessary for
sustain-ing Cl2 formation on frozen NSS solutions, presumably owing to their natural
buffering capacity. As long as acidity is available to neutralize OHK
(reaction (18)), it prevents the neutralization of HOCl that would accumulate non-reactive hypochlorite salts on the frozen KCl surface and thereby poison the surface with respect to further reaction of both HOCl and Cl2O.
Mass balance for the uptake of the HOCl.Cl2O mixture on frozen KCl and
NSS solution
The mass balance was also checked for the uptake of the HOCl.Cl2O mixture
on frozen KCl and NSS solution using equation (21):
2!(Cl2Otaken up) + (HOCltaken up) = (HOCldesorbed) + 2!(Cl2Odesorbed) + (Cl2)produced
(21) Taken as an example from Table 5, total chlorine taken up (1.17!1017 mole-cule) equals the recovered amount (1.14!1017molecule) for a frozen KCl
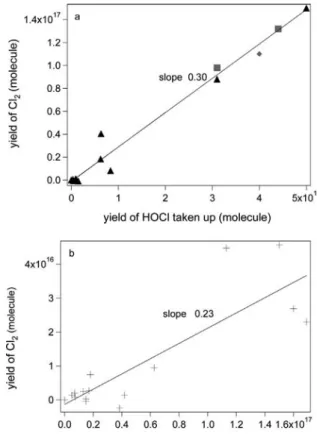
solu-Fig. 4. The fractional yield of Cl2generated from HOCl reacting at 200 K plotted as a function
of the HOCl taken up on frozen KCl (▲), NaCl (◆) and on recrystallized SS (■) after correction for Cl2production owing to Cl2O uptake following equation (22), (a). Similar experiments were
performed on frozen NSS solution for [HOCl] = 4.5!1011molecule cmK3, (b). Each point represents a new sample at different reaction times and at identical [HOCl]; the integration time is 700±50 s.
tion. The ratio between the surface ClK
estimated from the measured Cl2 and
the total chlorine deposited yields 0.50±0.06 which is larger by 50% (0.50. 0.33) compared to the value measured for pure Cl2O interacting with frozen KCl
solution, in agreement with Table 5.
The presence of HOCl apparently leads to an additional depletion of surface ClK. Consequently, the HOCl taken up could contribute to the formation of 50%
more Cl2with respect to uptake of Cl2O alone if we assume that Cl2O and HOCl
are both taken up independently. As will be pointed out below, this assumption may not be valid in the present case. Results displayed in Tables 2 to 4 reveal that the uptake kinetics of Cl2O is somewhat inhibited by the presence of HOCl
Table 2. Summary ofγ values for fresh, that is non-poisoned, frozen salt solution at 200 K using the 4 and 14 mm diameter escape aperture.
Fresh frozen salt solution KCl NSS
Formation of Slow for pure Cl2O uptake None for pure Cl2O uptake
HOCl
Formation of Transient for HOCl uptake and for Fast for HOCl and pure Cl2O uptake
Cl2 pure Cl2O uptake
Kinetics (γ) 4(mm) 4 14 4 14
HOCl.Cl2O mix- HOCl (1.2±0.5)!10K2 (8.3±2.5)!10K2 (1.6±0.5)!10K2 (5.4±1.6)!10K2
ture (Cl2O)0 HOCl (2.8±1.3)!10K3 (2.5±0.7)!10K2 (2.5±0.7)!10K3 (2.6±0.8)!10K2 (Cl2O)SS (Cl2O)0 (3.0±1.1)!10K2 (1.8±0.6)!10K1 (1.6±0.6)!10K2 (1.8±0.4)!10K1 (Cl2O)SS (4.6±0.8)!10K4 (1.1±0.3)!10K1 (1.8±0.9)!10K2 (1.6±0.6)!10K1 Pure Cl2O (Cl2O)0 (4.5±1.4)!10K2 (2.8±1.1)!10K1 (3.3±1.4)!10K2 (2.5±0.7)!10K1 (Cl2O)SS (4.7±1.2)!10K3 (1.4±0.5)!10K1 (2.8±0.8)!10K3 (2.3±0.6)!10K1
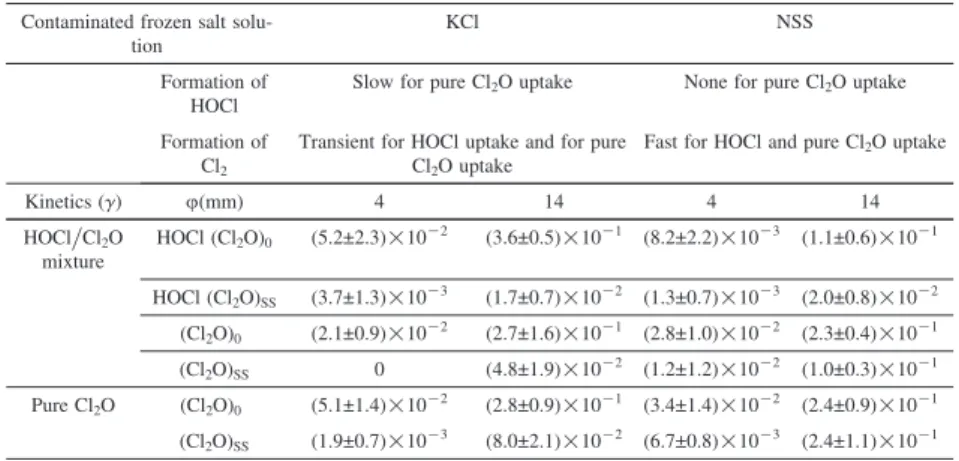
Table 3. Summary ofγ values for a poisoned (contaminated) frozen salt solution at 200 K using the 4 and 14 mm diameter escape aperture.
Contaminated frozen salt solu- KCl NSS
tion
Formation of Slow for pure Cl2O uptake None for pure Cl2O uptake
HOCl
Formation of Transient for HOCl uptake and for pure Fast for HOCl and pure Cl2O uptake
Cl2 Cl2O uptake Kinetics (γ) 4(mm) 4 14 4 14 HOCl.Cl2O HOCl (Cl2O)0 (5.2±2.3)!10K2 (3.6±0.5)!10K1 (8.2±2.2)!10K3 (1.1±0.6)!10K1 mixture HOCl (Cl2O)SS (3.7±1.3)!10K3 (1.7±0.7)!10K2 (1.3±0.7)!10K3 (2.0±0.8)!10K2 (Cl2O)0 (2.1±0.9)!10K2 (2.7±1.6)!10K1 (2.8±1.0)!10K2 (2.3±0.4)!10K1 (Cl2O)SS 0 (4.8±1.9)!10K2 (1.2±1.2)!10K2 (1.0±0.3)!10K1 Pure Cl2O (Cl2O)0 (5.1±1.4)!10K2 (2.8±0.9)!10K1 (3.4±1.4)!10K2 (2.4±0.9)!10K1 (Cl2O)SS (1.9±0.7)!10K3 (8.0±2.1)!10K2 (6.7±0.8)!10K3 (2.4±1.1)!10K1
which suggests a lower reactivity of HOCl on both frozen KCl as well as NSS solution compared to Cl2O.
For the frozen NSS solution we found that 20% of the produced Cl2
origi-nates from HOCl (0.85.0.70 = 1.21, see Table 5). This seemingly lower enhance-ment of Cl2production owing to the presence of HOCl for frozen NSS compared
to KCl solution stems from the fact that the uptake of pure Cl2O on frozen NSS
is already so important that it leaves no room for a large additional effect due to HOCl adsorption because of surface saturation of the uptake. In order to illustrate the yield difference of Cl2on frozen KCl and NSS solution upon uptake of the
HOCl.Cl2O mixture, we have plotted the yield of Cl2as a function of the Cl2O
taken up in Figure 3. We conclude that the Cl2 yield is marginally larger on
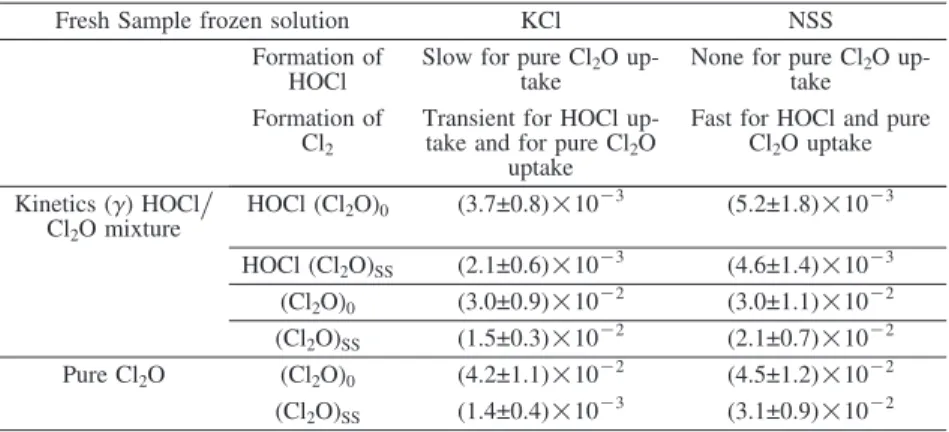
Table 4. Summary ofγ values for fresh frozen salt solutions at 215 K using the 4 mm diameter escape aperture.
Fresh Sample frozen solution KCl NSS
Formation of Slow for pure Cl2O up- None for pure Cl2O
up-HOCl take take
Formation of Transient for HOCl up- Fast for HOCl and pure Cl2 take and for pure Cl2O Cl2O uptake
uptake
Kinetics (γ) HOCl. HOCl (Cl2O)0 (3.7±0.8)!10K3 (5.2±1.8)!10K3
Cl2O mixture HOCl (Cl2O)SS (2.1±0.6)!10K3 (4.6±1.4)!10K3 (Cl2O)0 (3.0±0.9)!10K2 (3.0±1.1)!10K2 (Cl2O)SS (1.5±0.3)!10K2 (2.1±0.7)!10K2 Pure Cl2O (Cl2O)0 (4.2±1.1)!10K2 (4.5±1.2)!10K2 (Cl2O)SS (1.4±0.4)!10K3 (3.1±0.9)!10K2
comparing Figures 2 and 3 the most striking feature is the differing slope for Cl2
formation between uptake of pure Cl2O (Figure 2) or a mixture of Cl2O.HOCl
(Figure 3). Table 5 reveals that for pure Cl2O uptake the Cl2yield increases by
a factor of four in going from frozen KCl to NSS solution, whereas the yield of Cl2O taken up only increases by a mere factor of two at a given initial
concentra-tion. In contrast, for the mixture Cl2O.HOCl both the Cl2as well as the quantity
of Cl2O taken up increase by a factor of four which leaves the slope in Figure 3
practically unchanged (1.53 vs. 1.39) when comparing frozen KCl with NSS solution. One should be aware that the enhancement factors from Table 5 refer to individual experiments whereas the slope changes in Figures 2 and 3 result from a least-squares fit to several experiments, thus corresponding to an average. This is the principal reason for the difference between the slope ratio of 2.8 displayed in Figure 2 compared to a factor of four difference in Cl2yield from
Table 5 in going from KCl to NSS, both for pure Cl2O and HOCl.Cl2O.
Cl2formation from HOCl uptake
In order to quantify the amount of HOCl taken up which forms Cl2on frozen
KCl solution, several HOCl.Cl2O uptakes were performed. Under the
as-sumption that HOCl and Cl2O interact independentlyon frozen solution (see remark above), the slopes in Figures 2 and 3 were used in order to separate the contribution of the generated Cl2of both HOCl and Cl2O. Using equations (22) and (23), it is possible to calculate the fraction of the HOCl taken up which leads to the formation of Cl2:
Cl2 (HOCl contribution)= Cl2 (HOCl.Cl2O mixture)–Cl2(calculated, pure Cl2O uptake) (22)
Cl2(calculated, pure Cl2O uptake)= Cl2O(HOCl.Cl2O mixture)!S(pure Cl2O uptake) (23)
where Cl2 (HOCl.Cl2O mixture) is the Cl2yield generated from simultaneous uptake
according to reactions (18) and (19) and calculated using the corresponding slopes S(pure Cl2O uptake)from Figure 2. In order to determine the fraction of HOCl
that results in Cl2, Cl2 (HOCl contribution)calculated from equation (22) is plotted as
a function of HOCl taken up as shown in Figure 4. The slopes in Figure 4a and 4b are 0.30±0.10 on frozen KCl, NaCl and recrystallized sea salt (RSS), and 0.23±0.13 on frozen NSS solution, respectively, at 200 K. Given the scatter in the results displayed in Figure 4b, we conclude that between 10 and 40% of the HOCl taken up is converted to Cl2 on both frozen KCl and NSS solution at
200 K, independent of the frozen substrate and after correction for the formation of Cl2from Cl2O following equations (22) and (23).
In conclusion the data displayed in Figure 2 reveal that the Cl2 yield per
Cl2O taken up is 2.8 times higher for NSS than for the remainder of the substrates
for pure Cl2O, that is without interference from HOCl. Figure 3 reveals that for
the Cl2O.HOCl mixture the Cl2yield per Cl2O taken up is significantly higher
on all Cl-containing substrates compared to pure Cl2O. It is suggested that this
yield increase, expressed as an average slope of 1.46 in Figure 3 compared to 1.11 in Figure 2 is due to the presence of HOCl in the reacting gas. Figure 4 finally displays a fairly weak Cl2yield of 0.3±0.1 per HOCl taken up, regardless
of the substrate and after correction for the Cl2yield caused by Cl2O. We propose
to use the slopes as a parameter describing the relative propensity of Cl2O and
HOCl to generate Cl2from chloride-containing substrates at 200 K. It thus turns
out that Cl2O generates roughly twice the Cl2 yield compared to HOCl taking
the ratio of slopes of 1.11 vs. 0.3 and normalizing the yield per Cl atom capble of generating Cl2. In addition, Table 5 reveals that a large fraction of HOCl may
be recovered through desorption at 240 K in contrast to Cl2O that has all but
disappeared. In summary, the quantitative results show that the Cl2 yields per
HOCl taken up are significantly lower than for pure Cl2O taken up on both
frozen KCl, NaCl, RSS and NSS solutions thus reflecting the lower reactivity of HOCl compared to Cl2O for uptake on frozen halide solutions. This remains
valid even when taking into account the redox properties of humic-like substan-ces that may occur in NSS [33,34].
4. Br
2single pulse event
Immediately after the exposure of the HOCl.Cl2O mixture or pure Cl2O on the
frozen NSS solution for concentrations larger than 1011molecule cmK3, a single Br2pulse event of approximately (1.0±0.3)!1015 molecules occurs during the
first moments of the experiment. Br2 pulse events are displayed in Figures 5a
and 5b for pure Cl2O and HOCl.Cl2O uptake on NSS frozen solution,
respec-tively. By performing repetitive uptake experiment on frozen NSS solution, we do not detect additional Br2 bursts. We thought at first that only the surface
adsorbed Br– were consumed in the first Cl2O or HOCl uptake. However, no
Fig. 5. Uptake of pure Cl2O (a) and HOCl.Cl2O mixture (b) on frozen NSS solution at 200 K
for an escape orifice of 4 mm diameter. The symbols a, b, c and d correspond to the MS signal of Br2(m.e 160), HOCl (m.e 52), Cl2(m.e 70) and Cl2O (m.e 51), respectively.
let above 273 K for 20 minutes before freezing the sample and performing a second HOCl or Cl2O uptake. This may be related to the slow rate of diffusional
mixing at temperatures in the vicinity of 273 K which prevents the effective replacement of a Br-depleted solution from the interface by fresh bulk.
One in 600 of NaCl is BrK
in NSS solution resulting in approximately 0.001 M of BrK
. This represents approximately 6!1020BrK
per dm3of solution. In the present experiments, 5 ml of solution containing 35 glK1 of NSS was poured into the sample holder and resulted in Vfrozen = Vsol (rfrozen.rsol) =
4.5 cm3, where Vsol = 5 cm3 is the volume of the liquid solution, rsol =
1.02 g cmK3and rfrozen= 0.92 g cmK3are the densities of the liquid and of the
frozen solution, respectively. This amounts to 3!1018 BrK cmK3 and reveals
react and produce Br2on frozen NSS solution at 200 K for both Cl2O and HOCl.
Cl2O uptake.
It was found in previous work [35] that HOBr taken up on frozen chloride solution is completely converted to BrCl rather than transformed to Br2. In
con-trast, HOCl taken up on frozen bromide solution mostly produces Br2. In
conclu-sion, even if only 0.08% BrK
is activated in the atmosphere, it could have signifi-cant implication on the composition of the marine boundary layer because only catalytic amounts of Br2are necessary to start polar sunrise chemistry.
5. Influence of concentration, residence time and
temperature on the Cl
2yield
Switching from the 4 to 14 mm diameter escape aperture reduces both the resi-dence time as well as the pressure in the reactor by a factor of 12 according to Table 1. Under those conditions the chlorine mass balance for uptake of both pure Cl2O and HOCl.Cl2O at T = 200 K is not satisfied anymore as may be
seen from Table 6 because 20 to 30% of the dosed chlorine is not recoverable by thermal desorption at 240 K. The quantity of dissolved Cl2O and.or HOCl is
probably too small for it to desorb at 240 K
Figure 6b displays the yield of Cl2resulting from pure Cl2O uptake on frozen
KCl solution at 200 K as a function of time as well as of Cl2O taken up for a
single uptake experiment. A slope of 1.0 means that 50% of the chlorine taken up as Cl2O turns up as Cl2. We note that the scale of the exposure time is not
necessary linear with the uptake of Cl2O as it depends on the temporal
depend-ence of the uptake. The data in Figure 6b are to be compared with Figure 7b corresponding to HOCl.Cl2O uptake on frozen KCl solution at 200 K.
Compari-son of the slopes in Figures 6b and 7b at steady state (for t > 350 s) leads to the conclusion that they are identical within experimental uncertainty. The same is true for HOCl.Cl2O and Cl2O uptake on frozen NSS solution at 200 K whose
data are not shown. This together with a comparison of the cumulative yields of Cl2relative to Cl2O and HOCl in pure Cl2O and HOCl.Cl2O uptakes at 200 K,
respectively, strongly suggests that the uptake of HOCl by itself does not lead to Cl2formation at the low partial pressures used under the assumption that Cl2O
and HOCl uptake are independent of each other. Table 5 hints at the inhibition of Cl2O uptake in the presence of HOCl as do the data of Table 5, as mentioned
above, and suggest that the assumption of complete independence between HOCl and Cl2O may not hold. Consequently, HOCl is reactive only on frozen salt
solutions for concentrations on the order of 1011HOCl cmK3 corresponding to 10 ppb or more. This in turn suggests that the species taken up is in reality Cl2O
whose formation from HOCl is favored at high [HOCl].
Uptake experiments of pure Cl2O and HOCl.Cl2O at 215 K obtained in the
4 mm diameter aperture reactor revealed the same results as for the 14 mm diameter orifice reactor discussed above, namely that there is no additional
for-Fig. 6. (a) and (b): pure Cl2O uptake on frozen KCl solution at 200 K for [Cl2O] =
1.9!1010molecule cmK3using an escape orifice of 14 mm diameter. (b) Cl
2yield as a function
of Cl2O taken up for raw data displayed in (a). On graph (a), the dotted and solid curves show
the formation of Cl2and HOCl, respectively. The hashed curve corresponds to uptake of Cl2O.
mation of Cl2due to heterogeneous interaction of HOCl with frozen salt solutions
beyond the one generated by the reaction of Cl2O. Moreover, the Cl2O
heteroge-neous reaction is again significantly inhibited by the presence of HOCl. Compari-son of the Cl2 yields with Cl2O and HOCl uptake at 215 K.4 mm diameter
orifice reactor listed in Table 6 confirms both results, namely absence of Cl2
formation from HOCl alone, and strong inhibition of Cl2O uptake in the presence
of HOCl. Figures 13 and 14 present time-dependent cumulative yields of Cl2
also as a function of Cl2O uptake, and confirm the above conclusions. It therefore
seems that Cl2O is more reactive than HOCl on frozen salt solutions at 200 and
215 K as far as Cl2 release is concerned. In addition, the slightly larger slopes
in going from Figures 13a and 14a indicate that the Cl2 yields per Cl2O taken
Fig. 7. (a) and (b). HOCl.Cl2O uptake on frozen KCl solution at 200 K for [HOCl] =
3.7!1010molecule cmK3using an escape orifice of 14 mm diameter. (b) Cl2yield as a function
of Cl2O taken up and exposure time t for raw data displayed in (a). On graph (a), the dotted
and solid curves show the formation of Cl2and the uptake of HOCl, respectively. The dashed
curve corresponds to uptake of Cl2O.
6. Uptake coefficient of Cl
2O and HOCl
The uptake kinetics for fresh frozen KCl solutions at 200 K are displayed in Table 2 and Figure 8 in terms of γss(HOCl) which increases by a factor of ten
when [HOCl] decreases from 1011to 1010molecule cmK3(see Table 1). Uptake coefficients were obtained by averaging over at least two uptake experiments. We also note that γss(Cl2O) for the mixture HOCl.Cl2O is less than 10K3 for
[HOCl] > 1011molecule cmK3, but is larger than 0.1 for [HOCl] < 1011 mole-cule cmK3. This inhibition effect was briefly discussed above in relation to the total uptakes and may occur owing to high surface concentrations of both HOCl
Fig. 8. Synopsis of steady state uptake coefficients γss for HOCl and Cl2O on frozen salt
solutions of KCl and NSS at different experimental conditions. The uptake coefficient measured corresponds to the species first mentioned in the legend. The uncertainties inγssare estimated
as ±10 %.
and.or Cl2O. This may lead to surface site saturation on the time scale of the
experiment and reveals complex kinetics at the gas-condensed phase interface. γss(Cl2O) for pure Cl2O uptake at [Cl2O] < 1011 molecule cmK3 is larger
than 0.05 on fresh and poisoned frozen KCl solution as displayed in Tables 2 and 3, respectively. In addition,γss(Cl2O) for pure Cl2O on frozen KCl solution
for [Cl2O] between 1010to 1012molecule cmK3decreases by a factor of two for
the second uptake. In contrast, γss(Cl2O) for pure Cl2O on frozen NSS solution
increases at least by a factor of two for the second uptake for [Cl2O] > 1011
mole-cule cmK3 (4 mm diameter orifice). However,γss(HOCl(Cl2O)) on frozen NSS
solution did not change for concentrations ranging from 1010 to 1012 mole-cule cmK3and for a fresh or a previously poisoned sample within the experimen-tal uncertainty as displayed in Tables 3 and 4.
The measured uptake coefficient of Cl2O for the mixture HOCl.Cl2O,
γss(Cl2O(HOCl)), interacting with frozen NSS solution for [HOCl] ranging from
1010to 1012molecule cmK3was found to be ten times smaller compared to the uptake of pure Cl2O on the same substrate, that is in the absence of HOCl. This
may be explained either by the reverse of reaction (12) when HOCl is admitted into the reactor and more Cl2O is generated on the ice that may lead to surface
saturation, or by the known propensity of HOCl to poison ice surfaces that is in contrast to the adsorption of Cl2O on pure ice discussed in 3.1.
In summary, the kinetics of repetitive uptake for both Cl2O and HOCl on a
increases when the sum of [HOCl] and [Cl2O] decrease below 1011
mole-cule cmK3. In addition,γssis generally larger on frozen NSS compared to KCl
salt solution for a given HOCl and Cl2O concentration at 200 or 215 K (see
Tables 3, 4 and 5 and Figure 8). Figure 8 conveys an impression on the relative magnitude ofγss of HOCl vs. Cl2O and underlines the fact that Cl2O uptake is
significantly faster under all conditions. Previous work [31] has investigated the HOCl uptake on frozen KCl ice film of 0.1% by weight at 233 K which resulted inγss(HOCl) < 4.7!10K2. In the present work, we have used a concentration of
35 g lK1 of KCl which corresponds to approximately 0.2% by weight of ClK.
For a frozen KCl and NSS salt solution at 215 K we have obtainedγss(HOCl) =
(2.1±0.6)!10K3 and γss(Cl2O) = (4.6±1.4)!10K3, respectively. These values
are consistent with the results presented by Huff and Abbatt at 233 K [35].
7. Atmospheric implications and conclusions
We conclude that significant differences in the yield of Cl2owing to Cl2O uptake
were observed depending on the nature of the frozen substrate. For this reason KCl and NaCl may not in general be used as a model for NSS that shows special properties in comparison with the other three chloride-containing substrates, namely KCl, NaCl and RSS frozen solution. The reason for this special behav-iour may lie either in the buffering capacity or the presence of oxidizable organic substances, as alluded to above.
HOCl is thermodynamically unstable and is in equilibrium with Cl2O
accord-ing to reaction (12) and its inverse. The standard heat of reaction of equilibrium (12), ΔH0r, has been measured by several authors, but we prefer the value of
Knauth et al. [23] owing to the quality of this study withΔH0r= 2.7±0.2 kcal.
Mol leading to K298 = 0.082 (dimensionless). The kinetic results of this work including the comparison of the reactivity of pure Cl2O and a (non-equilibrium)
mixture of HOCl.Cl2O which we are able to prepare with routinely 25% Cl2O
in the HOCl sample (see Experimental) suggest that the equilibrium (12) lies on the side of adsorbed HOCl in the presence of ice or frozen aqueous salt solutions according to equilibrium (24):
Cl2O(ads) + H2O(ice)#2 HOCl(ads) (24)
The present results are consistent with a parallel reaction scheme in which Cl2O directly reacts with ClKto Cl2, either through halogen exchange, reaction
(19), or through a redox reaction on NSS as mentioned above. Unreacted Cl2O
may form HOCl(ads) that is non-reactive by itself but that slowly may react on the ice surface by way of equilibrium (24) and regenerate reactive Cl2O.
There-fore, equilibrium (24) is essential in considering the heterogeneous halogen form-ing potential of HOCl in the troposphere at suitably low temperatures. The possi-ble reason for the exothermicity of equilibrium (24) in the forward direction, which is in contrast to the gas phase, may lie in the ability of HOCl to form
Fig. 9. HOCl uptake on pure bulk (B) ice held at 200 K using the 4 mm diameter escape aperture. Curves a (HOCl), b (Cl2O) and c (Cl2) were monitored at m.e = 52, 51 and 70,
respectively. The HOCl and Cl2O flow rates correspond to (5.0±1.5)!1014 and
(1.1±0.5)!1014molecule sK1, respectively. The corresponding concentrations of HOCl and Cl2O were 4.5!1011and 1.5!1011molecule cmK3, respectively.
strong hydrogen bonds with the ice surface, a property that Cl2O lacks. Although
we do not observe Cl2formation by HOCl itself at low residence times (14 mm
diameter orifice) or at higher temperature of 215 K in the present experiments we cannot discount the possibility that Cl2may form at atmospherically
meaning-ful time scales such as days if we allow the ice substrate to accumulate sufficient HOCl such that reactive Cl2O may be generated following equilibrium (24).
Formation of Cl2 is subsequently expected in view of the high reactivity of
Cl2O(ads) observed in the present study. We therefore postulate that there is a
role for HOCl in regards to formation of Cl2in marine boundary layer chemistry
at low temperatures although there is no experimental proof available from gas phase measurements yet.
There have been a number of theoretical studies on the interaction of HOCl with ice surfaces, but none with Cl2O such that the quantitative aspects of
equi-librium (24) remain to be elucidated [36–38]. However, the present results offer a glimpse on the qualitative behaviour of adsorbed HOCl.Cl2O by using the Cl2
formation as a probe. The present results are also broadly consistent with Huff and Abbatt [25] who conducted the only other study with which the present work is comparable. They noted that HOCl is nonreactive on ice substrates at 233 and 248 K and provided upper limits for γss that are consistent with the present
values.
In an atmospheric context, we may estimate the yield of Cl2from the uptake
of HOCl on marine ices using the present experimental results. From the work of Huff et Abbatt [25], it is possible to estimate the flux of the dry deposition of HOCl using F = v C, where v is the vertical deposition velocity in cm sK1and
Fig. 10. Cl2O uptake on pure bulk (B) ice held at 200 K using the 4mm diameter escape
aperture. Curves a (HOCl), b (Cl2O) and c (Cl2) were monitored at m.e = 52, 51 and 70,
respectively. The Cl2O impurity flow rate was (2.4±0.6)!1014molecule sK1.
C is the HOCl concentration in the atmosphere in molecule cmK3. Results from field measurements revealed that the concentration of chloride compounds that could be photolysed (HOCl or Cl2) is approximately 10 ppt [7] which
corre-sponds to 2.95!108HOCl cmK3in the spring time. The vertical velocity of the dry deposition is calculated using v = 1.(Ra+ Rb+ Rc), where Rais the transport
of HOCl across the atmospheric boundary layer, Rbis the molecular diffusion
term and Rc is the contribution of the heterogeneous reaction expressed in
s cmK1. Ra= (1.uk2)(ln(z.z0))2, where u is the wind velocity taken as 1000 cm
sK1, k is a proportionality factor equal to 0.4, z0= 10K5m is the length of the
ice roughness and z is the height of an atmospheric layer taken to be 100 m [39]. In addition, Rb = z0.D(HOCl) where D(HOCl) = 0.105 cm2 sK1 is the HOCl
diffusion coefficient in air. Finally, Rc= 4.γc where c is the mean molecular
velocity of HOCl. Using as an estimate γss(HOCl) ≈ 2!10K3on frozen NSS
solution at 200 K for [HOCl] >1011 molecule cmK3 (see Table 2), we obtain v(HOCl) = 0.589 cm sK1which leads to F(HOCl) = (2.95!108molecule cmK3) (0.589 cm sK1) = 1.74!108molecule cmK2sK1. Under the assumption that 30% of HOCl taken up on marine ice is converted to Cl2at 200 K, we estimate that
F(Cl2) = (1.74!108molecule cmK2sK1) (0.30) = 5.22!107molecule cmK2sK1
at 200 K.
By considering the formation of Cl2 as an upper limit from the reaction of
HOCl on marine ice for half a day, we obtain (5.22!107
mole-cule cmK2 sK1)(43200 s) = 2.25!1012 molecule of Cl2 produced per cm2 of
marine ice per day. If Cl2is mixed homogeneously in the atmosphere within a
layer of 100 m, the Cl2 concentration could reach up to 2.25!108
Fig. 11. Repetitive HOCl uptake on frozen KCl solution at 200 K. The HOCl and Cl2O flow
rate were 8!1014and 2!1014molecule sK1, respectively. The traces a, b and c are related to HOCl (m.e 52), Cl2O (m.e 51) and Cl2(m.e 70) MS signal, respectively at 200 K, 4 mm
diameter orifice.
activation effectively could lead to an important destruction of hydrocarbons and ozone in the marine boundary layer during arctic spring time.
The conclusions from the present work may be summarized as follows: From the comparison of the interaction of pure Cl2O on the one hand, and of
a non-equilibrium mixture of HOCl.Cl2O on several types of chlorine-containing
substrates in the range 200 to 215 K we obtain the indication that the reactivity of Cl2O is significantly larger than that of HOCl in regards to the formation of
Cl2. As an example, the Cl2 yield resulting from the interaction of Cl2O on a
Fig. 12. HOCl uptake on frozen acidified KCl solution at 200 K. The HOCl (a) and Cl2O (b)
flow rate were 9!1014and 2.4!1014molecule sK1, respectively, and led to Cl2(c) production.
The frozen KCl solution was buffered with 0.068 M NaOH, 0.056 M citric acid and 0.044 M NaCl (pH = 4.0) at 200 K, 4 mm diameter orifice.
Excellent chlorine mass balances are obtained under certain conditions at 200 K, but not at low residence times and.or low pressures as well as at 215 K. Uptake of both Cl2O and HOCl on frozen NSS (natural sea salt) solution is
sustained for at least an hour in contrast to other chlorine-containing substrates such as frozen KCl, NaCl and RSS (recrystallized sea salt) solution. The facile reactive uptake of HOCl and Cl2O on NSS may be due to the natural buffering
capacity or the presence of oxidizable organics in NSS that both are thought to support the formation of Cl2.
Cl2O and.or HOCl uptake on NSS leads to a one-time Br2release in a burst
mode that may be significant in relation to marine boundary layer chemistry in the springtime arctic.
Owing to the thermodynamic instability of HOCl in the gas phase the fate. formation of the corresponding thermodynamically stable anhydride, Cl2O, must
also be considered in the presence of a substrate with which both species interact. Considering the equilibrium between adsorbed HOCl and Cl2O on ice it is likely
that the gateway to formation of Cl2passes through the formation of adsorbed,
reactive Cl2O by way of adsorption of gas phase HOCl on the surface of the
Fig. 13. Uptake of pure Cl2O (a) and HOCl.Cl2O (b) on frozen KCl solution at 200 K for
[HOCl] = 4.5!1011molecule cmK3(4 mm diameter escape orifice). The Cl2yield is plotted
Fig. 14. Uptake of pure Cl2O (a) and HOCl.Cl2O (b) on frozen KCl solution at 215 K for
[HOCl] = 4.5!1011molecule cmK3(4 mm diameter escape orifice). The Cl
2yield is plotted
Appendix
Table 5. Summary of mass balance for uptake experiments of HOCl.Cl2O and pure Cl2O on
frozen KCl and Natural Sea Salt (NSS) solutions at 200 K at concentrations in excess of 1011molecule cmK3(4 mm diameter escape orifice)a. Integration time is 700±50 s.
Reactants Escape Uptake Products Thermal de- Uptake Recovery Relative Ratio de-orifice sorption at of chlo- of chlo- Cl2 sorbed
(mm) 240 K of chlo- rine rine spe- yield vs.remain-rine-contain- species cies ing HOCl
ing species
(1017 (1017 (1017 (1017 (1017 (1017 (1017) (1017)
Cl2O) HOCl) Cl2) HOCl) Cl2O) HOCl)
Cl2O. 4 0.73 0 0.49 0.84 0.016 0.20 1.47 1.56 0.33 -KCl (200 K) HOCl. 4 0.27 0.63 0.58 - 0.034 0.49 1.17 1.14 0.50 0.77 KCl (200 K) Cl2O. 4 1.41 0 1.96 0.097 0.037 0.70 2.82 2.83 0.70 -NSS (200 K) HOCl. 4 1.12 0.80 2.58 - 0.043 0.63 3.04 3.30 0.85 0.79 NSS (200 K)
aEach individual yield measurement has an uncertainty of 5% resulting in a 20% uncertainty in the mass
Table 6. Summary of mass balance for uptake experiments of HOCl.Cl2O and pure Cl2O on
frozen KCl and Natural Sea Salt (NSS) solutions at different temperatures and gas phase resi-dence times at concentrations in excess of 1011molecule cmK3(4 and 14 mm diameter escape orifice)a.
Reactants Escape Uptake Products Thermal de- Uptake Recovery Relative Ratio de-orifice sorption at of chlo- of chlo- Cl2 sorbed
(mm) 240 K of chlo- rine rine spe- yield vs.remain-rine-contain- species cies ing HOCl
ing species
(1017 (1017 (1017 (1017 (1017 (1017 (1017) (1017) Cl2O) HOCl) Cl2) HOCl) Cl2O) HOCl)
Cl2O. 4 1.20 0 1.19 0.60 0 0 2.40 1.79 0.50 -KCl (215 K) HOCl. 4 0.80 1.00 0.62 - 0 0 2.60 0.62 0.24 0 KCl (215 K) Cl2O. 4 0.83 0 1.10 0.63 0 0 1.67 1.73 0.66 -NSS (215 K) HOCl. 4 0.80 0.92 0.82 - 0 0 2.50 0.82 0.33 0 NSS (215 K) Cl2O. 14 0.52 0 0.40 0.39 0 0 1.04 0.79 0.37 -KCl (200 K) HOCl. 14 0.17 0.38 0.18 - 0 0 0.72 0.18 0.25 0 KCl (200 K) Cl2O.SS 14 0.61 0 0.79 0.97 0 0 1.22 0.89 0.65 -(200 K) HOCl.SS 14 0.24 0.45 0.25 - 0 0 0.93 0.25 0.27 0 (200 K)
aEach individual yield measurement has an uncertainty of 5% resulting in a 20% uncertainty in the mass
bal-ance.
Acknowledgement
Generous support of this research was granted by OFES (Office Fédéral de l’en-seignement et de la science, supplanted by the SER agency (State Secretariat for Education and Research)) within the fifth EU framework program project THALOZ.
References
1. L. A. Barrie, J. W. Bottenheim, R. C. Schnell, P. J. Crutzen, R. A. Rasmussen, Nature 334 (1988) 138.
2. L. Barrie, U. Platt, Tellus Series B-Chemical and Physical Meteorology 49 (1997) 450.
3. A. Richter, F. Wittrock, M. Eisinger, J. P. Burrows, Geophys. Res. Lett 25 (1998) 2683.
4. T. Wagner, U. Platt, Nature 395 (1998) 486.
5. B. T. Jobson, H. Niki, Y. Yokouchi, J. Bottenheim, F. Hopper, R. Leaitch, J. Geo-phys. Res. 99 (1992) 25355.
6. K. L. Foster, R. A. Plastridge, J. W. Bottenheim, P. Shepson, B. J. Finlayson-Pitts, C. W. Spicer, Science 291 (2001), 471.
7. G. A. Impey, P. B. Shepson, D. R. Hastie, L. A. Barrie, K. G. Anlauf, J. Geophys. Res. 102 (1997) 16005.
8. J. P. D. Abbatt, G. C. G. Waschewsky, J. Phys. Chem. A 102 (1998) 3719. 9. S. Fickert, J. W. Adams, J. N. Crowley, J. Geophys. Res. 104 (1999) 719. 10. J. W. Adams, N. S. Holmes, J. N. Crowley, Atmos. Chem. Phys. 2 (2002) 79. 11. R. Vogt, P. J. Crutzen, R. Sander, Nature 383 (1996) 327.
12. J. C. McConnnell, G. S. Henderson, L. Barrie, J. Bottenheim, H. Niki, C. H. Lang-ford, E. M. J. Templeton, Nature 355 (1992) 150.
13. T. Tang, J. C. McConnell, Geophys. Res. Lett. 23 (1996) 2633.
14. Website of the IUPAC Subcommittee on the Evaluation of Data for Atmospheric Chemistry at URL: http:..www.iupac-kinetic.ch.cam.ac.uk.
15. B. A. Michalowski, J. S. Francisco, S. M. Li, L. A. Barrie, J. W. Bottenheim, P. B. Shepson, J. Geophys. Res. 105 (2000) 15131.
16. A. Aguzzi, M. J. Rossi, Phys. Chem. Chem. Phys. 1 (1999) 4337. 17. C. Santschi, M. J. Rossi, Phys. Chem. Chem. Phys. 6 (2004) 3447.
18. B. J. Finlayson-Pitts, J. N. Pitts Jr, Chemistry of the upper and lower atmosphere, Academy Press, San Diego (2000).
19. S. Ghosal, J. C. Hemminger, J. Phys. Chem. A 103 (1999) 4777.
20. H. N. Berko, P. C. McCaslin, B. J. Finlayson-Pitts, J. Phys. Chem. 95 (1991) 6951. 21. J.-E. L. Cook, C. A. Ennis, T. J. Leck, J. W. Birks, J. Chem. Phys. 74 (1981) 545. 22. C. A. Ennis, J. W. Birks, J. Phys. Chem. 89 (1985) 186.
23. H. D. Knauth, H. Alberti, H. Clausen, J. Phys. Chem. 83 (1979) 1604. 24. L. T. Molina, M. J. Molina, J. Phys. Chem. 82 (1978) 2410.
25. A. K. Huff, J. P. D. Abbatt, J. Phys. Chem. 104 (2000) 7284.
26. T. von Clarmann, N. Glatthor, U. Grabowski, M. Hpfner, S. Kellmann, A. Linden, Gizaw Mengistu Tsidu, M. Milz, T. Steck, G. P. Stiller, H. Fischer, B. Funke, J. Geophys. Res. 111 (2006) D05311.
27. L. J. Kovalenko, K. W. Jucks, R. J. Salawitch, G. C. Toon, J.-F. Blavier, D. G. Johnson, A. Kleinbhl, N. J. Livesey, J. J. Margitan, H. M. Pickett, M. L. Santee, B. Sen, R. A. Stachnik, J. W. Waters, Geophys. Res. Lett. 34 (2007) L19801. 28. F. F. Fenter, F. Caloz, M. J. Rossi, J. Phys. Chem. 98 (1994) 9801. 29. J. Lyman, R. Fleming, Sears Foundation 93 (1939) 143.
30. F. Caloz, F. F. Fenter, K. D. Tabor, M. J. Rossi, Rev. Sci. Instrum. 68 (1997) 3172. 31. P. Pratte and M. J. Rossi, J. Phys. Chem. A 110 (2006) 3042.
32. E. R. Pounder, The Physics of Ice, Pergamon Press, Oxford (1965)
33. C. L. Badger, I. George, P. T. Griffiths, C. F. Braban, R. A. Cox, J. P. D. Abbatt Atmos. Chem. Phys. 5 (2005) 9581.
34. V. Vaida, A. F. Tuck, G. B. Ellison, Phys. Chem. Earth (C). 25 (2000) 195. 35. A. K. Huff, J. P. D. Abbatt, J. Phys. Chem. A 106 (2002) 5279.
36. S. Casassa, C. Pisani, J. Chem. Phys. 116 (2002) 9856.
37. B. A. Flowers, J. S. Francisco, J. Phys. Chem. A 105 (2001) 494.
38. A. F. Voegele, C. S. Tautermann, T. Loerting, K. R. Liedl, J. Phys. Chem. A 106 (2002) 7850.
39. J. H. Seinfeld, S. P. Pandis, Atmospheric Chemistry and Physics, John Wiley& Sons
(1998)
40. L. A. Barrie, G. Denhartog, J. W. Bottenheim, S. Landsberger, J. Atmos. Chem. 9 (1989) 101.
![Table 1. Escape rate constants k esc of HOCl, Cl 2 and Cl 2 O measured at 300 K and typical gas concentrations [G] for the 4 and the 14 mm diameter escape aperture.](https://thumb-eu.123doks.com/thumbv2/123doknet/14897310.652106/5.658.88.564.145.229/table-escape-constants-measured-typical-concentrations-diameter-aperture.webp)
![Fig. 2. Correlation between the yield of Cl 2 and Cl 2 O taken up. Uptake experiment of pure Cl 2 O on frozen KCl ( ▲ ), NSS (+), NaCl ( ◆ ) and recrystallized RSS ( ■ ) solution at 200 K for [Cl 2 O] = 2.7!10 11 molecule cm K3](https://thumb-eu.123doks.com/thumbv2/123doknet/14897310.652106/12.658.169.488.104.340/correlation-yield-uptake-experiment-frozen-recrystallized-solution-molecule.webp)
![Fig. 6. (a) and (b): pure Cl 2 O uptake on frozen KCl solution at 200 K for [Cl 2 O] = 1.9!10 10 molecule cm K3 using an escape orifice of 14 mm diameter](https://thumb-eu.123doks.com/thumbv2/123doknet/14897310.652106/20.658.167.489.98.577/uptake-frozen-solution-molecule-using-escape-orifice-diameter.webp)
![Fig. 7. (a) and (b). HOCl . Cl 2 O uptake on frozen KCl solution at 200 K for [HOCl] = 3.7!10 10 molecule cm K3 using an escape orifice of 14 mm diameter](https://thumb-eu.123doks.com/thumbv2/123doknet/14897310.652106/21.658.161.485.93.568/hocl-uptake-frozen-solution-molecule-escape-orifice-diameter.webp)
