Noncovalent Complexes Analyzed by
Electrospray Mass Spectrometry: Cyclopeptidic
Inhibitors of the Nuclear Receptor
Coactivator 1-STAT6
David Touboul,
aLudovic Maillard,
bAnja Grässlin,
bRoba Moumne,
bMarkus Seitz,
bJohn Robinson,
band Renato Zenobi
aaDepartment of Chemistry and Applied Biosciences, ETH Zürich, Zürich, Switzerland bInstitute of Organic Chemistry, University of Zürich, Zürich, Switzerland
Mass spectrometry, and especially electrospray ionization, is now an efficient tool to study noncovalent interactions between proteins and inhibitors. It is used here to study the interaction of some weak inhibitors with the NCoA-1/STAT6 protein with KDvalues in theM range. High signal intensities corresponding to some nonspecific electrostatic interactions between NCoA-1 and the oppositely charged inhibitors were observed by nanoelectrospray mass spectrometry, due to the use of high ligand concentrations. Diverse strategies have already been developed to deal with nonspecific interactions, such as controlled dissociation in the gas phase, mathematical modeling, or the use of a reference protein to monitor the appearance of nonspecific complexes. We demonstrate here that this last methodology, validated only in the case of neutral sugar–protein interactions, i.e., where dipole– dipole interactions are crucial, is not relevant in the case of strong electrostatic interactions. Thus, we developed a novel strategy based on half-maximal inhibitory concentration (IC50) measure-ments in a competitive assay with readout by nanoelectrospray mass spectrometry. IC50values determined by MS were finally converted into dissociation constants that showed very good agreement with values determined in the liquid phase using a fluorescence polarization assay. (J Am Soc Mass Spectrom 2009, 20, 303–311) © 2009 Published by Elsevier Inc. on behalf of American Society for Mass Spectrometry
T
here is a strong interest in the study of noncova-lent complexes between biomolecules, which are playing key roles in life. Numerous solution-phase analytical techniques were developed to deter-mine the specificity and the strength of these types of interactions[1]. Mass spectrometry (MS), and especially electrospray ionization (ESI)[2], has become an efficient tool to study specific noncovalent complexes between various species (protein–protein, protein–small mole-cules, protein–DNA, DNA–DNA . . .)[3– 8]. In fact, ESI is a very soft ionization technique, i.e., noncovalent complexes can be transferred intact from solution into the gas phase. Quantitative information such as stoichi-ometry, binding constants, or reaction kinetics can be obtained by ESI-MS, and values are often in good agreement with data coming from well-established so-lution phase techniques. Nevertheless, the study of noncovalent [protein–ligand] complexes require careful control of experimental parameters. Buffer, pH,pres-sure, and voltages applied to the different stages of the mass spectrometer have great influence on spectral characteristics and on the information gained. Moreover, electrochemical reactions and desolvation/ionization mechanisms involved in ESI can also complicate the analysis, thus giving rise to the so-called nonspecific interactions (i.e., interactions with nonspecific binding sites) that alter the solution phase stoichiometry. To study weak complexes with dissociation constants (KD) in the M range or higher in solution, high ligand concentrations are employed, leading to an increase of nonspecific complex ions signals and to underestimate KD values, which might not reflect the solution-phase equilibria anymore[5, 9 –16].
Three strategies have been developed to determine affinities of weak [protein–ligand] complexes by ESI-MS, even when nonspecific gas-phase interactions un-settle the analysis.
1. One possibility is to disrupt the nonspecific gas-phase interactions between ligand and protein by using blackbody infrared radiation dissociation (BIRD)[12]. Nonetheless, it was shown that in some
Address reprint requests to Professor R. Zenobi, Department of Chemistry and Applied Biosciences, ETH Zürich, ETH Honggerberg, HCI E 329, CH-8093 Zürich, Switzerland. E-mail:zenobi@org.chem.ethz.ch
Published online October 15, 2008 © 2009 Published by Elsevier Inc. on behalf of American Society for Mass Spectrometry. Received February 28, 2008
1044-0305/09/$32.00 Revised October 2, 2008
cases nonspecific interactions can be even stronger than the specific interactions, leading to the destruc-tion of the complex of interest[5].
2. Daubenfeld et al. have shown that specific ligand binding is modeled as a binomial distribution, while complexes resulting from nonspecific gas-phase in-teractions follow a statistical Poisson distribution [15]. As a consequence, the contributions of specific and nonspecific binding on the mass peak distribu-tions could be modeled from the dependence on ligand concentration. This method has been success-fully used to determine the affinity range of ADP and ATP binding with creatine kinase. However, since many numerical parameters of the model have to be adjusted, high quality spectra are required, and initial knowledge of the specific interactions is required.
3. Klassen et al.[16]reported a third strategy: a refer-ence protein that is known to not specifically bind with the ligand in solution phase is added to the sample mixture consisting of the ligand and the target protein. Detection of noncovalent complexes between the ligand and the reference protein by nanoESI-MS results only from gas-phase interac-tions. Peak intensities and their distribution could be used to model gas-phase interactions between the ligand and the target protein. The principal assump-tion that the fracassump-tion of proteins and protein com-plexes that engage in nonspecific ligand binding during the nanoES process is determined by the number of free ligand molecules in the offspring droplets leading to gaseous ions and is independent of the size and structure of the protein or protein complex.
Considering the key role of MS in the drug discovery process, we focused on the development of new ESI assays, which could be of value to measure the affinity of noncovalent [protein–peptide] complexes, even if these exhibit some nonspecific interactions in the gas phase. As an example of the methodology, we explore the binding of some cyclopeptides with the PAS-B domain of the co-activator protein NCoA-1, also called steroid receptor coactivator-1 (SRC-1). NCoA-1 is one of the essential proteins involved in the interleukin-4/ interleukin-13 (IL4/IL13) signaling cascade, which con-trols the activation of genes implicated in immune and
anti-inflammatory responses[17, 18]. The ability of IL-4 to affect cellular differentiation requires the activation of the signal transducer and activator of transcription 6 (STAT6). Following binding of IL-4/IL-13 to the extra-cellular domain of the IL-4/13 receptor, IL-4 becomes phosphorylated, whereupon it dimerizes through non-covalent interactions, translocates to the nucleus, and there binds through its DNA-binding domain to the transcriptional start regions of IL-4/IL-13 responsive genes. A short C-terminal segment of STAT6, called the transactivation domain, recruits components of the transcriptional machinery to activate transcription. One of these components is the coactivator protein NCoA-1 [19]. It has been proposed that blocking the binding of STAT6 and NCoA-1 are potentially of therapeutic inter-est for the treatment of allergic reactions, including asthma and atopic diseases[20, 21]. In the following, we propose to use a reference peptide with a known KD value for the NCoA-1 PAS-B domain. Displacement of the reference peptide from the protein by an inhibitor leads to a decrease in the peak intensity of the reference protein–peptide complex. As internal standard, a sec-ond protein, i.e., myoglobin, has been chosen to bind with neither the reference peptide nor the inhibitor in solution or in the gas phase. After normalization, data are fitted to a sigmoid equation to determine the IC50 values from the dependence on inhibitor concentration. Thereafter, KDvalues of the competitive inhibitors are extrapolated using a general Cheng-Prusoff equation.
Material and Methods
Chemicals
Commercial reagents were used without further pu-rification. Myoglobin, lysozyme, lactalbumin, ammo-nium bicarbonate, methanol, and acetic acid were purchased from Sigma-Aldrich Chemie GmbH (Buchs, Switzerland).
Peptide Synthesis
Peptides 1, 2, and 6, and inhibitors A, B, and C (Table 1) were synthesized by solid-phase methods using stan-dard Fmoc chemistry on an Applied Biosystems (Rot-kreuz, Switzerland) 433A peptide synthesizer. The backbone-cyclic peptides were assembled on
2-chloro-Table 1. Monoisotopic masses and KDvalues obtained by fluorescence polarization assay and by mass spectrometry for the
STAT6-derived peptides Sequences Monoisotopic mass (Da) KIobtained by fluorescence polarization assay (M)[22] KIobtained here (M) (1) LLPPTEQDLTKLLLEGQGESGY 2400.2 0.26 0.30
(2) LPPTEQDLTKLLLEGQGESGY 2287.2 7.5 Used as reference
Inhibitor A: cyclic-FEWLGWEFpP 1288.5 3.0 2.2
Inhibitor B: cyclic-FEWLAREFpP 1272.6 ⬎20 ⬎20
Inhibitor C: cyclic-FEWLLWEFpP 1318.5 12.1 5.6
trityl chloride resin (Novabiochem). The synthesis of peptide 1 is described here as a typical procedure.
Fmoc-Tyr-OH (0.25 mmol) was coupled to 2-chlorotritylchloride resin (600 mg, loading ⫽ 0.417 mmol/g) in the presence of di-isopropylethylamine (DIPEA, 4 eq) in CH2Cl2(15 mL). The unreacted sites on the resin were capped by washing with a mixture of CH2Cl2/MeOH/DIPEA (17:2:1) followed by MeOH. Following removal of the Fmoc-group using 20% pip-eridine in N-methyl-2-pyrrolidinone (NMP), chain elon-gation was performed with Gly-OH, Fmoc-Ser(tBu)-OH, Fmoc-Glu(tBu)-OH, Fmoc-Gln(Trt)-OH, Fmoc-Leu-OH, Fmoc-Lys(Boc)-OH, Fmoc-Thr(tBu)-OH, Fmoc-Pro-OH, Fmoc-Pro-OH (1 mmol each), using 20% piperidine/NMP for Fmoc deprotection, HBTU/HOBt for activation, DIPEA as base and NMP as solvent. After completion of the synthesis, the linear peptide was cleaved from the resin and deprotected with CF3COOH/ water/tri-isopropylsilane (vol/vol/vol 95/2.5/2.5). Af-ter removing the solvent, the peptide was precipitated with diisopropyl ether (15 mL), collected by centrifuga-tion and washed twice with di-isopropyl ether (15 mL). Purification was performed by preparative HPLC. HPLC analyses were performed on a Vydac (Supelco SA, Switzerland) 218TP54 C18 column (250 ⫻ 46 mm; particle size 5m; Solvent A: H2O/TFA vol/vol 0.1%; Solvent B: MeCN/TFA vol/vol 0.1%; flow 1 mL/min; linear gradient A/B: from 85/15 to 45/55 in 25 min). The retention time was estimated to 15.6 min. To confirm the identification, MALDI-TOF MS analysis was performed in the positive ion mode, showing an intense peak at m/z 2401.1, corresponding to the ex-pected monoisotopic mass of the [M⫹ H]⫹ion.
Stock solutions: Each peptide was dissolved in an ammonium bicarbonate (50 mM, pH 7.5) buffer to give a 200M solution. Concentrations were determined by UV at 280 nm.
Production of NCoA-1 PAS B Domain
NCOA-1 PAS B domain (residues 257–385 of human NCoA-1) was obtained at a concentration of 30 to 50M in HEPES (10 mM), NaCl (150 mM), and EDTA (3.4 mM) pH 7.4 according to the protocol reported by Seitz et al. [22]. For NanoESI experiments, the protein was dialyzed against an ammonium bicarbonate (50 mM, pH 7.5) buffer.
Mass Spectrometry
Mass spectrometric analysis was performed with a hybrid quadrupole time-of-flight mass spectrometer (Q-TOf Ultima; Waters/Micromass Ltd., Manchester, UK) fitted with an automated chip-based nanoESI robot (NanoMate model 100, Advion Bioscience, Ithaca, NY). All measurements were performed in the positive ion mode. The cone voltage was kept at 45 V and the RF
lens 1 at 100 V for all measurements. Argon was used as collision gas and a typical setting of 10 V was used for the collision energy parameter to optimize desolvation. The transmission of the ions through the quadrupole was optimized for the required mass range (m/z 1500 – 3000). Mass spectra were accumulated during 2 to 3 min to have a good signal-to-noise ratio. Calibration of the instrument was performed using 1 M myoglobin solution in water/methanol/acetic acid (50/50/1, vol/ vol/vol). Denaturing conditions were obtained by dis-solving the sample in water/methanol/acetic acid (50/ 50/1, vol/vol/vol), whereas nondenaturing conditions were obtained by using an ammonium bicarbonate (50 mM, pH 7.5) buffer.
NanoESI-MS Competition Assay
Assays were carried out in a 96-well microtiter plate. For KD measurement of [NCoA-1– cyclopeptide] com-plex, each well was loaded with 2 L of a 30 M NCoA-1 solution, 1L of a 200 M peptide 2 solution, 1 L of a 50 M myoglobin solution. Peptide 1 (or cyclopeptide) was added to a final concentration of 0 –10M (0–80 M for cyclopeptide). In each well, the total volume was made up to 10L by the addition of ammonium bicarbonate buffer. The plate was incubated at room temperature for 5 min before the NanoESI-MS analysis. The fraction of NCoA-1 bound to peptide (2) is correlated to the peak ratio of [NCoA-1–peptide (2)] complex (charge state 7) versus myoglobin (charge state 8). After normalization, data were fitted with Origin ver. 7.5 software (OriginLab Corporation, Northampton, MA) to a sigmoid equation for IC50values determina-tion. The KDvalues were extrapolated from IC50values according to the method described by Nikolovska-Coleska et al.[23].
Results and Discussion
In a first approach, we planed to use a reference peptide with a known KDtowards NCoA-1. Displacement of the reference peptide from the protein by increasing inhib-itor concentration should lead to a decrease of the peak intensity of the reference [peptide–protein] complex, and the appearance of new signals corresponding to the [inhibitor–protein] complex. Since both reference and sample peptides are small compared with NCoA-1, we assumed that the ionization of the complexes should be essentially governed by the protein. Therefore, the ratio of peak intensities of both complexes should correlate the relative affinities of the reference peptide and the inhibitors towards NCoA-1.
Selection of Peptidic Reference Ligands
The interaction between STAT6 and NCoA-1 is medi-ated by a short section of the STAT6 transactivation domain that includes the sequence motif LXXLL (L ⫽ leucine, X⫽ any amino acid), which upon binding to a
PAS-B domain of NCoA-1 folds into an amphipathic ␣-helix [24]. The crystal structure of a STAT6-derived peptide (794 – 814) complexed with NCoA-1 PAS-B do-main (257–385) with a 1:1 stoichiometry (PDB file 1OJ5) was reported by Razeto et al.[25]. As reference ligands for the competition assay, we chose two linear peptides including residues Leu794-Gly814(peptide 1) and Leu795 -Gly814(peptide 2) of STAT6. Peptides 1 and 2 have an additional C-terminal Tyr to aid concentration measure-ments by UV. Their affinities for NCoA-1, determined by a competitive fluorescence polarization assay and/or isothermal titration calorimetry, have been reported to be 0.30M and 7.5 M, respectively (Table 1)[22].
Figure 1shows a representative spectrum of NCoA-1 in nondenaturing buffer. Two charge state distributions
are present, probably corresponding to a folded (m/z 1700 –3000) and a partially or completely unfolded conformation of the protein (m/z 800 –1700). It must be noted that the use of a denaturing buffer does not change the charge state distribution, i.e., the protein is quite insensitive to pH or solvent changes. In a second experiment, NCoA-1 (6M) was mixed in ammonium acetate buffer (50 mM) with the two peptides (1) (Figure 2a), and (2) (Figure 2b) at a high concentration (60M, i.e., a 10-fold excess) compared with the protein con-centration. Complexes (1:1 protein:ligand stoichiome-try) were only observed for the charge states 7 and 8, whereas no complex was observed in the m/z 800 –1700 range. This confirmed that charge states 6, 7, and 8 correspond to the folded active protein, whereas the higher charge states correspond to inactive conforma-tions. In the case of peptide (1) (Figure 2a), only a very weak signal at m/z⬃2800 was found for the 7⫹complex that corresponds to a 1:2 protein:ligand stoichiometry. Since we showed by isothermal titration calorimetry (ITC) that peptide (1) binds to NCoA-1 in a 1:1 interac-tion model[22], we assumed that the 7⫹complex only results from gas-phase interactions due to the high concentration of the ligand. This has been confirmed at lower peptide concentration (ratio 1:5 or below) by the disappearance of the signal corresponding to the 1:2 protein:ligand stoichiometry complex.
Figure 1. NanoESI mass spectrum of NCoA-1 at a 5M concen-tration in a nondenaturing buffer (ammonium bicarbonate, 50 mM, pH 7.5).
Figure 2. NanoESI mass spectra of the noncovalent complexes between NCoA-1 (6M) and (a) peptide (1) (60M), (b) peptide (2) (60 M), (c) peptide (A) (60 M), and (d) peptide (B) (60 M). Filled square symbol corresponds to the ligand.
Specific Versus Nonspecific Gas-Phase Interactions
Recently, numerous cyclopeptide competitive inhibitors of STAT6 –NCoA-1 binding were developed in Robin-son’s group. KD values of the [NCoA-1– cyclopeptide] complex have been measured by a competitive fluores-cence polarization assay [22], confirming that in solu-tion, peptides (1) and (2) and all the inhibitors interact with the same binding site on NCoA-1 PAS-B domain. Three cyclopeptide competitive inhibitors (A), (B), and (C) have been selected for extended experiments. KD values of inhibitors (A), (B), and (C) of NCoA-1 were measured to be 3.0M, ⬎40 M, and 12.1 M, respec-tively, by a competitive fluorescence polarization assay [22]. Whatever the inhibitor chosen, at 6M protein and 60M cyclopeptide concentrations, complexes with 1:1, 1:2 or even 1:3 protein:ligand stoichiometry were ob-served for charge states 6, 7, and 8, as well for charge
state 9, which was attributed to an unfolded protein complex (Figure 2c and d). These peaks did not disap-pear at lower peptide concentration. We assumed that they result from nonspecific gas-phase interactions, probably due to direct electrostatic interactions between deprotonated carboxylate groups from glutamate resi-dues of the cyclopeptidic inhibitors and some proton-ated basic residues on the protein surface. Since elec-trostatic interactions are greatly enhanced in the gas phase compared with the solution phase (ratio of the dielectric constant of water compared with vacuum) [26], nonspecific electrostatic adducts are stabilized. This assumption is first confirmed by the fact that the nonspecific adducts resulting from the aggregation of NCoA-1 with peptide (A) are stable even if a collision energy parameter of 80 V (max ⫽ 120 V) is applied. Secondly, the intensity ratio between the free protein and the aggregates is charge state dependent (Figure 2c): the higher the charge state, the higher the nonspe-cific adducts intensity. While fluorescence polarization competition assay showed that inhibitor (A) (KI ⫽ 3.0 M) is a tighter binder than peptide (2) (KI⫽ 7.5 M), we observed that peak intensities of [NCoA-1– cyclopeptide (A)] complex are lower than those of [NCoA-1⬎–peptide (2)] complex (Figure 3). Therefore, clearly without any quantification of the nonspecific gas-phase interactions, no direct results on the relative KDcan be obtained.
To estimate the nonspecific binding, we first focused on the methodology developed by Klassen et al. [16], consisting on the analysis of noncovalent complexes, which result only from gas-phase interactions between a ligand and a model protein. The principal assumption is that the peak distribution of complex resulting from nonspecific interactions should proceed independently from the size and the structure of the protein (NCoA-1 and the model protein). Therefore, we mixed inhibitor (B) (60 M) with three different reference model pro-teins (myoglobin, lactalbumin, or lysozyme at 6 M final concentration). Inhibitor (B) was chosen as a test compound because of its very low affinity for NCoA-1
Figure 3. NanoESI spectrum of the noncovalent complexes be-tween NCoA-1 (6M), peptide (A) (20 M) and peptide (2) (20 M). Filled triangle and filled square correspond to the peptides (A) and (2), respectively.
Figure 4. NanoESI spectra of the nonspecific noncovalent complexes between (a) myoglobin (6M), (b) lactalbumin (6M), or (c) lysozyme (6 M) and peptide (B) (60 M). Filled square corresponds to the ligand.
(KD⬎ 40M determined by fluorescence polarization) in solution. Figure 4 shows the results obtained for myoglobin, lactalbumin, and lysozyme (Figure 4a, b, and c, respectively). For myoglobin (MW⬃17,600 Da) and lactalbumin (MW⬃14,200 Da), nonspecific com-plexes were observed for the highest charge state, i.e., 8 and 7, respectively. Moreover, the intensity ratio be-tween the free and the bound fraction of protein was 10:1 for myoglobin but only 3.5:1 for lactalbumin. For lysozyme (MW⬃14,300 Da), which has a molecular weight similar to that of lactalbumin but a completely different amino acid sequence, nonspecific complexes were observed for the charge states 8 and 7. For the charge state 8, we observed one or two molecules of (B) binding to the protein, whereas only a complex with a 1:1 stoichiometry was detected for the charge state 7. Thus, for all reference proteins, as well for NCoA-1, a charge state dependence of the peak intensities of the nonspecific complexes exists. Our observations suggest that the stability of the nonspecific complexes is related to the structure of the protein, which means that the main assumption of Klassen et al. is not valid. Klassen’s method was developed and validated with protein– sugar complexes. Sugars are neutral components and the possible noncovalent interactions with a binding partner should only involve dipole interactions. How-ever, for cyclopeptide (B), we have strong evidence that
electrostatic forces are involved in the nonspecific gas-phase interactions with proteins, which apparently cre-ates quite a different situation.
Competition Assay Using Myoglobin as
Internal Standard
To measure affinities of some noncovalent [NCoA-1– cyclopeptide] complexes, even when ligands form non-specific gas-phase interaction with the protein, we fo-cused on a new competition assay consisting on the analysis of the peak intensity of the reference [NCoA-1– peptide (2)] complex. Since the linear peptide (2) (KD⫽ 7.5 M) does not exhibit any nonspecific interaction with NCoA-1, even at high concentration, we decided to use it as reference ligand. Intensities are calibrated with the signal of myoglobin, used as internal standard. Myoglobin was chosen because of its very low affinity in solution as well in gas phase for peptide (2) and for cyclopeptides. Its concentration was fixed to 5 M. Therefore, since formation of nonspecific complexes with myoglobin is very limited, the peak intensity ratio between [NCoA-1– peptide (2)] complex and myoglo-bin should be linearly correlated to the fraction of NCoA-1 bound to peptide (2). In a competition assay, displacement of the peptide (2) from NCoA-1 by any inhibitor should result in a decrease of this ratio. The
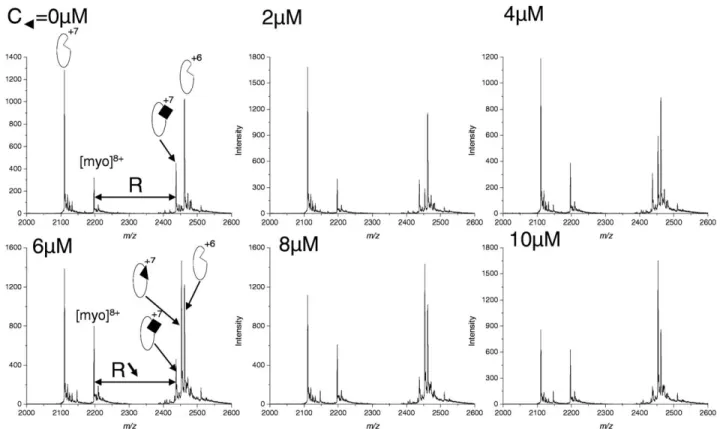
Figure 5. NanoESI spectra obtained for the competitive binding assay using the noncovalent complex NCoA-1(6M):peptide (2) (20 M) as probe and increasing concentration of peptide (1) (0 –10M). Myoglobin at a 5 M concentration is used as internal standard. Filled triangles and filled squares correspond to peptide (1) and peptide (2), respectively.
concentration (IC50) of the inhibitor, which is required for 50% displacement of peptide (2) from NCoA-1, could be determined from the dependence of this ratio on inhibitor concentration. Finally, the dissoci-ation constant (KD) of the [NCoA-1– cyclopeptide] complex could be calculated from the IC50 values using the general Cheng-Prusoff equation described by Nikolovska-Coleska [23].
Validation of the method was first performed on linear peptide (1) as inhibitor, which did not show any nonspecific interaction with NCoA-1. The concentra-tions of peptide (2), NCoA-1 and myoglobin were fixed at 20M, 6 M, and 5 M, respectively.Figure 5shows the spectra obtained at different concentrations of pep-tide (1) (from 0 to 10 M). Whatever peptide (1) concentration, myoglobin did not exhibit any nonspe-cific interactions with peptide (1) and/or peptide (2). Since the peak intensity corresponding to the charge state 8⫹of myoglobin remained similar for all samples, the fraction of NCoA-1 bound to peptide (2) was correlated to the peak ratio of [NCoA-1–peptide (2)] complex (charge state 7) versus myoglobin (charge state
8⫹). After normalization, data were plotted versus the logarithm of peptide (1) concentration and fitted to a sigmoid equation to determine the IC50value (IC50⫽ 4.2M) (SupplementalFigure 1a, which can be found in the electronic version of this article). KDcalculated from IC50value was 299⫾ 20 nM, which is very close to the KD value obtained by fluorescence polarization (KD ⫽ 260 nM)[22].
We then tested our methodology on inhibitors (A), (B) and (C). The concentrations of peptide (2), NCoA-1 and myoglobin were fixed at 20, 6, and 5 M, respec-tively. Each cyclopeptide gave some adducts with NCoA-1 in 1:1 and 1:2 protein:ligand stoichiometries (Figure 6). Nevertheless, whatever cyclopeptide concen-trations (0 to 40M), any nonspecific interactions with myoglobin and [NCoA-1–peptide (2)] complex were detected. Thus, the fraction of NCoA-1 bound to pep-tide 2 was correlated to the peak ratio of [NCoA-1– peptide (2)] complex versus myoglobin. After data normalization and fitting to a sigmoidal equation, IC50 values (Supplementary Figure 2) of inhibitors (A) and (C) were estimated to 11.3 M and 23.5 M,
corre-Figure 6. NanoESI spectra obtained for the competitive binding assay using the noncovalent complex NCoA-1(6M):peptide (2) (20 M) as probe and increasing concentration of inhibitor (A) (0 – 40M). Myoglobin at a 5 M concentration is used as internal standard. Filled triangles and filled squares correspond to inhibitor (A) and peptide (2), respectively.
sponding to KDvalues of 2.2 M and 5.6 M, respec-tively. These values are in good agreement with fluo-rescence polarization measurements (KD ⫽ 3 and 12.1 M, respectively). For inhibitor B, we also confirmed its low affinity for NCoA-1 (KD⬎ 20M).
By using peptide (2) as reference compound, we were able to determine KDvalues from 0.1 to 20M that showed a very good correlation with liquid phase measurements. However for a stronger ligand, another reference compound would have to be chosen. To extend the affinity range that we can measure, we propose to use peptide (1) (KD⫽ 299 nM) as reference peptide. Validation of this new probe was done with the N-acetylated linear peptide (6) that includes resi-dues Gly783-Gly814 of STAT6, as competitor. The con-centrations of peptide (1), NCoA-1 and myoglobin were fixed at 20, 6, and 5 M, respectively. After data normalization and fitting to a sigmoid equation (Sup-plementalFigure 1B), the IC50values of peptide (6) was estimated to be 4M, corresponding to a KDof 17 nM, which is again in good agreement with reported fluo-rescence polarization data (KD⬃ 40 nM)[22]. It must be noted that such low KDvalues that are lower than 2 to 3 orders of magnitude of the concentrations used in experiments are usually difficult or impossible to mea-sure by direct titration using nanoESI-MS[27].
Conclusions
The potential of mass spectrometry for direct analysis of complex biological samples has been extensively dem-onstrated. In particular, because of its high sensitivity and selectivity, nano-ESI MS becomes a real alternative for quantitative analysis and monitoring [protein– ligand] binding. However, the study of protein–ligand noncovalent complexes requires careful control of ex-perimental parameters since desolvation/ionization mechanisms involved in ESI can complicate the analy-sis. We reported in the present study a new nano-ESI MS competition assay, which is of value to determine the affinity of weak protein–ligand complexes, even when nonspecific electrostatic interactions are exhibited in gas phase. The measurement of KD values, in good agreement with results obtained by an independent fluorescence polarization assay, confirms that when the reference ligand and the internal standard are properly selected, the method can be implemented for many different types of noncovalent complexes. Finally, au-tomation of sample preparations and data acquisition should allow accessing to a medium or even high-throughput screening assay to find inhibitor of [protein– protein] interaction.
Acknowledgments
The authors thank the Novartis Institutes for BioMedical Research (NIBR) for financial support. They thank Dr. Daniel Obrecht at Polyphor AG for collaboration on the design of the NCoA/STAT6 inhibitors.
References
1. Hensley, P. Defining the Structure and Stability of Macromolecular Assemblies in Solution: The Re-emergence of Analytical Ultracentrifu-gation as a Practical Tool. Structure 1996, 4, 367–373.
2. Fenn, J. B.; Mann, M.; Meng, C. K.; Wong, S. F.; Whitehouse, C. M. E. Electrospray Ionization for Mass Spectrometry of Large Biomolecules.
Science 1989, 246, 64 –71.
3. Ganem, B.; Li, Y. T.; Henion, J. D. Observation of Noncovalent Enzyme-Substrate and Enzyme-Product Complexes by Ion-Spray Mass Spec-trometry Observation of Noncovalent Substrate and Enzyme-Product Complexes by Ion-Spray Mass Spectrometry. J. Am. Chem. Soc. 1991,113, 7818 –7819.
4. Loo, J. A. Studying Noncovalent Protein Complexes by Electrospray Ionization Mass Spectrometry. Mass Spectrom. Rev. 1997, 16, 1–23. 5. Wang, W. J.; Kitova, E. N.; Klassen, J. S. Determination of
Protein-Oligosaccharide Binding by Nanoelectrospray Fourier-Transform Ion Cyclotron Resonance Mass Spectrometry. Methods Enzymol. 2003, 362, 376 –397.
6. Daniel, J. M.; McCombie, G.; Wendt, S.; Zenobi, R. Mass Spectrometric Determination of Association Constants of Adenylate Kinase with Two Noncovalent Inhibitors. J. Am. Soc. Mass Spectrom. 2003, 14, 442– 448. 7. Gabelica, V.; Galic, N.; Rosu, F.; Houssier, C.; De Pauw, E. Influence of
Response Factors on Determining Equilibrium Association Constants of Noncovalent Complexes by Electrospray Ionization Mass Spectrometry.
J. Mass Spectrom. 2003, 38, 491–501.
8. Ashcroft, A. E. Recent Developments in Electrospray Ionization Mass Spectrometry: Noncovalently Bound Protein Complexes. Nat. Prod. Rep. 2005,22, 452– 464.
9. Robinson, C. V.; Chung, E. W.; Kragelund, B. B.; Knudsen, J.; Aplin, R. T.; Poulsen, F. M.; Dobson, C. M. Probing the Nature of Noncovalent Interactions by Mass Spectrometry. A Study of Protein-CoA Ligand Binding and Assembly. J. Am. Chem. Soc. 1996, 118, 8646 – 8653. 10. Peschke, M.; Verkerk, U. H.; Kebarle, P. Features of the ESI Mechanism
that Affect the Observation of Multiply Charged Noncovalent Protein Complexes and the Determination of the Association Constant by the Titration Method. J. Am. Soc. Mass Spectrom. 2004, 15, 1424 –1434. 11. Wang, W.; Kitova, E. N.; Klassen, J. S. Nonspecific Protein–
Carbohydrate Complexes Produced by Nanoelectrospray Ionization. Factors Influencing their Formation and Stability. Anal. Chem. 2005, 77, 3060 –3071.
12. Wang, W.; Kitova, E. N.; Sun, J.; Klassen, J. S. Blackbody Infrared Radiative Dissociation of Nonspecific Protein–Carbohydrate Com-plexes Produced by Nanoelectrospray Ionization: The Nature of the Noncovalent Interactions. J. Am. Soc. Mass Spectrom. 2005, 16, 1583–1594. 13. Pinkse, M. W. H.; Heck, A. J. R.; Rumpel, K.; Pullen, F. Probing Noncovalent Protein–Ligand Interactions of the cGMP-Dependent Pro-tein Kinase Using Electrospray Ionization Time of Flight Mass Spec-trometry. J. Am. Soc. Mass Spectrom. 2004, 15, 1392–1399.
14. Sundquist, G.; Benkestock, K.; Roeraade, J. Investigation of Multiple Binding Sites on Ribonuclease A Using Nanoelectrospray Ionization Mass Spectrometry. Rapid Commun. Mass Spectrom. 2005, 19, 1011–1016. 15. Daubenfeld, T.; Bouin, A. P.; van der Rest, G. A Deconvolution Method for the Separation of Specific Versus Nonspecific Interactions in Non-covalent Protein–Ligand Complexes Analyzed by ESI-FT-ICR Mass Spectrometry. J. Am. Soc. Mass Spectrom. 2006, 17, 1239 –1248. 16. Sun, J.; Kitova, E. N.; Wamg, W.; Klassen, J. S. Method for
Distinguish-ing Specific from Nonspecific Protein–Ligand Complexes in Nanoelec-trospray Ionization Mass Spectrometry. Anal. Chem. 2006, 78, 3010 – 3018.
17. Hebenstreit, D.; Wirnsberger, G.; Horejs-Hoeck, J.; Duschl, A. Signaling Mechanisms, Interaction Partners, and Target Genes of STAT6. Cytokine
Growth Factor Rev. 2006, 17, 173–188.
18. Bruns, H. A.; Kaplan, M. H. The Role of Constitutively Active Stat6 in Leukemia and Lymphoma. Crit. Rev. Oncol. Hematol. 2006, 57, 245–253. 19. Litterst, C. M.; Pfitzner, E. Transcriptional Activation by STAT6 Re-quires the Direct Interaction with NCoA-1. J. Biol. Chem. 2001, 276, 45713– 45721.
20. Foster, P. S. STAT6: An Intracellular Target for the Inhibition of Allergic Disease. Clin. Exp. Allergy 1999, 29, 12–16.
21. Popescu, F. D. New Asthma Drugs Acting on Gene Expression. J. Cell.
Mol. Med. 2003, 7, 475– 486.
22. Seitz, M.; Maillard, L.; Obrecht, D.; Robinson, J. A. Molecular Charac-terization of the NCoA-1–STAT6 Interaction. Chem. Biochem. 2008, 9, 1318 –1322.
23. Nikolovska-Coleska, Z.; Wang, R.; Fang, X.; Pan, H.; Tomita, Y.; Li, P.; Roller, P. P.; Krajewski, K.; Saito, N. G.; Stuckey, J. A.; Wang, S. Development and Optimization of a Binding Assay for the XIAP BIR3 Domain Using Fluorescence Polarization. Anal. Biochem. 2004, 332, 261–273.
24. Litterst, C. M.; Pfitzner, E. An LXXLL Motif in the Transactivation Domain of STAT6 Mediates Recruitment of NCoA-1/SRC-1. J. Biol.
Chem. 2002, 277, 36052–36060.
25. Razeto, A.; Ramakrishnan, V.; Litterst, C. M.; Giller, K.; Griesinger, C.; Carlomagno, T.; Lakomek, N.; Heimburg, T.; Lodrini, M.; Pfitzner, E.; Becker, S. Structure of the NCoA-1/SRC-1 PAS-B Domain Bound to the
LXXLL Motif of the STAT6 Transactivation Domain. J. Mol. Biol. 2004,
336, 319 –329.
26. Daniel, J. M.; Friess, S. D.; Rajagopalan, S.; Wendt, S.; Zenobi, R. Quantitative Determination of Noncovalent Binding Interactions Using Soft Ionization Mass Spectrometry. Int. J. Mass Spectrom. 2002, 216, 1–27.
27. Mathur, S.; Badertscher, M.; Scott, M.; Zenobi, R. Critical Evaluation of Mass Spectrometric Measurement of Dissociation Constants: Accuracy and Cross-Validation Against Surface Plasmon Resonance and Circular Dichroism for the Calmodulin-Melittin system. Phys. Chem., Chem. Phys.
![Table 1. Monoisotopic masses and K D values obtained by fluorescence polarization assay and by mass spectrometry for the STAT6- STAT6-derived peptides Sequences Monoisotopicmass (Da) K I obtained by fluorescencepolarization assay ( M) [22] K I obtainedhe](https://thumb-eu.123doks.com/thumbv2/123doknet/14871919.640278/2.918.94.825.973.1110/monoisotopic-fluorescence-polarization-spectrometry-sequences-monoisotopicmass-fluorescencepolarization-obtainedhe.webp)