Myocardial perfusion imaging by cardiac
magnetic resonance
Juerg Schwitter, MDa,b,c
Cardiovascular magnetic resonance (CMR) has been shown to provide high quality data on cardiac and valvular function, perfusion, viability, blood flow, and potentially, on cardiac metabolism as well. Several of these CMR applications (eg, function and viability assessment) matured during the past years and are now established components of a cardiac workup. Perfusion-CMR is close to this status and is already a major contributor to cardiac examinations in a growing number of expert centers. Large multicenter perfusion-CMR trials comparing the diagnostic performance of CMR with other techniques were recently reported yielding areas under the receiver-operator-characteristics curve as a high as 0.85 for coronary artery disease detection (MR-IMPACT). Anticipating a growing role for perfusion-CMR in cardiology in the near future, this article discusses the principles of perfusion-CMR and its integration into the workup of patient with coronary artery disease (CAD). In addition to a functional study, this integration is mainly composed of a perfusion-CMR part, followed by a viability assessment by late enhancement CMR techniques. The principal characteristics of these CMR techniques are compared with those of single photon emission computed tomography (SPECT) and positron emission tomography (PET). After introduction into principles and techniques of perfusion-CMR, some open questions in perfusion-CMR and challenges for the future are addressed. Finally, newer CMR applications are shortly mentioned utilizing hyperpolarized carbon-13 compounds in experimental models for quantification of myocardial perfusion and for real-time assessment of metabolic pathways in postischemic myocardium. (J Nucl Cardiol 2006;13: 841-54.)
For more than 100 years, cardiovascular disease has been the number one cause of death in the United States, and coronary artery disease (CAD) is by far the most important contributor to this disease burden. Large stud-ies using scintigraphic techniques are the major source of evidence demonstrating the importance of the severity and extent of ischemia for the patients’ prognosis.1-3In thousands of patients with risk factors but normal scin-tigrams, the prognosis is excellent,1,2 which is in line with invasive studies, which showed an event rate of 1.1%/y in the mid 1980s for patients with angiograms with stenoses of 50% or less in diameter.4 Taking advantage of the prognostic information provided by the scintigraphic examinations, it was shown that costs for patient management could be reduced by 30% to 40% without any compromise in the quality of outcome when
a noninvasive single photon emission computed tomog-raphy (SPECT) approach was applied first in comparison to a direct invasive approach.5 These considerations underline the paramount importance of perfusion assess-ment for patient workup and decision making.
PRINCIPLES OF ISCHEMIA AND VIABILITY IMAGING: COMPARISON OF CARDIAC MAGNETIC
RESONANCE WITH SCINTIGRAPHIC TECHNIQUES For the assessment of myocardial perfusion, perfu-sion– cardiac magnetic resonance (CMR) typically exploits the first-pass kinetics of conventional T1-enhancing
extra-cellular gadolinium chelates. This concept has been ap-plied first in animals6-8 and consequently in human beings.9,10 The magnetic resonance (MR) contrast me-dium (CM) enters the microvasculature and also starts to diffuse within the interstitial space during the first pass.11,12As a result, the signal intensity of the myocar-dium increases, the rate of which is linked to the perfusion status of the tissue. Accordingly, normally perfused myocardium demonstrates a fast signal increase per unit time in the vasodilated state, whereas signal increase is delayed in myocardium supplied by a criti-From the Cardiology Clinics,a and Cardiac MR Center, University
Hospital Zurich,b and Children’s University Hospital,c Zurich,
Switzerland.
Reprint requests: Juerg Schwitter, MD, Cardiology Clinics, University Hospital Zurich, Raemistrasse 100, CH-8091 Zurich, Switzerland; juerg.schwitter@usz.ch.
1071-3581/$32.00
Copyright © 2006 by the American Society of Nuclear Cardiology. doi:10.1016/j.nuclcard.2006.09.008
cally stenosed coronary artery. Because the first pass lasts only a few seconds, the data acquisition can be completed within a breath-hold, which efficiently elimi-nates respiratory motion. In addition, the MR data collection is electrocardiography (ECG)–triggered, which eliminates cardiac motion. Together, breath-hold-ing and ECG-triggerbreath-hold-ing preserve the nominally high spatial resolution for perfusion data on the order of 1.5 to 2.5 mm ⫻ 1.5 to 2.5 mm. This excellent spatial resolu-tion allows for discriminaresolu-tion of perfusion deficits that are limited to the vulnerable subendocardial layer of the left ventricular myocardium.10,13,14 For compari-son, in SPECT imaging technetium 99m–labeled tracers generally accumulate in viable myocytes in relation to tissue perfusion, demonstrating normally perfused myo-cardium as hot tissue, whereas hypoperfused areas ap-pear as cold spots similar to the perfusion-CMR situation (Figure 1). Once areas with reduced perfusion during hyperemia are recognized, it is important to discriminate hypoperfused scar tissue from hypoperfused but viable myocardium (ie, ischemic tissue). For this purpose, both CMR and SPECT imaging are based on the redistribu-tion of CM. For CMR, the technique is called late enhancement (LE) or delayed enhancement (DE), and it measures the accumulation of CM within the expanded interstitial space present in scar tissue. SPECT measures the redistribution of CM (ie, radiolabeled tracer) into viable myocytes, delineating scar as a cold spot after rest-injection or rest-reinjection (Figure 1). For CMR, the conventional gadolinium chelates are excluded from intact cell membranes and therefore are restricted to a small distribution volume of approximately 20% in viable myocardium. In scar tissue and particularly in acute myocyte necrosis the distribution volume may increase up to 100%.15,16 Consequently, with LE- or DE-CMR imaging, scar and acute myocardial necrosis appear as bright tissue. Thus both CMR and SPECT imaging assess perfusion during a vasodilated state (ie, stress imaging or a CMR stress-only protocol) and compare hyperemic perfusion data with a reference (ie, a normal database or a normal segment of the studied heart). For viability imaging, both CMR and SPECT detect scar and necrosis by means of redistribution imaging after a resting (re)injection.
An alternative to the CMR stress-only protocol has been proposed for ischemia detection, in which CMR perfusion data acquired during vasodilation are divided by resting perfusion data (stress-rest protocol) to derive coronary flow reserve (CFR).17 This strategy is the analog for the positron emission tomography (PET) perfusion approach, in which compromised CFR is indicative of the presence of CAD.10,18-22 For viability imaging, PET is not relying on redistribution of a flow tracer but directly probes preserved cellular metabolism,
for example, by the membrane transport and trapping of fluorine 18 fluorodeoxyglucose (FDG). Here, the CFR concept of CMR (ie, stress-rest protocol) requires addi-tional redistribution imaging—that is, an LE- or DE-CMR imaging approach for viability assessment (Figure 1). A CMR and PET example is given in Figure 2. The analog for viability FDG-PET imaging is then the bination of CMR with hyperpolarized carbon 13 com-pounds, which is currently applied successfully in animal studies.23 With a variety of hyperpolarized C-13 com-pounds, it will be possible to visualize and quantify the crucial metabolic pathways in the myocytes and thereby to characterize their metabolic state.
For the assessment of myocardial perfusion (ie, the detection of reduced hyperemic perfusion), 2 CMR approaches are currently under consideration, involving either assessment of hyperemic perfusion only (stress-only protocol) or assessment of CFR (stress-rest proto-col). Future studies are warranted to identify the ideal approach. Whereas the first approach (ie, stress-only protocol) requires a normal database to provide threshold values for the hyperemic flow state, the CFR approach incorporates measurements of resting flow. Division of hyperemic flow by resting flow may become problem-atic, considering that factors such as heart rate, contrac-tility, and loading conditions influence resting flow but are difficult to control during a clinical routine examina-tion.24 Furthermore, matching myocardial regions for both resting and hyperemic conditions may be difficult (because the geometry of the heart changes with chang-ing heart rate, loadchang-ing, and so on). Most importantly, the CMR technique must guarantee a linear relationship between MR-derived perfusion parameters and true per-fusion over a wide range of conditions (ie, resting and hyperemic conditions) to obtain accurate CFR results. Recently, the stress-rest protocol was advocated to help discriminate artifacts from true perfusion deficits,25 in that a signal loss being present on both the rest and stress perfusion studies but not matching a bright “scar” signal on LE-CMR would indicate the presence of an artifact. Although such a decision algorithm could be of help in low-quality examinations to detect artifacts, it is clearly suggested to improve the MR pulse sequences to reduce the frequency of artifacts (as also discussed in the sections entitled “Acquisition of perfusion data by CMR” and “Contrast media: Types and doses”). An example of a perfusion and anatomic abnormality in a patient with atypical chest pain is given inFigure 3.
ACQUISITION OF PERFUSION DATA BY CMR Magnetization Preparation
Today, most experience exists for the first-pass approach involving T1-enhancing MR CM. To increase
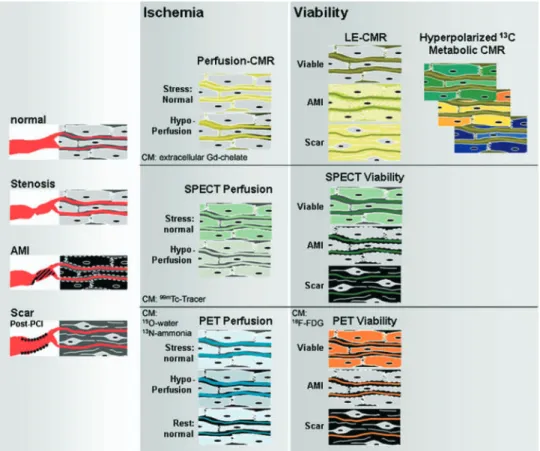
Figure 1. Mechanisms for CMR imaging considering a T1-weighted sequence and a conventional T1-enhancing CM (MR CM) (top row), scintigraphy (SPECT) (middle row), and PET (bottom row) for the assessment of myocardial perfusion (middle column) and viability (right column). In the left
column, the 4 main conditions of myocardium are depicted: normal (nonischemic) myocardium,
ischemic myocardium, and acute necrotic tissue representing acute myocardial infarction (AMI), as well as its sequelae, chronic scar tissue. In these schematics the extracellular compartment contains intravascular (plasma) and extravascular space (ie, interstitium). In chronic scar tissue the small fibrocytes are embedded within a large extracellular (ie, interstitial) space. The middle column demonstrates perfusion assessment. For CMR, in normally perfused myocardium the MR CM distributes within the extracellular compartment during the first pass, causing signal increase. In hypoperfused myocardium first-pass wash-in kinetics is delayed and signal increase is slow. For SPECT (middle row), radiolabeled tracer is trapped within viable myocytes in relation to perfusion; that is, less tracer accumulation occurs in hypoperfused, ischemic tissue, which appears as a cold spot. In scar and acute necrotic tissue slow wash-in occurs for both radiotracer and MR CM. For viability assessment (right column), equilibrium distribution is required for both radiotracer and MR CM. For MR CM, the distribution volume in AMI and scar tissue is large, with a consequent high concentration of MR CM in both necrotic and scar tissue appearing bright on LE-CMR imaging (with inversion time nulling viable myocardium). For SPECT, radiotracer is not accumulated either in AMI or in fibrocytes, and necrosis and scar appear as a cold spot (ie, fixed defect), whereas the radiotracer accumulates in viable myocytes of ischemic myocardium, yielding a hot spot (ie, reversible defect). Of importance, the combination of perfusion-CMR and LE-CMR is the analog of the classical combined SPECT stress and redistribution resting study. The combined perfusion-viability CMR study is short, because equilibrium distribution is typically achieved within 15 to 20 minutes. In addition, data acquisition by CMR lasts only a few seconds, allowing breath-holding and ECG-triggering to be used, which preserves a high spatial resolution of both the perfusion and viability CMR data. For ischemia assessment by PET, typically, a stress (ie, hyperemic) study and a resting perfusion study are performed by use of N-13 ammonia or oxygen 15 water flow tracers, and a reduced perfusion reserve is indicative of a compromised blood supply to a given myocardial territory. This PET approach is adopted by the first-pass stress and rest perfusion-CMR approach (stress-rest protocol), yielding a perfusion reserve index. The viability assessment then requires an additional LE-CMR study, which corresponds to the FDG-PET study. Whereas FDG-PET probes glucose transport, hyperpolarized C-13 CM with CMR allows for monitoring (eg, Krebs cycle) in near real time.
the sensitivity of the pulse sequence for changing CM concentrations, the magnetization may be prepared before data readout occurs. In the past an inversion recovery preparation was most often used,6,8,9,17,26-28 because it provides a large dynamic range of signal response, theoretically from negative to positive longi-tudinal magnetizations⫺Mzto⫹Mz. However, in
prac-tice the delay time from preparation to readout was selected to obtain near-zero magnetization before the start of readout, which required 300 to 400 milliseconds
of waiting time, thus precluding true multislice imaging. Therefore the currently accepted preparation is a satura-tion recovery approach, which renders the signal re-sponse independent of heart rate variations and further shortens the waiting time down to 100 to 200 millisec-onds.10,29-35 It should be noted at this point that the selection of the optimum delay time should not only optimize signal response for the expected changes in CM concentration during the first pass but also locate the window for data readout into phases of the cardiac Figure 2. An example of a CMR and PET study in a 55-year-old man with atypical chest pain.
First-pass perfusion-CMR (A) demonstrates a large subendocardial perfusion deficit (dark area) in the anterolateral, septal, and inferior wall of the left ventricle, whereas the subepicardial layer and lateral wall are perfused normally (bright area). Correspondingly, on the N-13 ammonia PET study (B), only the lateral wall is normally perfused during hyperemia. C, A polar map is reconstructed from the perfusion-CMR study, where the normal ranges for upslope values in each segment were derived from receiver operating characteristic curves (for the detection ofⱖ50% diameter stenoses).
D, LE-CMR study in this patient, visualizing subendocardial scar tissue (bright) in the anterior and
anteroseptal region, with a thrombus (black) attached to the infarcted territory. E, F-18 FDG–PET demonstrates severely reduced FDG uptake (ie, reduced viability) in the region of subendocardial scar. F, A polar map is reconstructed from the LE-CMR study, visualizing the distribution of subendocardial scar tissue (⬍50% transmurality) in the left ventricular myocardium. These CMR and PET findings are in good agreement with the invasive x-ray coronary angiography, demon-strating an occlusion (and collateral channels) of the proximal and mid left anterior descending coronary artery (LAD) (arrows in G), leading to a subendocardial infarction in the core of the supply territory of the LAD (D-F) and compromised hyperperfusion during vasodilation in the border zones (A-C). The inferior and inferoseptal region of compromised hyperperfusion during vasodilation in
A through C is caused by an additional stenosis at the crux of the right coronary artery (RCA) (arrow
cycle where motion is minimal. Data acquisition in late systole and mid diastole is typically achieved with a delay time of 100 to 150 milliseconds.10,29
Data Readout Strategies
Because the prognosis of patients is dependent on the extent of perfusion deficits, the aim of perfusion-CMR is to cover the relevant portions of the myocardium. In addition, to obtain signal intensity–time curves from which perfusion parameters can be derived, it is suggested to achieve a temporal resolution of 1 stack covering the left ventricular myocardium being acquired every 1 to 2 RR intervals. These conditions demonstrate that very fast data acquisition is crucial for perfusion imaging. One such fast approach is called echo-planar imaging (EPI), which describes the acquisition of a full k-space (required to reconstruct 1 single image) after a single radiofrequency excitation. In contrast, with a conventional fast gradient echo approach, 1 radiofrequency excitation is required
for every line in k-space (eg, 256 excitations for a matrix of 256⫻ 256). Single shot EPI is very fast, but its relatively long echo time renders the sequence prone to susceptibility arti-facts.36Therefore a hybrid-EPI approach appears to be ideal, in which 4 to 8 k-lines per radiofrequency excitation are acquired.10,32-34,37Steady-state free precession pulse se-quences preserve magnetization and are particularly promising with respect to a high signal-to-noise ratio (SNR) but may suffer from other disadvantages because of the relatively long acquisition windows, as shown in Figure 4. Alternatively, parallel imaging techniques can be combined with perfusion imaging.38These techniques acquire data from folded fields of view and resolve wraparound artifacts by taking into account the different spatial sensitivities of various coil elements.39In general, parallel imaging techniques trade the SNR for speed of acquisition. However, meticulous optimization of other imaging parameters can minimize this disadvantage.38 These parallel imaging approaches can be combined with Figure 3. Example of images in a 47-year-old man with rare atypical chest pain and a positive
treadmill test. The first-pass perfusion-CMR study shows an extensive area of compromised hyperperfusion during hyperemia in the subendocardial layer of the anterolateral wall and the interventricular septum as marked by the arrowheads (A-C). In D through F, the time series during the first pass of the CM in the most basal slice is shown. It demonstrates CM first appearing in the right atrium and the right ventricular outflow tract but also in the coronary sinus (D), whereas the left ventricular cavity is not contrasted. CM then enters the left ventricular cavity (E) and finally washes out of the coronary sinus and right atrium (F). This sequence of CM arrival is explained by the rare case of an agenesis of the superior vena cava (G). The venous return of the upper body drains into a persistent left superior vena cava, which finally enters the coronary sinus. This example demonstrates the ability of CMR to provide important anatomic information in addition to high-resolution perfusion information.
techniques that exploit spatiotemporal correlations in k-t–space, which results in even higher acceleration factors. Techniques such as k-t BLAST (Broad-use Linear Acquisition Speed-up Technique) and k-t SENSE (SENSitivity Encoding)40achieve high acceleration fac-tors but might demonstrate higher susceptibility to mo-tion and could smooth temporal informamo-tion. Thus future studies will be needed to assess the potential of these newer techniques.
Besides selection of the optimal pulse sequence for fast perfusion data acquisition, the imaging parameters for a given pulse sequence are crucial with respect to the
SNR and contrast-to-noise ratio (CNR), spatial and temporal resolution, and cardiac coverage. It could be demonstrated that for a given hybrid-EPI pulse sequence, the signal change during the first pass can range from 70% up to 280% of baseline signal, which translated into an acceptable diagnostic performance for the optimized imaging parameters, yielding a sensitivity and specificity of 82% and 73%, respectively, for detection of stenoses of 50% or greater in diameter (for transmural data), whereas the original pulse sequence37yielded a clinically not useful performance, with a sensitivity and specificity of 71% and 43%, respectively.29
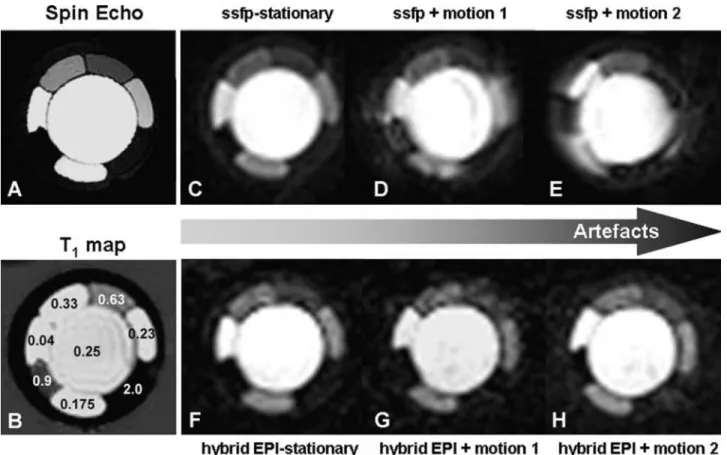
Figure 4. Effect of different MR pulse sequences for perfusion imaging on image quality. The
spin-echo image on the left (A) represents a heart phantom containing compartments of different concentrations of a conventional extracellular gadolinium chelate, with the highest concentration in the core of the phantom mimicking the left ventricular blood pool and compartments of lower concentrations mimicking normal and hypoperfused myocardium. Corresponding T1 values (in seconds) are given in B. High image quality is obtained by use of a steady-state free precession (ssfp) pulse sequence (acquisition window, 212 milliseconds; spatial resolution, 3 ⫻ 3 mm2;
non–slice-selective 90° preparation; readout flip angle, 25°; 1.5 T) (Philips Medical Systems, Best, Netherlands) (C), which degrades steadily with increasing combined translational-rotational motion (motion 1 and 2 in D and E, respectively). Conversely, a hybrid-EPI pulse sequence (acquisition window, 91 milliseconds; spatial resolution, 3 ⫻ 3 mm2; non–slice-selective 90° preparation;
readout flip angle, 30°) shows moderate quality at rest (F), which does not deteriorate, however, with increasing motion (G and H). This example demonstrates that pulse sequences not only differ in the signal-CM concentration relationship but can also differ in their susceptibility for motion-induced artifacts. Phantom measurements were performed together with Salome Ryf, PhD, Roger Luechinger, PhD, and Sebastian Kozerke, PhD, Institute of Biomedical Engineering of the Federal Institute of Technology, Zurich, Switzerland.
Field Strengths
Because fast imaging is inherently coupled to a lower SNR, a higher field strength is theoretically advantageous. At present, very limited data on perfusion-CMR at 3 T are available, whereas all larger studies and, in particular, all multicenter trials are performed on 1.5-T magnets.33,34,41In a small study by Araoz et al42the CNR between baseline and peak contrast at 3 T was superior to 1.5 T. However, the CNR at 3 T was less homogeneously distributed within the left ventricular myocardium with a lower ratio in the inferior wall. This part of the heart is typically exposed to some magnetic field inhomogeneities, which appear more relevant at 3 T.
CONTRAST MEDIA: TYPES AND DOSES Extravascular CM
For scintigraphic techniques, there is a well-defined relationship between tracer activity and tracer concentra-tion (when the tracer decay time is considered), which is one reason for PET to generate quantitative results on perfusion and metabolism. For SPECT imaging, the signal (ie, tracer activity) and tracer amount are linear, though distorted to some extent by attenuation and scatter. For CMR, the relationship between the MR signal and the CM concentration is not linear. For T1-enhancing CM, the signal increases with increasing
concentrations up to a maximum and declines thereafter at higher CM concentrations.43In addition, the shape of this curve is dependent on the pulse sequence and imaging parameters. For example, at lower T1-enhancing
concentrations of a conventional gadolinium chelate, myocardial signal increases during the first pass when acquired with a T1-weighted pulse sequence, delineating
hypoperfused myocardium as dark areas. Conversely, at higher concentrations of the same CM, signal acquisition with a T2-weighted pulse sequence causes a signal drop
during the first pass, delineating hypoperfused myocar-dium as bright tissue.44 In addition, the distribution pattern of CM within the myocardium may affect the signal generation. Saeed et al took advantage of this phenomenon and could demonstrate a loss of cell mem-brane integrity using a dysprosium chelate combined with a T2*-weighted pulse sequence.
45
When concentrat-ing on the gadolinium chelates, which are currently the most important MR CM for clinical applications, we have to consider their mechanism of action. Gadolinium chelates facilitate relaxation (ie, recovery of longitudinal magnetization) by interaction with the surrounding water protons. This implies that, for example, gadolinium chelates outside the cellular compartment influence the intercellular concentration of relaxed water protons
through proton exchange over the cellular membrane. Besides the cellular membranes, the capillary vessel wall strongly affects the signal generation.46 Exchange con-ditions are categorized into fast, intermediate, and slow. Fast water exchange exists if the rate of water exchange between compartments is considerably higher than the difference in the longitudinal relaxation rate between the compartments in the presence of CM, and consequently, changes in the tissue relaxation rate reflect changes in the blood relaxation rate.47-49This is in contrast to the slow intravascular-extravascular water exchange, which is the rate-limiting step for signal generation in tissue (slow exchange regimen).47-49Thus neglecting water exchange for intravascular CM can result in considerable errors in perfusion measurements (for more details, see also ref-erence 12). These considerations may demonstrate that prediction of signal response during the first pass in hyperemic tissue by mathematic models is a difficult task and simulations will not be able to replace experiments where true signal responses for different CM types and doses are quantified.
The effect of increasing doses of a conventional extracellular gadolinium chelate (Gd– diethylenetriamine pentaacetic acid [DTPA]) on myocardial signal response was recently evaluated in a multicenter single-vendor study using the same hybrid-EPI pulse sequence on all machines.33 With doses starting at 0.05 mmol/kg body weight and increasing to 0.10 and 0.15 mmol/kg, an increasing signal response was observed with relative increases from baseline of approximately 100%, 200%, and 280%, respectively. In agreement with an earlier single-center study,29a signal increase of about 100% in the multicenter study yielded an unacceptable diagnostic performance, with an area under the receiver operating characteristic curve (AUC) of 0.51 ⫾ 0.13. Where high gradients of magnetization within the imaging volume occur, dephasing of the magnetization is increased and a signal loss is observed. Such high gradients of magneti-zation may build up at the blood pool–subendocardial interface during the first pass, when CM concentrations are high in the blood pool but are still low in the myocardium. This situation could cause cumbersome zones of signal loss at the subendocardial layer mimick-ing subendocardial hypoperfusion. This type of signal loss is called susceptibility artifact and might be propa-gated by high CM concentrations. It was therefore important to note that even at 0.15 mmol/kg of Gd-DTPA combined with a hybrid-EPI acquisition, no measurable signal loss and, consequently, no reduction in subendocardial upslope values were observed.33Thus 0.10 and 0.15 mmol/kg provided the advantage of a high signal change during the first pass without causing a measurable susceptibility artifact, resulting in an excel-lent AUC of 0.88 ⫾ 0.05 for the detection of CAD
defined as stenoses of 50% or greater in diameter on quantitative coronary angiography. Similarly, doses from 0.01 up to 0.10 mmol/kg Gd-DTPA– bismethylamdie (BMA) were evaluated in a multicenter, multivendor setting.41 This study, called MR-IMPACT (Magnetic Resonance Imaging for Myocardial Perfusion Assess-ment in Coronary artery disease Trial), is the largest perfusion-CMR trial performed thus far; it was per-formed in 18 centers worldwide and yielded the best diagnostic performance for the highest dose of 0.10 mmol/kg, with an AUC of 0.85 ⫾ 0.06.41 These multi-center trials33,41 and others10 indicate that doses of approximately 0.10 mmol/kg body weight of a gadolin-ium chelate for first-pass perfusion studies provide ap-propriate diagnostic performance.
Intravascular CM
These contrast media remain in the intravascular space during the first pass. However, as pointed out previously, they address extravascular water protons and are therefore not “pure” intravascular contrast media. In addition, even during brief episodes of ischemia, endo-thelial leakage occurs,50which “transforms” such intra-vascular contrast media into extraintra-vascular contrast me-dia. It is well known from experimental51 and clinical studies52 that during vasodilation, steal phenomena can induce ischemia; however, it might be difficult to iden-tify these areas a priori, with the consequence that models considering these effects are difficult to design.53 Nevertheless, T1-enhancing intravascular contrast media
such as albumin-targeted MS-32554or polylysine gado-linium55have been successfully applied in animal mod-els. Further testing in human beings is of course neces-sary for final assessment of the potential of intravascular CM for perfusion imaging. Intravascular netic iron oxide nanoparticles (ultrasmall superparamag-netic iron oxide) in combination with a T2-weighted
turbo spin-echo sequence were also used for perfusion studies in human beings, causing a signal drop in normally perfused myocardium.56However, these com-pounds are no longer under evaluation because of CM accumulation in the liver.
Hyperpolarized C-13 CM
At thermal equilibrium at a field strength of 1.5 T, the MR-active nuclei (ie, water protons) are present at only approximately 5 ppm, because of the very low polarization level. Thus the conventional gadolinium chelates are only acting on this low concentration of spins, which can be doubled by increasing the field strength to 3 T. Newer techniques now allow the polar-ization level of specific nuclei such as liquid C-13 in
various compounds to be increased by a factor of up to 100,000 (compared with polarization of water protons at thermal equilibrium). Techniques for hyperpolarization are known as para-hydrogen–induced hyperpolariza-tion57and dynamic nuclear polarization.58Para-hydrogen– induced hyperpolarization uses simpler equipment and is fast but is only applicable to smaller C-13 molecules, whereas dynamic nuclear polarization can be applied to all nuclei (hydrogen 1, C-13, nitrogen 15, and so on). The polarization degree of approximately 30% translates into a tremendous increase in signal if appropriate MR pulse sequences are applied. Unlike gadolinium chelates, hyperpolarized C-13 contrast media do not accelerate the relaxation rate of water protons, but the MR signal is directly emitted by the hyperpolarized C-13 CM. Con-sequently, no background signal would be acquired in perfusion studies, and most importantly, these hyperpo-larized C-13 contrast media act as pure intravascular contrast media, which would allow for easier quantifica-tion of perfusion. However, because the spin populaquantifica-tion of C-13 molecules is far away from thermal equilibrium, longitudinal magnetization decays with specific time constants (depending on the type of C-13 compound), which must be taken into account, similarly to radio-tracer decay. In addition, depolarization as a result of repetitive radiofrequency pulsing has to be considered, which further destroys longitudinal magnetization. Jo-hansson et al59 showed that depolarization can be ap-proximated by a monoexponential function and success-fully applied this concept for cerebral perfusion quantification. So far, these contrast media are only applied in animal experiments,59but preliminary results are encouraging. An example of a cardiac perfusion study using an intravascular C-13 compound is given in Figure 5.
PERFUSION DATA ANALYSES
This overview on technical aspects of perfusion-CMR together with the varieties in CM types and doses clearly demonstrates that perfusion-CMR today is not a single technique but is a rapidly evolving field of research, which now enters the clinical arena. It is therefore not surprising that this broad spectrum of perfusion-CMR is reflected in a similarly large spectrum of attempts to analyze the perfusion data. While the protocol (stress-only vs stress-rest) and the best MR pulse sequence with its optimum imaging parameters, as well as its appropriate CM type and dose, are not yet entirely established, the same holds for the data analyses currently proposed. To support development in the field of perfusion-CMR, it appears highly desirable to estab-lish some common definitions. This would allow for direct comparison of the results of novel approaches or
modifications of currently available techniques reported in different publications. For this purpose, a visual assessment of perfusion data would not be adequate, because the inter-reader variability for visual assessment has been reported to be substantial, with values as low as 0.30.34 Therefore two categories of assessment are proposed: (1) visual and (2) quantitative. The quantita-tive analysis is then further categorized into (1) quanti-fication of perfusion-related parameters and (2) absolute quantification of perfusion (in milliliters per minute per gram of tissue). Whereas absolute quantification of perfusion is still challenging and not all issues are resolved, the quantification of perfusion-related parame-ters appears best suited to serve as an inparame-terstudy standard. Perfusion-related parameters have been applied widely
and are, for example, the upslope of signal during first-pass conditions,7,10,13,14,17,26,29,33the maximum sig-nal during the first pass,6,8,14,54,60 the time to peak, the mean transit time,7,14,53the area under the signal inten-sity–time curve,61 and many others. Before an analysis algorithm is applied, the perfusion data are typically registered—that is, motion resulting from a drift of the diaphragm or even from breathing is eliminated by shifting the images in the time series, which can be achieved by hand or by means of algorithms. With this in mind, it is obvious that the definition of the two catego-ries for a quantitative analysis (perfusion-related and absolute perfusion) is not sufficient. It should be further defined how the data were extracted from the images: (1) manual, (2) semiautomatic (ie, some observer interfer-Figure 5. Perfusion assessment by hyperpolarized C-13 CMR. A time series of C-13 images is
shown in A through H demonstrating the wash-in kinetics during the first pass of an intravascular C-13 compound in a pig. Because signal obtained from the C-13 compound is linearly related to its concentration (considering T1-relaxation and signal decay as result of pulsing), the Kety-Schmidt model is applicable to the signal intensity–time curves (J), and myocardial perfusion is calculated pixel-wise and represented by a color-coded perfusion map (I). This color-coded perfusion map represents a mean myocardial blood flow at rest of 0.98 mL · min⫺1· g⫺1and is overlayed on a conventional H-1 proton image. To obtain this type of combined image, the radiofrequency coils must be of a send-and-transmit type at the C-13 frequency of approximately 15 MHz (at 1.5 T) compared with approximately 60 MHz for proton imaging. (Courtesy of Stefan Petersson, PhD, and Klaes Golman, PhD, GE Healthcare, Malmö, Sweden.)
ence with the images), or (3) automatic (ie, no observer interference with the images). In this context the term semiquantitative may be misleading, because it can mean “perfusion-related” (although the result is given in a quantitative measure) or it can simply describe the way data were extracted (eg, semiautomatic).
Regarding the analysis of perfusion data, many efforts are still needed to define the most adequate algorithms. It should be noted that for all analysis approaches that are based on comparisons with a normal database, such normal databases would need to be updated when new hardware or software is installed or imaging parameters are changed. Although this is a handicap compared with visual reading, a quantitative result of perfusion studies would minimize observer variability and would allow the activity of CAD to be objectively monitored over time.
Perfusion data analysis cannot be addressed without covering the issue of data quality. There is clearly a reciprocal relationship for a given analysis algorithm between its “automaticity” and its diagnostic perfor-mance. In other words, a fully automatic algorithm applied to high-quality data is likely to perform well (minimum number of nonevaluable studies and high AUC compared with a standard of reference), with virtually absent observer variability. On the other hand, with low-quality data, a high number of failures will be produced, and a manual analysis would perform better but at the cost of observer dependence in the latter case. Accordingly, it will be a major task in the future to establish criteria or, even better, computerized algo-rithms that would define data quality. Categories of qualities would then be available qualifying a given data set for a particular analysis algorithm for which the diagnostic performance is known. In a single-vendor multicenter trial, for example, the diagnostic perfor-mance of perfusion-CMR with an AUC of 0.72 (at 0.1 mmol/kg Gd-DTPA) for CAD detection was increased to 0.91 when eliminating 14% of all studies that were of low quality and including only the central 3 (high-quality) slices in the analysis algorithm.33Such standard-izations are deemed crucial if the impact of perfusion-CMR in cardiology should increase and estimations of cost-effectiveness should become available.
VIABILITY AND METABOLIC IMAGING BY CMR Monitoring CAD activity by perfusion-CMR would detect ischemia and thus the patient at risk in an early stage. This would allow for interventions and conse-quently the avoidance of infarctions in the ideal case. Unfortunately, this ideal situation is still far away. Instead, the number of patients with a mixture of chronic infarctions and ischemia is increasing. Accordingly, a
complete workup of CAD patients clearly requires de-tection of hypoperfusion (during hyperemia) and its characterization as being either present in viable tissue (ie, ischemic tissue during conditions of increased oxy-gen demand or hibernating tissue with reduced function at rest) or present in nonviable tissue (ie, scar tissue). Therefore perfusion-CMR should be followed by viabil-ity imaging when hypoperfused areas are detected, par-ticularly if these hypoperfused areas show reduced func-tion at rest. As shown in Figure 1, CMR probes the distribution volume of conventional gadolinium chelates during steady-state conditions, which occur approxi-mately 15 to 20 minutes after injection of 0.15 to 0.25 mmol/kg intravenously.62Stressing the need to wait for this steady-state condition to occur, the CMR technique is called either an LE- or DE-CMR technique. This technique is less demanding with respect to the gradient system of the scanner, because the time window for imaging lasts several minutes (compared with 1-2 RR intervals for perfusion-CMR), which allows coverage of the entire heart with a spatial resolution on the order of 1 to 2 mm ⫻ 1 to 2 mm. This high spatial resolution discriminates small subendocardial scar regions,63which are not detectable by PET62,64or SPECT65on a regular basis. This detailed insight into the transmural scar distribution was analyzed to predict functional recovery in patients after revascularization.62It was demonstrated that both conditions must be met for functional recovery— that is, sufficient viable rim tissue (approximatelyⱖ4.5 mm rim thickness) and no or small scar tissue (approximately ⬍4 mm). This study also showed that mismatch seg-ments on FDG-PET imaging were most prevalent in segments with a substantial rim of viable tissue on LE-CMR, indicating that mismatch segments are prefer-entially encountered in the subepicardial layer of scar regions. Thus CMR and PET can provide complemen-tary information, but CMR may add metabolic informa-tion to funcinforma-tional, perfusion, and viability informainforma-tion as well. Although MR spectroscopy of the heart66 and skeletal muscle67 is feasible to quantify high-energy phosphates, it may not access all parts of the heart with high resolution. Here, hyperpolarized C-13 CM may open a new chapter in metabolic imaging.
Hyperpolarized C-13 CM
Whereas some hyperpolarized C-13 compounds re-main intravascular and can be used for perfusion quan-tification (Figure 5), other hyperpolarized C-13 com-pounds may act to trace the citric acid cycle to determine the oxygen consumption of the cell, to measure the pH, or to trace other metabolites within the cells. Given the high signal available, this metabolic information can be obtained with millimeter resolution updated every few
seconds (ie, in near real time). Moreover, in the same voxel spectra can be acquired that allow for identification and quantification of several different compounds simul-taneously by use of chemical shift imaging or even faster approaches such as multiecho steady-state free preces-sion pulse sequences.23Because the resonance frequency of the metabolic products of, for example, C-13-pyruvate is sufficiently separated from the frequency of C-13-pyruvate itself, it is possible to trace the C-13 atom through the various metabolic and catabolic pathways in the cells in vivo.23This is different from PET imaging, which visualizes the active nuclei irrespective of whether they are still contained in the injected tracer. Thus monitoring the fate of C-13-pyruvate into its metabolites, C-13-alanine and C-13-lactate, is possible in near–real-time imaging, whereas the tissue concentration of C1
-pyruvate is a measure of tissue perfusion. In addition, a low concentration of HCO3⫺ is indicative of a low
regional tissue pH (pH-dependent CO2↔HCO3⫺
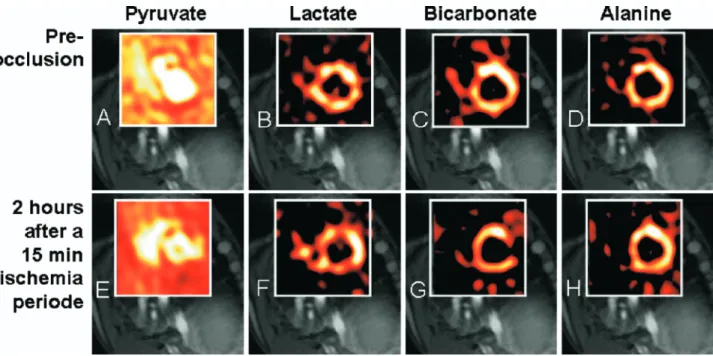
equi-librium). Whereas hibernation might represent a mecha-nism to downregulate function to preserve tissue struc-ture and cell homeostasis, it was hypothesized that after an ischemic insult, cellular metabolism might change toward anaerobic energy production to preserve cell function. If this is true and changes would persist, this adaptive change of metabolism would represent a kind of metabolic memory. The presence of metabolic memory is demonstrated by use of C-13 metabolic CMR imaging inFigure 6, where metabolic alteration of the citric acid (Krebs) cycle was demonstrated 2 hours after a short ischemic insult of 15 minutes’ duration.
FUTURE PERSPECTIVES OF PERFUSION-CMR In the past few years considerable improvements were achieved in the treatment of CAD, particularly with the invention of drug-eluting stents, which re-duced the rate of in-stent restenoses considerably. Figure 6. Metabolic assessment by hyperpolarized C-13 CMR. In this pig experiment
hyperpolar-ized C-13-pyruvate was injected intravenously at baseline, and chemical shift imaging was used to monitor the metabolism of C-13-pyruvate into C-13-lactate, C-13-alanine, and bicarbonate, as shown in the upper row (A-D). Conventional proton imaging for assessment of contractile function and LE imaging for assessment of viability were also performed. After baseline imaging, the animal was subjected to 15 minutes of left circumflex coronary artery occlusion by an inflated balloon catheter. After 2 hours of reperfusion, it was again studied by C-13 chemical shift imaging after injection of hyperpolarized pyruvate (lower row [E-H]). Although hyperpolarized C-13-pyruvate is represented in all myocardial segments both at baseline (A) and after the ischemic insult (E), metabolic imaging demonstrates a severe reduction in bicarbonate in the formerly ischemic territory of the lateral wall (G) whereas C-13-lactate content is increased in the same territory (F), without a notable change in C-13-alanine (H). This change in the metabolism of C-13-pyruvate (ie, the Krebs cycle) is detected 2 hours after a relatively short ischemic period of only 15 minutes, demonstrating the phenomenon of metabolic memory. (Courtesy of Stefan Petersson, PhD, and Klaes Golman, PhD, GE Healthcare, Malmö, Sweden.)
This, in combination with percutaneous coronary in-terventions performed in the setting of acute coronary syndromes, changed the outcome of these high-risk patients. Nevertheless, about 40% of patients having an acute coronary attack die from it, most of them in the preclinical phase or in the emergency department before undergoing a rescue percutaneous coronary intervention,68 indicating that the identification of high-risk patients with currently established guide-lines is not optimal. The increasing number of SPECT studies in the past years demonstrates the need for a noninvasive approach to identify the patients at risk, with approximately half of them being asymptomatic before cardiac death.68 Therefore a shift is likely to occur from a “reactive” strategy, where patients with symptoms predominantly undergo further diagnostic workup, to an “active” strategy, where patients will undergo additional noninvasive investigations accord-ing to their risk profile. For such an “active” strategy, perfusion-CMR would be ideally suited, because large multicenter studies have demonstrated a good diag-nostic performance of the technique.33,41 It is repeat-able and safe, and costs are expected to be similar to costs of other noninvasive techniques. Substantial data are available for SPECT demonstrating its cost-effec-tiveness,5 and it is hoped that such data will soon be available for the CMR technique as well. As pointed out previously, considerable efforts will be needed in the near future to standardize the perfusion-CMR protocols, the pulse sequences, and the analysis meth-ods. In a next step the performance of the various diagnostic techniques should be compared in prospec-tive trials to identify the best indications for each technique. For the successful conduction of future comparative studies, close cooperation between the representatives of the various techniques in noninva-sive cardiology will be crucial.69 It will then be an ongoing challenge to adapt the established guidelines for diagnostic workup.
Of course, for an “active” strategy, the following question has to be addressed: At which level of risk should an individual patient undergo a diagnostic workup?70 In addition to the classical cardiovascular risk factors, the risk of an individual patient could be further characterized by plaque imaging, by probing the endothelial function (eg, by sophisticated MR techniques),71 by hyperpolarized C-13 CM metabolic imaging, or by screening the genome.72(However, the number of candidate genes associated with cardiovas-cular diseases is extremely high, making a distinction between random and true biologic associations diffi-cult.) A combination of these various aspects of vascular disease will be most promising in identifying the patients who will benefit most from early risk
management and a monitoring strategy of CAD activ-ity to determine the optimum time point for coronary interventions before infarctions occur.
Acknowledgment
J. Schwitter is consultant for the MR-IMPACT program and for the research activities on cardiovascular applications of hyperpolarized C-13 compounds of GE Healthcare.
References
1. Ladenheim ML, Pollock BH, Rozanski A, Berman DS, Staniloff HM, Forrester JS, et al. Extent and severity of myocardial hypoperfusion as predictors of prognosis in patients with suspected coronary artery disease. J Am Coll Cardiol 1986;7:464-71. 2. Iskander S, Iskandrian AE. Risk assessment using single-photon
emission computed tomographic technetium-99m sestamibi imag-ing. J Am Coll Cardiol 1998;32:57-62.
3. Beller GA, Zaret BL. Contributions of nuclear cardiology to diagnosis and prognosis of patients with coronary artery disease. Circulation 2000;101:1465-78.
4. Kemp HG, Kronmal RA, Vlietstra RE, Frye RL. Seven year survival of patients with normal or near normal coronary arterio-grams: a CASS registry study. J Am Coll Cardiol 1986;7:479-83. 5. Shaw LJ, Hachamovitch R, Berman D, Marwick T, Lauer M, Heller G, et al. The economic consequence of available diagnostic and prognostic strategies for the evaluation of stable angina patients: an observational assessment of the value of precatheter-ization ischemia. J Am Coll Cardiol 1999;33:661-9.
6. Saeed M, Wendland MF, Sakuma H, Geschwind JF, Derugin N, Cavagna FM, et al. Coronary artery stenosis: detection with contrast-enhanced MR imaging in dogs. Radiology 1995;196: 79-84.
7. Wilke N, Simm C, Zhang J, Ellermann J, Ya X, Merkle H, et al. Contrast-enhanced first pass myocardial perfusion imaging: corre-lation between myocardial blood flow in dogs at rest and during hyperemia. Magn Reson Med 1993;29:485-97.
8. Schwitter J, Saeed M, Wendland MF, Sakuma H, Bremerich J, Canet E, et al. Assessment of myocardial function and perfusion in a canine model of non-occlusive coronary artery stenosis using fast magnetic resonance imaging. J Magn Reson Imaging 1998;9:101-10.
9. Manning WJ, Atkinson DJ, Grossman W, Paulin S, Edelman RR. First-pass nuclear magnetic resonance imaging studies using gadolinium-DTPA in patients with coronary artery disease. J Am Coll Cardiol 1991;18:959-65.
10. Schwitter J, Nanz D, Kneifel S, Bertschinger K, Buchi M, Knusel PR, et al. Assessment of myocardial perfusion in coronary artery disease by magnetic resonance: a comparison with positron emis-sion tomography and coronary angiography. Circulation 2001;103: 2230-5.
11. Kroll K, Wilke N, Jerosch-Herold M, Wang Y, Zhang Y, Bache RJ, et al. Modeling regional myocardial flows from residue functions of an intravascular indicator. Am J Physiol 1996;271(Pt 2):H1643-55. 12. Schwitter J. Myocardial perfusion in ischemic heart disease. In:
Higgins CB, de Roos A, editors. MRI and CT of the cardiovascular system. 2nd ed. Philadelphia: Lippincott Williams & Wilkins; 2005. p. 198-214.
13. Panting JR, Gatehouse PD, Yang GZ, Grothues F, Firmin DN, Collins P, et al. Abnormal subendocardial perfusion in cardiac
syndrome X detected by cardiovascular magnetic resonance imaging. N Engl J Med 2002;346:1948-53.
14. Keijer JT, van Rossum AC, Wilke N, van Eenige MJ, Jerosch-Herold M, Bronzwaer JG, et al. Magnetic resonance imaging of myocardial perfusion in single-vessel coronary artery disease: implications for transmural assessment of myocardial perfusion. J Cardiovasc Magn Reson 2000;2:189-200.
15. Schwitter J, Saeed M, Wendland MF, Derugin N, Canet E, Brasch RC, et al. Influence of severity of myocardial injury on distribution of macromolecules: extravascular versus intravascular gadolinium-based magnetic resonance contrast agents. J Am Coll Cardiol 1997;30:1086-94.
16. Hillenbrand HB, Kim RJ, Parker MA, Fieno DS, Judd RM. Early assessment of myocardial salvage by contrast-enhanced magnetic resonance imaging. Circulation 2000;102:1678-83.
17. Al-Saadi N, Nagel E, Gross M, Bornstedt A, Schnackenburg B, Klein C, et al. Noninvasive detection of myocardial ischemia from perfusion reserve based on cardiovascular magnetic resonance. Circulation 2000;101:1379-83.
18. Muzik O, Duvernoy C, Beanlands RS, Sawada S, Dayanikli F, Wolfe ER Jr, et al. Assessment of diagnostic performance of quantitative flow measurements in normal subjects and patients with angiographically documented coronary artery disease by means of nitrogen-13 ammonia and positron emission tomography. J Am Coll Cardiol 1998;31:534-40.
19. Picano E, Parodi O, Lattanzi F, Sambuceti G, Andrade MJ, Marzullo P, et al. Assessment of anatomic and physiological severity of single-vessel coronary artery lesions by dipyridamole echocardiography. Comparison with positron emission tomogra-phy and quantitative arteriogratomogra-phy. Circulation 1994;89:753-61. 20. Miller DD, Donohue TJ, Wolford TL, Kern MJ, Bergmann SR.
Assessment of blood flow distal to coronary artery stenoses. Correlations between myocardial positron emission tomography and poststenotic intracoronary Doppler flow reserve. Circulation 1996;94:2447-54.
21. Schwaiger M. Myocardial perfusion imaging with PET. J Nucl Med 1994;35:693-8.
22. Sambuceti G, Parodi O, Marcassa C, Neglia D, Salvadori P, Giorgetti A, et al. Alterations in regulation of myocardial blood flow in one-vessel coronary artery disease determined by positron emission tomography. Am J Cardiol 1993;72:538-43.
23. Manson S, Leupold J, Wieben O, In’t Zandt R, Magnusson P, Johansson E, et al. Metabolic imaging with hyperpolarized 13-C and multi-echo, single-shot RARE. Presented at the 14thMeeting of the International Society of Magnetic Resonance in Medicine, May 6-12, 2006, Seattle Wash. Proceedings of the ISMRM 2006;14:584.
24. Schwitter J, DeMarco T, Kneifel S, von Schulthess GK, Jorg MC, Arheden H, et al. Magnetic resonance-based assessment of global coronary flow and flow reserve and its relation to left ventricular functional parameters: a comparison with positron emission to-mography. Circulation 2000;101:2696-702.
25. Klem I, Heitner JF, Shah DJ, Sketch JMH, Behar V, Weinsaft J, et al. Improved detection of coronary artery disease by stress perfusion cardiovascular magnetic resonance with the use of delayed en-hancement infarction imaging. J Am Coll Cardiol 2006;47:1630-8. 26. Matheijssen NA, Louwerenburg HW, van Rugge F, Arens RP, Kauer B, de Roos A, et al. Comparison of ultrafast dipyridamole magnetic resonance imaging with dipyridamole SestaMIBI SPECT for detection of perfusion abnormalities in patients with one-vessel coronary artery disease: assessment by quantitative model fitting. Magn Reson Med 1996;35:221-8.
27. Lauerma K, Virtanen KS, Sipila LM, Hekali P, Aronen HJ. Multislice MRI in assessment of myocardial perfusion in patients
with single-vessel proximal left anterior descending coronary artery disease before and after revascularization. Circulation 1997;96:2859-67.
28. Cullen JH, Horsfield MA, Reek CR, Cherryman GR, Barnett DB, Samani NJ. A myocardial perfusion reserve index in humans using first-pass contrast-enhanced magnetic resonance imaging. J Am Coll Cardiol 1999;33:1386-94.
29. Bertschinger KM, Nanz D, Buechi M, Luescher TF, Marincek B, von Schulthess GK, et al. Magnetic resonance myocardial first-pass perfusion imaging: parameter optimization for signal response and cardiac coverage. J Magn Reson Imaging 2001;14:556-62. 30. Tsekos N, Zhang Y, Merkle H, Wilke N. Fast anatomical imaging
of the heart and assessment of myocardial perfusion with arrhyth-mia insensitive magnetization preparation. Magn Reson Med 1995;34:530-6.
31. Wilke N, Jerosch-Herold M, Wank Y, Huang Y, Christensen BV, Stillman AE, et al. Myocardial perfusion reserve: assessment with multisection, quantitative, first pass MR imaging. Radiology 1997; 204:373-84.
32. Elkington AG, Gatehouse PD, Cannell TM, Moon JC, Prasad SK, Firmin DN, et al. Comparison of hybrid echo-planar imaging and FLASH myocardial perfusion cardiovascular MR imaging. Radi-ology 2005;235:237-43.
33. Giang T, Nanz D, Coulden R, Friedrich M, Graves M, Al-Saadi N, et al. Detection of coronary artery disease by magnetic resonance myocardial perfusion imaging with various contrast medium doses: first European multi-centre experience. Eur Heart J 2004;25:1657-65.
34. Wolff S, Schwitter J, Coulden R, Friedrich M, Bluemke D, Biedermann R, et al. Myocardial first-pass perfusion magnetic resonance imaging: a multicenter dose-ranging study. Circulation 2004;110:732-7.
35. Ishida N, Sakuma H, Motoyasu M, Okinaka T, Isaka N, Nakano T, et al. Noninfarcted myocardium: correlation between dynamic first-pass contrast-enhanced myocardial MR imaging and quanti-tative coronary angiography. Radiology 2003;229:209-16. 36. Schwitter J, Debatin JF, von Schulthess GK, McKinnon GC.
Normal myocardial perfusion assessed with multi-shot echo-planar imaging. Magn Reson Med 1997;37:140-7.
37. Ding S, Wolff SD, Epstein FH. Improved coverage in dynamic contrast-enhanced cardiac MRI using interleaved gradient-echo EPI. Magn Reson Med 1998;39:514-9.
38. Kellman P, Derbyshire JA, Agyeman KO, McVeigh ER, Arai AE. Extended coverage first-pass perfusion imaging using slice-interleaved TSENSE. Magn Reson Med 2004;51:200-4. 39. Pruessmann KP, Weiger M, Scheidegger MB, Boesiger P.
SENSE: sensitivity encoding for fast MRI. Magn Reson Med 1999;42:952-62.
40. Tsao J, Boesiger P, Pruessmann KP. k-t BLAST and k-t SENSE: dynamic MRI with high frame rate exploiting spatiotemporal correlations. Magn Reson Med 1031;50:1031-42.
41. Schwitter J, Bauer W, van Rossum A, Lombardi M, Al-Saadi N, Ahlstrom H, et al. MR-IMPACT: comparison of myocardial perfusion imaging with single photon emission computed to-mography in known or suspected coronary artery disease: a multicentre, multivendor dose finding study [abstract]. Eur Heart J. Available at: http://www.escardio.org/knowledge/ congresses/CongressReports/clinical/2005/Schwitter.htm. 42. Araoz PA, Glockner JF, McGee KP, Potter DD, Valeti VU,
Stanley DW, et al. 3 Tesla MR imaging provides improved contrast in first-pass myocardial perfusion imaging over a range of gado-linium doses. J Cardiovasc Magn Reson 2005;7:559-64. 43. Wedeking P, Sotak CH, Telser J, Kumar K, Chang CA, Tweedle
concentration of Gd(HP-DO3A) in the nephrectomized rat. Magn Reson Imaging 1992;10:97-108.
44. Saeed M, Wendland M, Yu K, Li H, Higgins C. Dual effects of gadodiamide injection in depiction of the region of myocardial ischemia. J Magn Reson Imaging 1993;3:21-9.
45. Saeed M, Wendland MF, Masui T, Higgins CB. Reperfused myocardial infarctions on T1- and susceptibility-enhanced MRI: evidence for loss of compartmentalization of contrast media. Magn Reson Med 1994;31:31-9.
46. Wendland MF, Saeed M, Yu KK, Roberts TP, Lauerma K, Derugin N, et al. Inversion recovery EPI of bolus transit in rat myocardium using intravascular and extravascular gadolinium-based MR contrast media: dose effects on peak signal enhance-ment. Magn Reson Med 1994;32:319-29.
47. Larsson HB, Rosenbaum S, Fritz-Hansen T. Quantification of the effect of water exchange in dynamic contrast MRI perfusion measurements in the brain and heart. Magn Reson Med 2001;46: 272-81.
48. Judd RM, Atalay MK, Rottman GA, Zerhouni EA. Effects of myocardial water exchange on T1 enhancement during bolus administration of MR contrast agents. Magn Reson Med 1995;33: 215-23.
49. Judd RM, Reeder SB, May-Newman K. Effects of water exchange on the measurement of myocardial perfusion using paramagnetic contrast agents. Magn Reson Med 1999;41:334-42.
50. Dauber IM, VanBenthuysen KM, McMurtry IF, Wheeler GS, Lesnefsky EJ, Horwitz LD, et al. Functional coronary microvas-cular injury evident as increased permeability due to brief ischemia and reperfusion. Circ Res 1990;66:986-98.
51. Fung AY, Gallagher KP, Buda AJ. The physiologic basis of dobutamine as compared with dipyridamole stress interventions in the assessment of critical coronary stenosis. Circulation 1987;76: 943-51.
52. Marwick T, Willemart B, D’Hondt AM, Baudhuin T, Wijns W, Detry JM, et al. Selection of the optimal nonexercise stress for the evaluation of ischemic regional myocardial dysfunction and malp-erfusion. Comparison of dobutamine and adenosine using echo-cardiography and 99mTc-MIBI single photon emission computed tomography. Circulation 1993;87:345-54.
53. Weisskoff RM, Chesler D, Boxerman JL, Rosen BR. Pitfalls in MR measurement of tissue blood flow with intravascular tracers: which mean transit time? Magn Reson Med 1993;29:553-8. 54. Kraitchman DL, Chin BB, Heldman AW, Solaiyappan M,
Bluemke DA. MRI detection of myocardial perfusion defects due to coronary artery stenosis with MS-325. J Magn Reson Imaging 2002;15:149-58.
55. Wilke N, Kroll K, Merkle H, Wang Y, Ishibashi Y, Xu Y, et al. Regional myocardial blood volume and flow: first-pass MR imaging with polylysine-Gd-DTPA. J Magn Reson Imaging 1995;5:227-37. 56. Bjerner T, Johansson L, Ericsson A, Wikstrom G, Hemmingsson
A, Ahlstrom H. First-pass myocardial perfusion MR imaging with outer-volume suppression and the intravascular contrast agent NC100150 injection: preliminary results in eight patients. Radiol-ogy 2001;221:822-6.
57. Goldman M, Johannesson H, Axelsson O, Karlsson M. Hyperpo-larization of 13C through order transfer from parahydrogen: a new contrast agent for MRI. Magn Reson Imaging 2005;23:153-7. 58. Ardenkjaer-Larsen JH, Fridlund B, Gram A, Hansson G, Hansson
L, Lerche MH, et al. Increase in signal-to-noise ratio of⬎10,000 times in liquid-state NMR. Proc Natl Acad Sci U S A 2003;100: 10158-63.
59. Johansson E, Mansson S, Wirestam R, Svensson J, Petersson JS, Golman K, et al. Cerebral perfusion assessment by bolus tracking using hyperpolarized 13C. Magn Reson Med 2004;51: 464-72.
60. Keijer JT, van Rossum A, van Eenige M, Karreman AJ, Hofman MB, Valk J, et al. Semiquantitation of regional myocardial blood flow in normal human subjects by first-pass magnetic resonance imaging. Am Heart J 1995;130:893-901.
61. Klocke FJ, Simonetti OP, Judd RM, Kim RJ, Harris KR, Hedjbeli S, et al. Limits of detection of regional differences in vasodilated flow in viable myocardium by first-pass magnetic resonance perfusion imaging. Circulation 2001;104:2412-6.
62. Knuesel PR, Nanz D, Wyss C, Buechi M, Kaufmann PA, von Schulthess GK, et al. Characterization of dysfunctional myocar-dium by positron emission tomography and magnetic resonance: relation to functional outcome after revascularization. Circulation 2003;108:1095-100.
63. Wu E, Judd RM, Vargas JD, Klocke FJ, Bonow RO, Kim RJ. Visualisation of presence, location, and transmural extent of healed Q-wave and non-Q-wave myocardial infarction. Lancet 2001;357: 21-8.
64. Klein C, Nekolla SG, Bengel FM, Momose M, Sammer A, Haas F, et al. Assessment of myocardial viability with contrast-enhanced magnetic resonance imaging: comparison with positron emission tomography. Circulation 2002;105:162-7.
65. Wagner A, Mahrholdt H, Holly T, Kim RJ. Contrast-enhanced MRI and routine single photon emission computed tomography (SPECT) perfusion imaging for detection of subendocardial in-farcts: an imaging study. Lancet 2003;361:374-9.
66. Buchthal SD, den Hollander JA, Merz CN, Rogers WJ, Pepine CJ, Reichek N, et al. Abnormal myocardial phosphorus-31 nuclear magnetic resonance spectroscopy in women with chest pain but normal coronary angiograms [see comments]. N Engl J Med 2000;342:829-35.
67. Isbell DC, Berr SS, Toledano AY, Epstein FH, Meyer CH, Rogers WJ, et al. Delayed calf muscle phosphocreatine recovery after exercise identifies peripheral arterial disease. J Am Coll Cardiol 2006;47:2289-95.
68. Heart disease and stroke statistics—2006 update. Dallas: American Heart Association; 2006.
69. Fraser AG, Buser PT, Bax JJ, Dassen WR, Nihoyannopoulos P, Schwitter J, et al. The future of cardiovascular imaging and non-invasive diagnosis: a joint statement from the European Association of Echocardiography, the Working Groups on Cardiovascular Magnetic Resonance, Computers in Cardiology, and Nuclear Cardiology, of the European Society of Cardiology, the European Association of Nuclear Medicine and the Associ-ation for European Paediatric Cardiology. Eur J Nucl Med Mol Imaging 2006;33:955-9.
70. Schwitter J. Future strategies in the management of coronary artery disease. Future Cardiol 2006;2:555-65.
71. Schwitter J, Oelhafen M, Wyss BM, Kozerke S, Amann-Vesti B, Luscher TF, et al. 2D-Spatially-selective real-time magnetic reso-nance imaging for the assessment of microvascular function and its relation to the cardiovascular risk profile. J Cardiovasc Magn Reson 2006;8:759-69.
72. Topol E, McCarthy J, Gabriel S, Moliterno D, Rogers W, Newby L, et al. Single nucleotide polymorphisms in multiple novel thrombospondin genes may be associated with familial premature myocardial infarction. Circulation 2001;104:2641-4.