Trial
Thomas V. Perneger, MD, PhD
1,3and Thomas Agoritsas, MD
1,2,31Division of clinical epidemiology, University Hospitals of Geneva, Geneva, Switzerland;2Division of general internal medicine, University Hospitals of Geneva, Geneva, Switzerland;3Faculty of medicine, University of Geneva, Geneva, Switzerland.
BACKGROUND: Framing of risk influences the
percep-tions of treatment benefit.
OBJECTIVE: To determine which risk framing format
corresponds best to comprehensive multi-faceted
infor-mation, and to compare framing bias in doctors and in
patients.
DESIGN: Randomized mail surveys.
PARTICIPANTS: One thousand four hundred and
thirty-one doctors (56% response rate) and 1121
re-cently hospitalized patients (65% response rate).
INTERVENTION: Respondents were asked to interpret
the results of a hypothetical clinical trial comparing an
old and a new drug. They were randomly assigned to
the following framing formats: absolute survival (new
drug: 96% versus old drug: 94%), absolute mortality
(4% versus 6%), relative mortality reduction (reduction
by a third) or all three (fully informed condition). The
new drug was reported to cause more side-effects.
MAIN MEASURE: Rating of the new drug as more
effective than the old drug.
RESULTS: The proportions of doctors who rated the new
drug as more effective varied by risk presentation format
(abolute survival 51.8%, absolute mortality 68.3%,
rela-tive mortality reduction 93.8%, and fully informed
condi-tion 69.8%, p<0.001). In patients these proporcondi-tions were
similar (abolute survival 51.7%, absolute mortality
66.8%, relative mortality reduction 89.3%, and fully
informed condition 71.2%, p<0.001). In both doctors (p
=0.72) and patients (p=0.23) the fully informed condition
was similar to the absolute risk format, but it differed
significantly from the other conditions (all p<0.01). None
of the differences between doctors and patients were
significant (all p > 0.1). In comparison to the fully informed
condition, the odds ratio of greater perceived effectiveness
was 0.45 for absolute survival (p<0.001), 0.89 for
abso-lute mortality (p=0.29), and 4.40 for relative mortality
reduction (p<0.001).
CONCLUSIONS: Framing bias affects doctors and
patients similarly. Describing clinical trial results as
absolute risks is the least biased format, for both doctors
and patients. Presenting several risk formats (on both
absolute and relative scales) should be encouraged.
KEY WORDS: risk framing; perception of benefit; patient–provider communication; patient information.
J Gen Intern Med 26(12):1411–7 DOI: 10.1007/s11606-011-1810-x © Society of General Internal Medicine 2011
INTRODUCTION
The mode of presentation of clinical trial results influences the perception of treatment benefit1–10. Generally, relative risks (e.g.,
mortality reduction by half) accentuate the perception of benefit compared to absolute risks (e.g., mortality was 5% versus 10%) or numbers needed to treat (e.g., 20 patients need to be trated to avoid one death). Similarly, negative framing (in terms of mortality) leads to greater perception of benefit than positive framing (in terms of survival).
The absolute risk format is often recommended because the relative risk format causes misunderstandings11,12, but others
have argued against the provision of absolute risks13. Arguably, no single format allows a well-informed opinion, which would require careful consideration of all sides of the argument14. Only a few recent tudies have included a“fully informed” condition in their design, with variable results15–18. These studies enrolled various volunteer samples, not patients or doctors, who are directly concerned by treatment decisions. Thus available evidence remains inconclusive.
Another unresolved question is whether patients and doctors are affected similarly by framing formats. A meta-analysis has suggested that both doctors and patients overrate treatment benefits when presented with relative risks4, but no study has probed doctors and patients using the same instruments. The doctors’ greater familiarity with the assessment of medical research findings, higher numeracy levels, and greater knowl-edge of the relevant clinical context may make them less susceptible to framing effects.
The objectives of this study were to determine which single framing format approximates best the comprehensive informa-tion format in terms of the percepinforma-tion of treatment benefit, and to compare the impact of risk framing formats on doctors and on patients.
METHODS
We conducted two randomized mail surveys that included a hypothetical scenario among doctors and among patients Received March 1, 2011
Revised June 23, 2011 Accepted July 6, 2011 Published online July 27, 2011
recently discharged from hospital. The doctor survey pri-marily explored doctors’ opinions about policy issue and was approved by the Research Ethics Committee of the University Hospitals of Geneva19,20; the patient survey,
primarily a patient satisfaction survey, was exempted from full review21,22.
The doctor survey included all active clinicians in canton Geneva, Switzerland, and was conducted between November 2007 and February 2008. Doctors were identified through the registries of the Geneva Medical Association and Uni-versity Hospitals of Geneva. Duplicate records, invalid addresses and doctors who did not work with patients were excluded. This left 2746 eligible doctors. The survey re-sponse rate was of 56.3% (1546/2746). Participation was not related to age, setting of practice and source data base, but differed by sex (58.0% in men vs. 53.7% in women, p=0.027) and specialty (from 52.6% in technical specialists to 62.2% in primary care doctors, p=0.003).
The patient survey took place between November 2005 and February 2006. It included all adult patients discharged to their home during a one month period. No clinical data were available, nor any information about the relevance of the study scenario for the patient. We excluded patients who were transferred to another facility, did not live in Switzerland, or reported not speaking French or being incapable of filling a questionnaire. The core of the questionnaire was the Picker patient opinion survey. The response rate was 65.0% (1432/ 2204).
Scenario
The scenario described a hypothetical clinical trial in which a new treatment provided a survival benefit over the old treatment, but caused more digestive side-effects (Box). Four basic risk formats were used in both surveys: 1) survival proportions, 2) mortality proportions, 3) relative mortality reduction, and 4) all three presentations of risk. The latter was considered to be the fully informed condition. The respondent was asked how the new treatment compared with the old treatment.
We tested two additional risk formats in doctors only: 5) the number needed to treat, and 6) the relative survival extension. These formats did not work well with patients during pretests, and we renounced their use in this sample. Furthermore, we called the viral disease HIV infection in the doctor scenario, but not in the patient scenario, to avoid singling out a specific patient group. The study was called a“multicenter clinical trial” in the doctor version, but just“study” in the patient version. We mentioned statistical significance in the doctor version because that question arose during pretests, but not in the patient version.
Presentations of treatment benefits as absolute survival, absolute mortality, relative mortality reduction, and number needed to treat do not require elaboration. Computation of the relative survival extension was based on the assumption of a constant mortality rate (i.e., exponential model). Under this assumption the expectation of survival time equals the inverse of the mortality rate23; thus if the mortality rate with the new drug is 2/3 of the mortality rate with the old drug, the expected survival on the new drug will be 3/2 the expected survival on the old drug, i.e., an increase of 50%. Of note, in the other versions of the scenario, we reported risks rather than rates, but because risks were low, the ratios of hazards and risks were practically
equivalent (an exact computation yields a survival extension of 51.2% for this case; we used the rounded figure of 50% for simplicity).
Sample Size Determination
We sought to detect a difference in positive assessments of 60% versus 75%. With a type 1 error at 5% and a desired power of 90%, 220 observations per group were necessary.
Analysis
We compared the distributions of the 5-level assessment across versions of the scenario, and compared them using a chi-square test for linear trend, separately in patients and in doctors. For most analyses, we dichotomized the assessment as favorable (“much better” or “somewhat better”) versus other, and used chi-square tests to compare version of the scenario, and doctors to patients within each version. Multivariate modeling was conducted with logistic regression. The reference level was the comprehensive information condition, and differences between this and other risk frames were interpreted as framing bias. The models were replicated using ordinal logistic regression with the original 5-level assessment as dependent variable, but because the results were virtually identical, we report binary logistic regression results. To compare the effects of risk framing across subgroups we used interaction terms; e.g., to compare men and women, the model predictors included risk formats , sex, and the sex*formats interaction.
RESULTS
Of the 1546 doctors who returned the questionnaire, 107 (6.9%) left the scenario blank. Non-response was similar in men and women (6.5% vs. 7.6%, p=0.38), but was higher in older doctors (up to 35 years: 3.3%, 36–50 years: 6.4%, 51 and over: 9.2%, p-value for trend=0.001), and in psychiatrists compared to other specialties (12.6% vs. 5.6%, p<0.001). The doctor respondents included a majority of men (Table1), and their mean age was 47.0 years (standard deviation 11.6). The majority were in private practice. All clinical specialties were represented.
Non-completion of the scenario was higher among the 1432 patient respondents (311, 21.7%). Non-response was similar in men and women (20.7% vs. 17.9%, p=0.20), but was higher in older patients (up to 35 years: 10.2%, 36–50 years: 16.0%, 51 and over: 28.9%, p-value for trend<0.001), patients who had less than high school education (23.1%) versus the more educated (12.0%, p<0.001), and in patients who reported poor to good health (21.4%) compared to those in excellent or very good health (11.4%, p<0.001). The majority of patient participants were women (Table1), and their mean age was 51.0 years (standard deviation 18.7). Slightly more than half had only basic education; about a third reported very good or excellent health.
Scenario Assessments
Most doctors considered the new treatment to be better than the old treatment, but the proportions of positive assessments varied
l l l l l l l
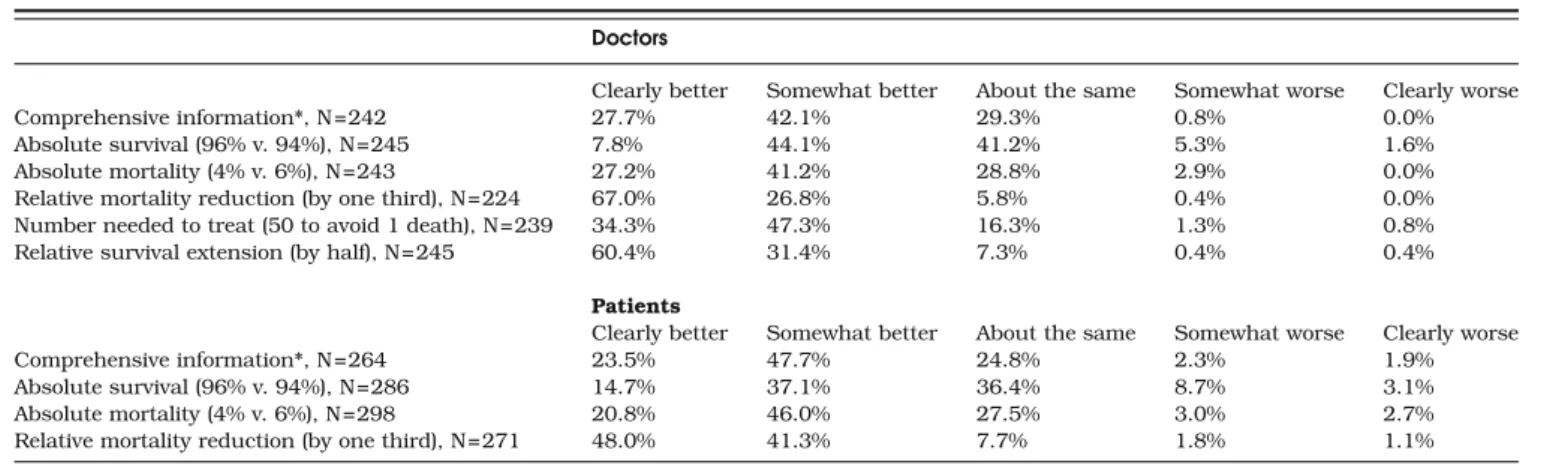
considerably across formats (Table2). E.g., the proportion that rated the new treatment“clearly better” exceeded 60% for relative formats (relative mortality reduction, relative survival extension), but less than 10% for absolute survival. The differences between the six formats were statistically significant (p <0.001). In comparison to the fully informed format, the distribution of responses was similar for the absolute risk format (p=0.42), but differed significantly for all others (p=0.009 for the NNT format, and <0.001 for the others).
The pattern of responses was similar for patients, but the contrasts appeared somewhat more attenuated, and more negative opinions were expressed (Table2). The differences between formats were statistically significant overall (p<0.001), and in comparison to the fully informed condition, the difference was non-significant for absolute mortality (p=0.80), but significant for absolute survival and for relative mortality reduction (both p<0.001).
Collapsing the two positive categories (clearly or somewhat better) yielded results that were almost indistinguishable for doctors and patients (Table 3). About 50% of respondents considered the new treatment better when absolute survival was shown, about 70% did when comprehensive information or absolute mortality was shown, and about 90% did when relative mortality or relative survival extension were shown. None of the comparisons of doctors with patients was significant.
The logistic regression model confirmed these results (Table 4). Compared to the fully informed condition, the odds of a favorable assessment of the new drug were
fourfold for relative mortality reduction and relative survival extension, less increased for the number needed to treat, similar for absolute mortality, and reduced more than twofold for absolute survival. The difference between doctors and patients was small and non-significant.
Subgroup Analyses
The only difference that we anticipated (attenuated framing effects in doctors compared with patients) was not borne out by the data (p value of interaction test =0.40). Among doctors, the impact of risk framing was similar across subgroups: interaction terms between format and sex (p=0.78), age group (p=0.50), site of practice (p=0.84), and specialty (p=0.80) were all non-significant. Similarly, among patients, no significant interactions were found between risk framing and sex (p=0.82), age groups (p=0.35), education level (p=0.85), country of birth (p=0.17), health status (p=0.71), and hospital department (p=0.91).
DISCUSSION
Risk Formats
Our study confirms that the risk information format influ-ences perceptions of treatment benefit: absolute survival led to the perception of weakest benefit, and relative mortality reduction led to the perception of greatest benefit. To this we add two novel findings: comprehensive information that combined absolute mortality, absolute survival, and relative mortality reduction produced a similar perception of bene-fits to the presentation of absolute mortality, and the susceptibility to framing bias was similar in doctors and patients.
If respondent perceptions following comprehensive infor-mation are used as a yardstick, absolute risks constitute the least biased risk format. In contrast, presentation of relative risk reductions in isolation caused an optimistic bias, with a more than fourfold increase in the odds of a positive assessment of the new treatment. Presentation of absolute survival proportions caused a pessimistic bias, with a more than twofold decrease in the odds of a favorable assessment. The differences we observed between these risk formats are consistent with the results of a recent meta-analysis on the subject4. The novel aspect contributed by this study is the inclusion of a fully informed condition, which aimed to capture the “true” values and preferences of the respondents. Indeed, on face value, all perceptions of treatment benefit are equally valid. As long as the data on which these perceptions are based are correct (and a relative risk is as technically correct as two survival proportions), it cannot be said that one perception is right and the other wrong. Arguably, the “right” answer is one that the respondent arrived at after careful consideration of all arguments, preferably after sufficient reflection time, and after clarification of any questions that may have occurred. This is the ideal that we attempted to approach, however imperfectly, through the“comprehensive information” condition.
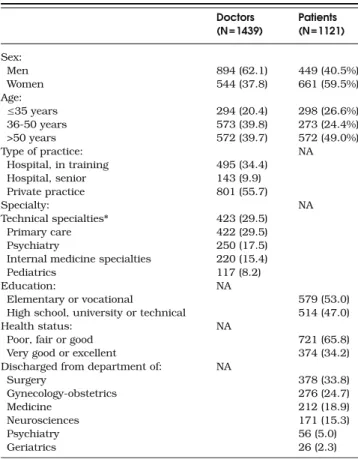
Table 1. Characteristics of Doctors and Patients Who Completed the Risk Assessment Scenario (Totals May Not Add up to Total Due
to Missing Values) Doctors (N=1439) Patients (N=1121) Sex: Men 894 (62.1) 449 (40.5%) Women 544 (37.8) 661 (59.5%) Age: ≤35 years 294 (20.4) 298 (26.6%) 36-50 years 573 (39.8) 273 (24.4%) >50 years 572 (39.7) 572 (49.0%) Type of practice: NA Hospital, in training 495 (34.4) Hospital, senior 143 (9.9) Private practice 801 (55.7) Specialty: NA Technical specialties* 423 (29.5) Primary care 422 (29.5) Psychiatry 250 (17.5)
Internal medicine specialties 220 (15.4)
Pediatrics 117 (8.2)
Education: NA
Elementary or vocational 579 (53.0)
High school, university or technical 514 (47.0)
Health status: NA
Poor, fair or good 721 (65.8)
Very good or excellent 374 (34.2)
Discharged from department of: NA
Surgery 378 (33.8) Gynecology-obstetrics 276 (24.7) Medicine 212 (18.9) Neurosciences 171 (15.3) Psychiatry 56 (5.0) Geriatrics 26 (2.3)
* Surgery, anesthesiology, gynecology-obstetrics, ear, nose and throat, ophthalmology, radiology
A few previous studies have compared isolated risk frames to a fully informed condition. Stovring et al. have followed an initial presentation of treatment benefit by a comprehensive description; initial presentation in the absolute risk reduc-tion of a heart attack led to fewer changes in the decision to take the drug (6%) than if the initial presentation was a relative risk reduction (9%), but this difference was not statistically significant15. Carling et al. reported that framing
the risks of cardiovascular events initially as a rate (events per year) resulted in fewer changes in decisions (19.1%) than describing a cumulative risk over 10 years (28.2%) or disease-free survival over 10 years (23.8%)16. Armstrong et al. have
reported that showing survival and mortality curves together led to similar decisions regarding a preventive colectomy as showing survival curves alone, but not mortality curves alone17. Peters et al. have observed that a positive frame (absence of an adverse drug reaction) led to lower perceptions of risk than a negative frame (risk of adverse event), with the combined frame presentation falling in-between18. These
studies have shown weak and somewhat inconsistent con-trasts, while we have observed a strong and statistically significant differences. This raises the issue of contextual factors which may influence study results, such the type of scenario, the exact question asked, or the type of study
population. All four aforementioned studies were conducted among various volunteer samples from the general popula-tion, while we surveyed patients and doctors.
Doctors Versus Patients
The second novel finding of this study is that doctors are just as prone to framing bias as patients. The results of doctors and patients were remarkably similar when the perceptions were dichotomized as positive versus neutral or negative. This was unexpected—we thought that doctors would be more sophis-ticated than patients in interpreting the scenario, less likely to be convinced by a relative mortality reduction with no absolute risk to anchor the comparison, and more apt to deduce the proportion of patients who died when the proportion who survived was given. This illustrates the difficulty that many doctors have in applying quantitative analysis skills in their practice. Previous studies have shown that doctors’ under-standing of various terms used in medical literature, such as relative risk, absolute risk, or the number needed to treat, differ considerably from an objective, criterion based assess-ment24. Similarly, most doctors misunderstand numerical
data regarding test accuracy, regardless of whether they are presented as sensitivity and specificity or likelihood ratios25,
and fail to use relevant numerical information, such as disease prevalence, when they interpret the results of diagnostic tests20,26. Were doctors less prone to framing bias than patients, it would be possible to simply warn doctors of the Table 2. Distributions of Perceptions of Benefit of a New Treatment, by Rsk Presentation Format, Among 1439 Doctors and 1121 Patients
Recently Discharged from Hospital, in Geneva, Switzerland Doctors
Clearly better Somewhat better About the same Somewhat worse Clearly worse
Comprehensive information*, N=242 27.7% 42.1% 29.3% 0.8% 0.0%
Absolute survival (96% v. 94%), N=245 7.8% 44.1% 41.2% 5.3% 1.6%
Absolute mortality (4% v. 6%), N=243 27.2% 41.2% 28.8% 2.9% 0.0%
Relative mortality reduction (by one third), N=224 67.0% 26.8% 5.8% 0.4% 0.0%
Number needed to treat (50 to avoid 1 death), N=239 34.3% 47.3% 16.3% 1.3% 0.8%
Relative survival extension (by half), N=245 60.4% 31.4% 7.3% 0.4% 0.4%
Patients
Clearly better Somewhat better About the same Somewhat worse Clearly worse
Comprehensive information*, N=264 23.5% 47.7% 24.8% 2.3% 1.9%
Absolute survival (96% v. 94%), N=286 14.7% 37.1% 36.4% 8.7% 3.1%
Absolute mortality (4% v. 6%), N=298 20.8% 46.0% 27.5% 3.0% 2.7%
Relative mortality reduction (by one third), N=271 48.0% 41.3% 7.7% 1.8% 1.1%
* Absolute survival, absolute mortality, and relative mortality reduction
Table 3. Proportions of Doctors and Patients with a Positive Perception of the Benefits of a New Treatment (Clearly Better or
Somewhat Better) Risk presentation
format
Doctors Patients P value comparing doctors and patients
1) Comprehensive information* 69.8% 71.2% 0.73 2) Absolute survival 51.8% 51.7% 0.98 3) Absolute mortality 68.3% 66.8% 0.71 4) Relative mortality reduction 93.8% 89.3% 0.11 P value comparing formats 1-4 <0.001 <0.001
5) Number needed to treat 81.6% NA NA 6) Relative survival extension 91.8% NA NA P value comparing formats 1-6 <0.001 NA
* Absolute survival, absolute mortality, and relative mortality reduction
Table 4. Odds Ratios for a Positive Perception of the Benefits of a New Treatment
Odds ratio (95% CI) P value
Risk presentation format
(versus comprehensive information)
Absolute survival 0.45 (0.35– 0.58) <0.001 Absolute mortality 0.87 (0.67– 1.13) 0.29 Relative mortality reduction 4.40 (3.05– 6.34) <0.001 Number needed to treat* 1.79 (1.21– 2.66) 0.004 Relative survival extension* 4.55 (2.74– 7.55) <0.001 Doctor (versus patient) 1.06 (0.87– 1.29) 0.55 * only tested among doctors
patients’ limited capacity to interpret numerical risk data, and suggest various communication aids to improve patient un-derstanding. As it is, doctors themselves may not be aware of the problem. More systematic reporting of absolute risks may be advisable in medical research reports and other original sources of medical information used by doctors. In this our findings support the recent addition to the CONSORT state-ment that“For binary outcomes, presentation of both relative and absolute effect sizes is recommended”27.
The comparability of framing effects in doctors and patients and the lack of any meaningful subgroup difference both suggest that framing biases are widespread, if not universal. However, we were not able to examine the personal context of the respondent, notably the direct relevance of the treatment under consider-ation. It is possible that study results are examined more carefully by potential users of a treatment, and that framing biases may be less prominent in such a situation.
Strengths and Limitations
We have used a robust design—randomized scenario-based trial—and applied it to large samples of patients and doctors, who are directly concerned by risk framing and treatment decisions. All scenarios described identical study results, so that only framing of information could explain the differences between responses.
The main limitation of the study is that only one situation was depicted. We do not know what would have happened had we described risks of an event other than death, if the risks had been 20% and 30%, instead of 4% and 6%, if the relative mortality reduction had been of one half or one tenth instead of one third, etc. Nevertheless the intent of this study was not to establish some universally valid constants (we do not believe that they exist), but rather to identify the format that best approaches the fully informed condition. We believe that the general answers that we obtained—absolute risks are the least biased, doctors are as sensitive to framing bias as patients—have a more general validity than any specific percentages obtained in this study.
Another limitation is that we do not know whether our “comprehensive information” condition achieved its purpose for all respondents. In real life, an optimal information process would allow for additional questions, further explanations, and sufficient time to reflect on the information, all things that could not be offered via a scenario. Therefore replication of our findings in clinical studies would be useful. A clinical study would also confirm whether our results hold for actual deci-sions, which is always a concern for simulation studies. In this case, we would argue that the real-life and simulated situations are similar, as both entail reading numerical results of a study and forming an opinion about the new drug. Finally, a clinical study would allow an exploration of the link between percep-tions of benefit and actual decisions to prescribe, recommend, or agree to a new treatment.
As for most surveys, selection bias is a concern. Skipping the scenario was common among patients, particularly among older and less educated patients. This suggests that despite pretests, understanding and answering the scenario was not trivial. Whether this reflects a general difficulty inherent in interpreting risk data, or specific features of our scenario, cannot be determined. Finally, participation was
average in both surveys (56% and 65%), which can also cause selection bias.
CONCLUSIONS
Presentation of study results in terms of absolute mortality risks leads to least biased perceptions of the benefit of a new treatment, when a combination of three risk formats is used as the reference. In comparison, relative presentations of benefit cause an opti-mistic bias, and survival proportions induce a pessiopti-mistic bias. Doctors are just as prone to these biases as patients.
Acknowledgment: The doctor survey was funded by an internal Research & Development grant, University Hospitals of Geneva; the patient survey was funded by the hospital’s Quality of Care Program. The funder had no role in the design and conduct of the study; collection, management, analysis, and interpretation of the data; and preparation, review, or approval of the manuscript.
Conflict of Interests: None disclosed.
Corresponding Author: Thomas V. Perneger; MD, PhD, Division of clinical epidemiology, University Hospitals of Geneva, 4 rue Gabrielle-Perret-Gentil CH-1211, Geneva, Switzerland (e-mail: [email protected]).
REFERENCES
1. McGettigan P, Sly K, O’Connell D, Hill S, Henry D. The effects of information framing on the practices of physicians. J Gen Intern Med 1999;14:633–42
2. Edwards A, Elwyn G, Covey J, Matthews E, Pill R. Presenting risk information: a review of the effects of framing and other manipulations on patient outcomes. J Health Commun 2001;6:61–82
3. Moxey A, Dip G, O’Connell D, McGettigan P. Describing treatment effects to patients: How they are expressed makes a difference. J Gen Intern Med 2003;18:948–95
4. Covey J. A meta-analysis of the effects of presenting treatment benefits in different formats. Med Decis Making 2007;27:638–54
5. Malenka DJ, Baron JA, Johansen S, Wahrenberger JW, Ross JM. The framing effect of relative and absolute risk. J Gen Intern Med 1993;8:543–8
6. Hux JE, Naylor CD. Communicating the benefits of chronic preventive therapy: does the format of efficacy data determine patients’ acceptance of treatment? Med Decis Making 1995;15:152–7
7. Misselbrook D, Armstrong D. Patients’ responses to risk information about the benefits of treating hypertension. Br J Gen Practice 2001;51:276–9 8. Chao C, Studts JL, Abell T et al. Adjuvant chemotherapy for breast cancer: how presentation of recurrence risk influences decision-making. J Clin Oncol 2003;21:4299–305
9. Carling CLL, Kristoffersen DT, Montori VM et al. The effect of alternative summary statistics for communicating risk reduction on deci-sions about taking statins: a randomized trial. PLOS Med 2009;6:e1000134 10. Bucher HC, Weinbacher M, Gyr K. Influence of method of reporting study results on decision of physicians to prescribe drugs to lower cholesterol concentration. BMJ 1994;309:761–4
11. Epstein RM, Alper BS, Quill TE. Communicating evidence for partici-patory decision making. JAMA 2004;291:2359–66
12. Gigerenzer G, Wegwarth O, Feufel M. Misleading communication of risk. BMJ 2010;341:791–2
13. Schwartz PH, Meslin EM. The ethics of information: absolute risk reduction and patient understanding of screening. J Gen Intern Med 2008;23:867–70
14. Edwards A, Elwyn G. Understanding risk and lessons for clinical risk communication about treatment preferences. Qual Health Care 2001;10 (Suppl 1):i9-i13
15. Stovring H, Gyrd-Hansen D, Kristiansen IS, Nexoe J, Nielsen JB. Communicating effectiveness of intervention for chronic diseases: what single format can replace comprehensive information? BMC Med Inform Decis Making 2008;8:25
16. Carling CLL, Kristoffersen DT, Oxman AD et al. The effect of how outcomes are framed on decisions about whether to take antihyperten-sive medication: a randomized trial. PLOS One 2010;5:e9469
17. Armstrong K, Schwartz JS, Fitzgerald G, Putt M, Ubel PA. Effect of framing as gain versus loss on understanding and hypothetical treat-ment choices: survival and mortality curves. Med Decis Making 2002;22:76–83
18. Peters E, Hart PS, Fraenkel L. Informing patients: the influence of numeracy, framing, and format of side effect information on risk perceptions. Med Decis Making. 2010; (epub).
19. Deom M, Agoritsas T, Perneger TV. What doctors think about the impact of managed care tools on quality of care, costs, autonomy, and relations with patients. BMC Health Services Res 2010;10:331 20. Agoritsas T, Courvoisier DS, Combescure C, Deom M, Perneger TV.
Does prevalence matter to physicians in estimating post-test probability? A randomized trial. J Gen Intern Med 2011;26:373–8
21. Agoritsas T, Perneger TV. Patient-reported conformity of informed consent procedures and participation in clinical research. QJM Int J Med 2011;104:151–9.
22. Agoritsas T, Deom M, Perneger TV. Study design attributes influenced patients’ willingness to participate in clinical research: a randomized vignette-based study. J Clin Epidemiol. 2011;64–107.
23. Lee ET. Statistical Methods for Survival Data Analysis. 2ndedition. New
York: John Wiley & Sons, 1992, p 133.
24. Young JM, Glasziou P, Ward JE. eneral practitioners’ self ratings of skills in evidence based medicine: validation study. BMJ. 2002;324:950– 951.
25. Puhan MA, Steurer J, Bachmann LM, ter Riet G. A randomized trial of ways to describe test accuracy: the effect on physicians' post-test probability estimates. Ann Intern Med 2005;143:184–9.
26. Sox CM, Doctor JN, Koepsell TD, Christakis DA. The influence of types of decision support on physicians' decision making. Arch Dis Child 2009;94:185–90.
27. Schultz KF, Altman DG, Moher D. for the CONSORT Group. CONSORT 2010 statement: updated guidelines for reporting parallel group rando-mised trials. BMJ 2010;340:c332.