HAL Id: hal-01830630
https://hal.archives-ouvertes.fr/hal-01830630
Submitted on 5 Jul 2018HAL is a multi-disciplinary open access archive for the deposit and dissemination of sci-entific research documents, whether they are pub-lished or not. The documents may come from teaching and research institutions in France or abroad, or from public or private research centers.
L’archive ouverte pluridisciplinaire HAL, est destinée au dépôt et à la diffusion de documents scientifiques de niveau recherche, publiés ou non, émanant des établissements d’enseignement et de recherche français ou étrangers, des laboratoires publics ou privés.
Mixotrophic metabolism by natural communities of
unicellular cyanobacteria in the western tropical South
Pacific Ocean
Solange Duhamel, France van Wambeke, Dominique Lefèvre, Mar Benavides,
Sophie Bonnet
To cite this version:
Solange Duhamel, France van Wambeke, Dominique Lefèvre, Mar Benavides, Sophie Bonnet. Mixotrophic metabolism by natural communities of unicellular cyanobacteria in the western tropi-cal South Pacific Ocean. Environmental Microbiology, Society for Applied Microbiology and Wiley-Blackwell, 2018, �10.1111/1462-2920.14111�. �hal-01830630�
Reference : Duhamel, S., Van Wambeke, F., Lefevre, D., Benavides, M., Bonnet, S. Mixotrophic 1
metabolism by natural communities of unicellular cyanobacteria in the western tropical 2
South Pacific Ocean, Environmental Microbiology and Environmental Microbiology 3
Reports, doi.org/10.1111/1462-2920.14111. 4
5
Mixotrophic metabolism by natural communities of unicellular cyanobacteria in the
6
western tropical South Pacific Ocean
7 8
1,*
Solange Duhamel, 2France Van Wambeke, 2Dominique Lefevre, 2,3,4Mar Benavides, 2,3Sophie 9
Bonnet 10
11
1
Lamont Doherty Earth Observatory, Columbia University, Palisades, NY 10964, USA 12
2
Aix Marseille Université, Université de Toulon, CNRS, IRD, Mediterranean Institute of 13
Oceanography (MIO) UM 110, 13288, Marseille, France 14
3
Aix Marseille Université, Université de Toulon, CNRS, IRD, Mediterranean Institute of 15
Oceanography (MIO) UM 110, 98848, Noumea, New Caledonia 16
4
Now at: Marine Biological Section, Department of Biology, University of Copenhagen, 17
Strandpromenaden 5, 3000 Helsingør, Denmark 18
19
*
Corresponding author: S Duhamel, Lamont-Doherty Earth Observatory of Columbia 20
University, 61 Route 9W, Palisades, NY 10964-8000, USA 21
E-mail: sduhamel@ldeo.columbia.edu; Phone: 845-365-8774; Fax: 845-365-8150 22
23
Running title: Mixotrophy in natural marine cyanobacteria 24
Originality-Significance Statement: Marine unicellular cyanobacteria of the genus 26
Prochlorococcus and Synechococcus are major contributors to primary production and carbon 27
(C) export in the open ocean. These picocyanobacteria are considered to be photoautotrophic, but 28
recent evidence suggests they may also benefit from assimilation of organic compounds 29
(mixotrophy). Most studies investigating the light-dependent organic C uptake potential of 30
marine cyanobacteria have been performed with cultures, while only one field study has 31
demonstrated glucose uptake by Prochlorococcus in the Atlantic Ocean. Hence, in situ data is 32
lacking to assess the potential mixotrophic nutrition of these globally relevant marine 33
cyanobacteria, how it compares to their autotrophic nutrition mode (CO2 fixation), and its
34
environmental controls (nutrients, light levels, etc.). 35
To fill this gap, we used a combination of radiolabeled organic molecules in incubation 36
experiments where both light availability and photosynthetic electron transport were controlled, 37
followed by flow cytometry cell sorting to separate picoplankton groups in natural samples along 38
an oligotrophic to ultraoligotrophic transect in the Western Tropical South Pacific (WTSP) 39
Ocean. Our results demonstrate that natural Prochlorococcus and Synechococcus can incorporate 40
organic molecules, including glucose, and that rates are reduced in the dark or when 41
photosynthesis is inhibited. This mixotrophic metabolism by unicellular cyanobacteria was 42
widespread in the tested trophic gradient in the WTSP Ocean. In comparison, the low-DNA-43
content bacteria, a group dominated by photoheterotrophic bacteria from the SAR11 group, also 44
presented large (~35%) light-enhanced cell-specific glucose uptake, but generally lower than for 45
Prochlorococcus and Synechococcus (~50%). Nevertheless, parallel group specific C uptake 46
from 14C-sodium bicarbonate suggest that the most abundant marine phytoplankton, 47
Prochlorococcus and Synechococcus remain primarily autotrophic. Our results also indicate that 48
mixotrophy by marine picocyanobacteria is more likely to be an adaptation to low inorganic 49
nutrient availability as cell specific uptake rates of organic molecules containing nutrients were 50
much higher (35.5±16.5 time for leucine uptake by Prochlorococcus) than for glucose. 51
These findings are a significant contribution for developing a mechanistic understanding 52
of the diverse cellular physiologies of different bacterioplankton groups, and to improve our 53
understanding of microbial adaptations to light and nutrient availability, but also our knowledge 54
of marine dissolved organic matter cycling, and the role of light in bacterioplankton 55
biogeochemical functions in the ocean. 56
57
Keywords: cyanobacteria; mixotrophy; photoheterotrophy; carbon cycling; organic molecules 58
Conflict of Interest: The authors declare no conflict of interest 59
Summary
6061
Cyanobacteria are major contributors to ocean biogeochemical cycling. However, 62
mixotrophic metabolism and the relative importance of inorganic and organic carbon 63
assimilation within the most abundant cyanobacteria are still poorly understood. We 64
explore the ability of Prochlorococcus and Synechococcus to assimilate organic 65
molecules with variable C:N:P composition and its modulation by light availability and 66
photosynthetic impairment. We used a combination of radiolabeled molecules 67
incubations with flow cytometry cell sorting to separate picoplankton groups from the 68
western tropical south Pacific Ocean. Prochlorococcus and Synechococcus assimilated 69
glucose, leucine, and ATP at all stations, but cell-specific assimilation rates of N and P 70
containing molecules were significantly higher than glucose. Incubations in the dark or 71
with an inhibitor of photosystem II resulted in reduced assimilation rates. Light-enhanced 72
cell-specific glucose uptake was generally higher for cyanobacteria (~50%) than for the 73
low nucleic acid fraction of bacterioplankton (LNA, ~35%). Our results confirm previous 74
findings, based mainly on cultures and genomic potentials, showing that Prochlorococcus 75
and Synechococcus have a flexible mixotrophic metabolism, but demonstrate that natural 76
populations remain primarily photoautotrophs. Our findings indicate that mixotrophy by 77
marine cyanobacteria is more likely to be an adaptation to low inorganic nutrient 78
availability rather than a facultative pathway for carbon acquisition. 79
Introduction
80Unicellular marine cyanobacteria (e.g., Prochlorococcus and Synechococcus) are 81
major contributors to primary production and carbon (C) export in the open ocean (Li et 82
al., 1983, Richardson & Jackson 2007, Johnson & Lin 2009, Martiny et al., 2009). 83
Cyanobacteria are aerobic oxygenic prokaryotes that use a chlorophyll-based light-84
harvesting complex and CO2 as a C source. Therefore, marine representatives have been
85
classically considered photoautotrophs (Karl 2007), and Prochlorococcus and 86
Synechococcus have long been considered to be unable to use organic C sources such as 87
glucose (Waterbury et al., 1986, Béjà & Suzuki 2008). However, the simple picture that 88
marine cyanobacteria are purely photoautotrophic is actually much more complex. 89
Indeed, recent molecular evidences indicate that organic compound uptake genes are 90
ubiquitous within marine picocyanobacteria (Yelton et al., 2016), suggesting that these 91
photosynthetic microorganisms may present mixotrophic metabolism. Prochlorococcus 92
and Synechococcus have the genetic capacity to use not only organic molecules with key 93
limiting chemical elements such as nitrogen (N) and phosphorus (P), but also molecules 94
devoid of such elements, such as glucose (Gao and Xu 2012, Gomez-Baena et al., 2008, 95
Muñoz-Marín et al., 2013, 2017, Yelton et al., 2016). Unicellular marine cyanobacteria 96
are thus potentially capable of degrading and assimilating a wide range of organic 97
molecules, but only a handful of studies have measured assimilation rates of some 98
selected organic molecules such as amino acids, adenosine-5’-triphosphate (ATP) or 99
dimethylsulfoniopropionate (Michelou et al., 2007, Mary et al., 2008a,b Duhamel et al., 100
2012, Ruiz-Gonzalez et al., 2012b, Björkman et al., 2015, Evans et al., 2015). Results 101
suggest that marine picocyanobacteria may obtain nutrients mixotrophically via the 102
uptake of N and/or P-containing organic molecules when facing nutrient limitation 103
(Yelton et al., 2016). 104
Direct evidences that marine picocyanobacteria use organic molecules to obtain 105
energy or C are scarce, particularly under in situ conditions. To date, only one study by 106
Muñoz-Marín et al. (2013) demonstrated that Prochlorococcus in the Atlantic Ocean can 107
take up organic C lacking other essential nutrients at nanomolar concentrations in the 108
light (using radiolabeled glucose). A limited number of studies have attempted to 109
quantify the relative contribution of mixotrophy compared to photoautotrophy in C 110
assimilation by natural communities of marine cyanobacteria. First attempts to quantify 111
the contribution of glucose uptake to total C assimilation in Prochlorococcus indicated 112
that it may be very small (<1%; Muñoz-Marín et al. 2013). However, measurements of C 113
assimilation from inorganic and organic substrates were done separately (in the same 114
sampling area but on separate cruises and by different users) and only one taxon was 115
considered, making comparison between fluxes and taxonomic groups difficult (Paoli et 116
al., 2008, Muñoz-Marín et al., 2013, Benavides et al., 2017). Thus, it is still unclear if 117
organic C assimilation by marine unicellular cyanobacteria is ubiquitous, and how it 118
contributes to total C uptake to different groups of picocyanobacteria (e.g. high-light and 119
low-light adapted Prochlorococcus and Synechococcus, Partensky & Garczarek, 2010) in 120
comparison to CO2 fixation.
121
Additional critical gaps in our understanding of picocyanobacteria mixotrophic 122
metabolism concern regulating factors. In particular, we still don’t know how organic C 123
assimilation by marine unicellular cyanobacteria depends upon light availability and 124
photosynthetic electron transport in natural settings (Moore, 2013). Recent findings 125
showed that light enhances picocyanobacteria uptake rates of amino acids, ATP or 126
dimethylsulfoniopropionate (Michelou et al., 2007, Mary et al., 2008a, Duhamel et al., 127
2012, Ruiz-Gonzalez et al., 2012b, Björkman et al., 2015, Evans et al., 2015). 128
Interestingly, organic nutrient assimilation by the low nucleic acid bacterioplankton 129
(LNA), which has been shown to be numerically dominated by the photohererotrophs 130
SAR11 (Mary et al., 2006, Hill et al., 2010, Gómez-Pereira et al., 2013, Zubkov et al., 131
2015), was enhanced to a comparable extent to that by Prochlorococcus (Gómez-Pereira 132
et al., 2013). However, the mechanisms of this light enhancement are not well 133
understood. Recently, Muñoz-Marín et al. (2017) explored the potential role of 134
photosynthetic electron transport in the regulation of glucose uptake by Prochlorococcus 135
SS120 in laboratory cultures. Using different photosynthesis inhibitors, they showed that 136
glucose uptake was significantly reduced or even inhibited. This remains untested with 137
natural populations. 138
To improve our understanding of marine unicellular cyanobacteria utilization of 139
organic molecules and answer pressing questions about their mixotrophic metabolism in 140
the wild, we conducted a set of experiments in the WTSP during the OUTPACE cruise 141
(Oligotrophy to UlTra-oligotrophy PACific Experiment). Based on the ubiquity of 142
picocyanobacterial organic compound uptake genes (Yelton et al. 2016), but low glucose 143
uptake rates by Prochlorococcus in the Atlantic Ocean (Muñoz-Marín et al. 2013), we 144
hypothesize that mixotrophy by Prochlorococcus and Synechococcus is an adaptation to 145
nutrient limitation rather than a facultative pathway for carbon acquisition. To test this 146
hypothesis, we measured group-specific assimilation rates of organic molecules 147
containing C only, C and N, or C, N and P (glucose, leucine, and ATP, respectively) in 148
Prochlorococcus and Synechococcus. We then compared C assimilation from glucose 149
and sodium bicarbonate to test how much C is assimilated via autotrophic or mixotrophic 150
pathways. We also compared the light enhancement of leucine, ATP, and for the first 151
time, glucose, by natural Prochlorococcus, Synechococcus and LNA, and tested the 152
effect of the photosystem II inhibitor 3-(3,4-dichlorophenyl)-1,1-dimethylurea (DCMU). 153
We hypothesize that as for organic nutrient assimilation, organic C uptake is enhanced in 154
the light, and that it is partially tied to photosynthetic electron transport. 155
156
Results
157Description of the study area 158
Three incubation experiments were carried out in the WTSP at the long duration (LD, 72 159
h) stations A, B and C (thereafter LDA, LDB, LDC, respectively) chosen for their 160
contrasted biogeochemical conditions (Table 1, Moutin et al. 2017). At LDA and LDB, 161
seawater was sampled within the well-lit top mixed layer (ML at 54% PAR, 7 and 9 m 162
depths, respectively) and at the deep chlorophyll maximum (DCM, 0.3% PAR, 70 and 90 163
m, respectively), while LDC was sampled at 60 m depth (10% PAR), to compare results 164
between microbial communities adapted to different light levels and nutrient conditions. 165
The ML was 14, 21, and 34 m deep, at LDA, LDB, and LDC, respectively (Moutin et al., 166
2018). 167
Station LDA was relatively oligotrophic (Table 1), with moderately high 168
chlorophyll a concentrations compared to typical open ocean regional values (0.36±0.05 169
μg l−1, Benavides et al., 2017). Station LDB was sampled in an elevated chlorophyll a 170
patch, about twofold the concentration at LDA in the ML (0.83±0.07 μg l−1, Benavides et 171
al., 2017; de Verneuil et al., 2018). Compared to LDA, LDB exhibited similar low 172
nutrient concentrations in the ML but depleted inorganic nutrients at the DCM (Table 1). 173
Prochlorococcus, Synechococcus and LNA abundances were 2.3, 1.4 and 3.6-fold higher 174
in the ML of LDB than at LDA; and respectively were 2.3–6.1, 13.1–31.8 and 1.5–4.5 175
fold higher in the ML than at the DCM (Table 1). LDC presented characteristics of the 176
oligotrophic south Pacific gyre (lower surface chlorophyll concentrations and deeper 177
DCM, Claustre et al., 2008, Moutin et al. 2017). Glucose concentrations were on average 178
2.6 to 4.3-fold higher at LDA than at LDB and LDC. Leucine and ATP concentrations 179
were on average 1.4 to 4.5-fold higher at LDA than at LDB and LDC (Table 1). 180
181
Assimilation rates of organic molecules in light incubations 182
The assimilation of radiolabeled organic molecules with C alone, or C with N or P 183
(glucose, leucine and ATP, respectively) was measured in separate incubations. Flow 184
sorting of radiolabeled cells after incubation in the light showed that Prochlorococcus, 185
Synechococcus and LNA assimilated glucose, leucine and ATP at all sampled stations 186
and depths (Fig.1). Group-specific assimilation rates of glucose followed trophic 187
gradients and were generally higher at LDB>LDA>LDC, and higher in the ML than at 188
the DCM (Fig. 1 a, b). Cell specific rates of glucose assimilation by LNA were 4.8 and 189
1.7-fold higher than Prochlorococcus in the ML at LDA and LDB, respectively, and 2.3-190
fold higher at LDA-DCM, but Prochlorococcus presented higher cell specific rates than 191
LNA at LDB-DCM and LDC-60m (4.1 and 1.3 times, respectively, Fig. 1a). 192
Synechococcus presented 1.4±0.2-fold higher cell specific assimilation rates than 193
Prochlorococcus at LDB (p<0.05) and LDC, but about half the rate by Prochlorococcus 194
at LDA, although differences were not significant at LDA and LDC. Because 195
Synechococcus was much less abundant than Prochlorococcus and LNA (on average 196
Prochlorococcus, Synechococcus and LNA represented 46±5, 2±2 and 52±7% of the 197
cumulated abundance (Prochlorococcus+Synechococcus+LNA), respectively; Table 1), 198
the contribution of the Synechococcus group to glucose assimilation rates was at least an 199
order of magnitude lower than that of Prochlorococcus and LNA groups (0.90±1.12, 200
0.08±0.11 and 1.95±2.52 pmol Glc l-1 h-1 on average, for Prochlorococcus, 201
Synechococcus and LNA groups, respectively, Fig. 1b). Consequently, Synechococcus 202
accounted for < 3% of the total glucose assimilation by the three combined sorted groups 203
(Prochlorococcus+Synechococcus+LNA), while LNA accounted for > 65% at LDA and 204
LDB-ML, and Prochlorococcus contributed to 70 and 54% at LDB-DCM and LDC. 205
Thus, Prochlorococcus can be a large contributor to glucose assimilation rates in 206
comparison to SAR11-like photoheterotrophic groups. But compared to the total 207
microbial community glucose assimilation (i.e. bulk rates), Prochlorococcus accounted 208
for only 4.9±3.3%, similar to results obtained in the Atlantic Ocean (Muñoz-Marín et al., 209
2013). 210
Group-specific assimilation rates of leucine and ATP were also higher at LDB 211
and LDA than at LDC, and were higher in the ML than at the DCM (p<0.05, Fig. 1). On 212
average, Prochlorococcus and LNA groups accounted for 50±23 and 21±7% of leucine 213
assimilation by the total microbial community, respectively; and 17±12 and 40±17% of 214
ATP assimilation by the total microbial community, respectively. The Synechococcus 215
group contributed to < 1% of the leucine and ATP assimilation by the total microbial 216
community. Cell specific leucine and ATP assimilation rates by Synechococcus were 217
roughly an order of magnitude lower than by Prochlorococcus, except for ATP at LDB 218
and LDC, where assimilation rates by Synechococcus were similar to those by 219
Prochlorococcus. 220
221
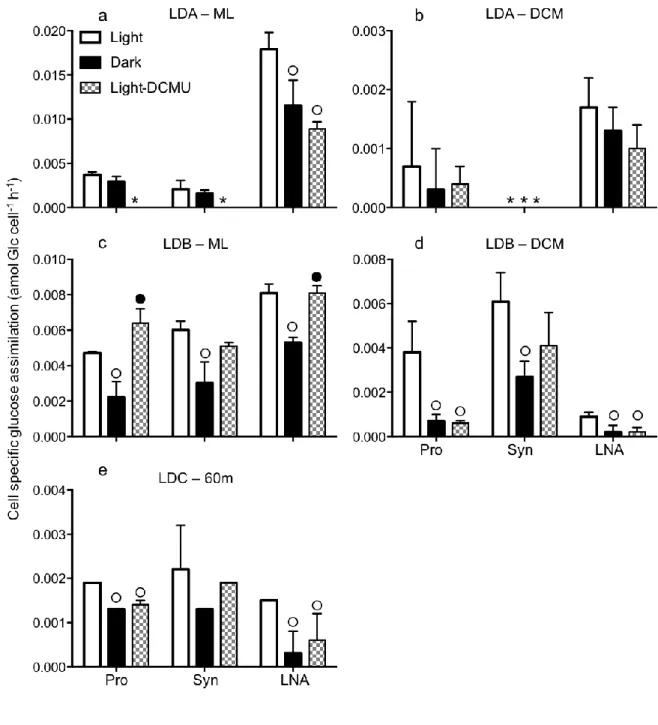
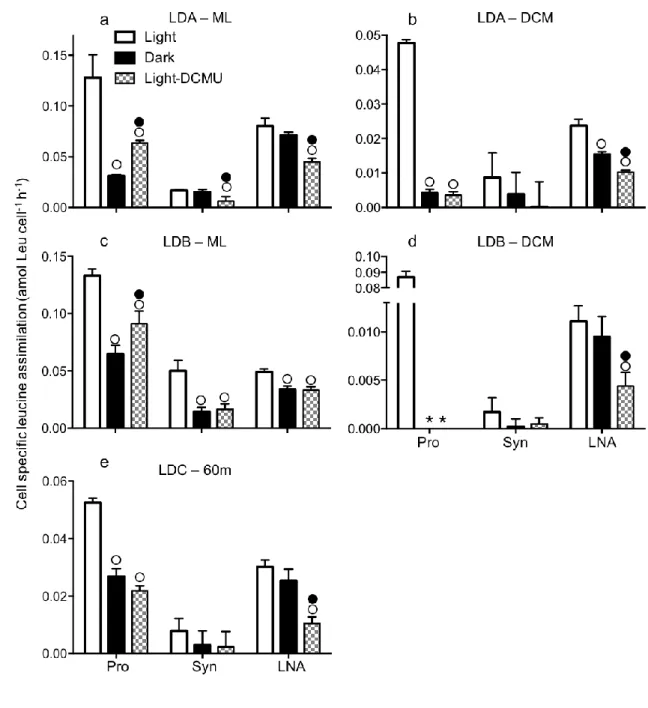
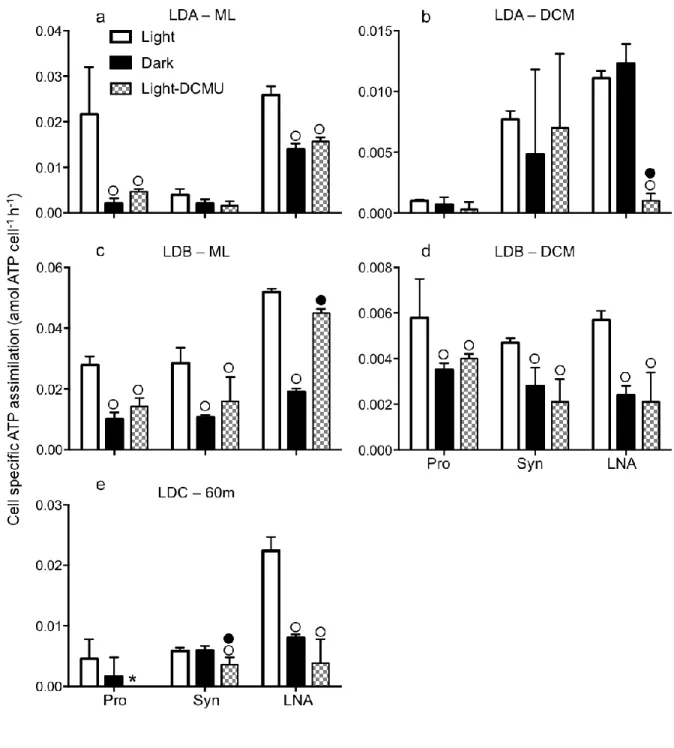
Light-enhanced uptake of organic molecules and relationship to photosynthesis 222
Flow sorting of labeled cells incubated in light or dark bottles showed that light 223
enhanced the cell specific uptake of all radiolabeled organic molecules tested here, 224
including glucose, and in most cases to a larger extent in Prochlorococcus and 225
Synechococcus as compared to LNA (Fig. 2). On average, incubations in the light 226
represented an enhancement of 44±18, 57±30 and 35±11% of dark glucose uptake, 227
73±23, 57±30 and 35±11% of dark leucine uptake and 56±25, 35±24 and 43±30% of 228
dark ATP uptake by Prochlorococcus, Synechococcus and LNA, respectively. In 229
comparison, incubations in the light represented an enhancement of 92±11 and 99±2% of 230
dark 14C-sodium bicarbonate uptake by Prochlorococcus and Synechococcus, 231
respectively; where dark uptake was negligible (Fig. 2g). Interestingly, the light 232
enhancement of organic molecule uptake rates was higher at the DCM than in the ML for 233
Prochlorococcus and Synechococcus (light to dark ratios of glucose, leucine and ATP 234
uptake were 1.3–2.1 (ML) vs. 2.2–5.5 (DCM), 1.1–4.1 (ML) vs. 2.2–11.4 (DCM), and 235
1.9–10.5 (ML) vs. 1.5–1.7 (DCM), respectively; Fig. 3, 4, 5). In comparison, light 236
enhancement of organic molecule uptake by LNA was mostly similar between ML and 237
DCM. In SYBR stained samples, high-DNA-content bacteria (HNA) could be properly 238
distinguished from Prochlorococcus only in samples from the DCM and differences 239
between light and dark incubations were either not significant or higher in the dark (t-test, 240
p<0.05, Fig. 2 b, d, f), and thus this group is not further discussed here. However, these 241
results indicate that the light enhancement of organic molecule assimilation by 242
Prochlorococcus could not be a result of by-sorting HNA bacteria overlapping in size 243
with Prochlorococcus. 244
Additions of the photosystem II inhibitor DCMU resulted in reduced 245
Prochlorococcus, Synechococcus and LNA glucose uptake to a level not statistically 246
different from rates in the dark, except for Prochlorococcus and LNA at LDB-ML where 247
uptake was higher in DCMU compared to the dark (Fig. 3). Cell specific leucine uptake 248
was lower when DCMU was added, significantly for Prochlorococcus and LNA at all 249
stations/depths but only in the ML for Synechococcus (Fig. 4). For Prochlorococcus, 250
DCMU resulted in higher or equal rates than in the dark while for LNA, DCMU resulted 251
in lower rates than in the dark. In most cases, DCMU resulted in decreased cell specific 252
ATP uptake for the three groups compared to light samples, but differences between dark 253
and DCMU were not significant (except for Synechococcus at LDC, Fig. 5). 254
255
Bacterial production 256
Because bacterial production is commonly measured using leucine or thymidine 257
assays, the effect of light and DCMU on the incorporation rates of leucine and thymidine 258
into trichloroacetic acid (TCA) insoluble material (Leuinc and Tdrinc, respectively) was
259
estimated in separate incubations. Light affected Leuinc to a larger extent than Tdrinc (Fig.
260
6a, b, e). Leuinc and Tdrinc rates were 12–57% (40±21%) and 2–27 % (11±14%) lower in
261
the dark than in the light, respectively (Fig 6e). The addition of DCMU resulted in an 262
average decrease of 68±10% and 49±23% in Leuinc and Tdrinc rates in the light,
respectively (Fig. 6a, b). The Leuinc to Tdrinc ratio was on average 1.6±0.5 times higher in
264
the light than in the dark, 1.5±0.3 times higher in the light than with DCMU (Fig.6c). 265
266
Discussion
267Characterization of Prochlorococcus and Synechococcus mixotrophic metabolism. 268
Owing to their capability to utilize sunlight and atmospheric CO2 for growth,
269
Prochlorococcus and Synechococcus are commonly considered photoautotrophs. Yet, 270
recent evidence has shown that the uptake of organic N- (leucine, amino acids) and P- 271
(ATP) molecules by Prochlorococcus and Synechococcus is enhanced in the light 272
(Michelou et al., 2007, Mary et al., 2008b, Duhamel et al., 2012, Gomez-Pereira et al., 273
2013). Therefore previous studies (e.g. Björkman et al., 2015, Gomez-Pereira et al., 2012, 274
Michelou et al., 2007, Moore 2013, Muñoz-Marín et al., 2013, 2017, Zubkov 2009, 275
Zubkov et al., 2003) since the early work of Rippka (1972) have commonly defined this 276
nutritional plasticity in marine cyanobacteria as photoheterotrophy, although sensus 277
stricto this term defines organisms that use light for energy, but cannot use CO2 as their
278
sole C source. However, these studies demonstrating light-enhancement of N or P-279
containing organic molecules uptake did not directly verify if marine cyanobacteria could 280
also use organic molecules containing only C (e.g. glucose) and if light also enhances 281
organic C assimilation. To the best of our knowledge, only Muñoz-Marín et al. (2013) 282
demonstrated that Prochlorococcus could assimilate glucose, a molecule devoid of 283
heteroatoms (N or P), in natural seawater. Our results geographically expand these 284
findings from the Atlantic Ocean and demonstrate that not only Prochlorococcus but also 285
Synechococcus assimilate glucose in biogeochemically distinct marine environments of 286
the WTSP. Interestingly, cell- and group- specific assimilation rates of glucose appeared 287
to follow trophic gradients, similar to organic C uptake by Trichodesmium (Benavides et 288
al., 2017). Further, we demonstrate that light enhanced cell specific glucose uptake by 289
nearly 50% for Prochlorococcus and Synechococcus, suggesting that variability in light 290
availability (e.g. changes in light intensity due to euphotic layer PAR gradient, diel 291
sunlight rhythm, cloud coverage) could largely impact organic C assimilation by these 292
cyanobacteria. Similar results were also found in cultures of the low-light 293
Prochlorococcus SS120 strain in which 24h incubation in the dark induced a 40% 294
decrease in glucose uptake (Gomez-Baena et al., 2008). Thus, marine cyanobacteria may 295
be a significant competitor of heterotrophic bacteria for this labile molecule, especially 296
during the day, potentially creating temporal patterns between strictly heterotrophic and 297
mixotrophic bacterioplankton. Expanding this finding to all labile C molecules, such 298
temporal patterns could affect dissolved organic matter (DOM) remineralization and C 299
sequestration via the microbial C pump. 300
We also explored the participation of photosynthetic electron transport in the 301
regulation of organic molecules assimilation using the photosynthesis inhibitor DCMU 302
(Rippka, 1972; Stanier, 1973; Neilson & Lewin, 1974; Paerl, 1991; Moore, 2013). In 303
chlorophyll and bacteriochlorophyll containing organisms, DCMU blocks electron flow 304
between photosystem II and plastoquinone, resulting in no O2 and NADPH production,
305
but allowing ATP synthesis through cyclic electron flow around photosystem I. Our 306
results show that DCMU completely inhibited CO2 fixation by Prochlorococcus and
307
Synechococcus but only partially inhibited their assimilation of glucose, leucine and 308
ATP. For most samples and molecules examined, the assimilation rates were significantly 309
higher or not statistically different in the light with DCMU compared to the dark, 310
suggesting that organic molecules incorporation is partially tied to photosynthetic 311
production of energy in the light. The light harvested by Prochlorococcus and 312
Synechococcus photosynthetic apparatus may thus transfer energy into ATP that can be 313
used in the active transport of organic molecules. Similarly, Muñoz-Marín et al. (2017) 314
found different inhibitory effects on Prochlorococcus SS120 glucose uptake using the 315
quinone analogue inhibitor of cytochrome b6f complex in photosystem I –DBMIB 316
(~100%), or the inhibitor of photosystem II –DCMU (~50%), and argued that the ATP 317
generated by photosystem I could maintain up to 50% of the glucose uptake. Seawater 318
used in our experiments was sampled in the early morning and thus cells were likely light 319
energy depleted, assuring that continuing uptake in our dark incubations was not a result 320
of stored energy during the light phase. Therefore, our results demonstrate that natural 321
populations of Prochlorococcus and Synechococcus are nutritionally and metabolically 322
flexible. We confirm that in situ, picocyanobacteria can assimilate selected organic 323
molecules including glucose, a molecule devoid of heteroatoms, and show that 324
assimilation rates are reduced but continue even in the dark or when photosynthesis is 325
impaired. This mixotrophic metabolism could explain the recent findings of the 326
substantial presence of Prochlorococcus in the aphotic ocean (Jiao et al., 2014) and the 327
survival of specific strains of Prochlorococcus in extended darkness (Coe et al., 2016). 328
329
Relative importance of mixotrophy for picocyanobacterial C assimilation. 330
Cell-specific glucose uptake in natural Prochlorococcus was on average 331
0.00021±0.00011 fg C cell-1 h-1, similar to results by Muñoz-Marín et al. (2013) in the 332
Atlantic Ocean (0.00010±0.00008 fg C cell-1 h-1, where added and ambient glucose 333
concentrations were comparable to those in our study). Synechococcus had higher cell 334
specific glucose assimilation rates than Prochlorococcus, but using an average biovolume 335
of 0.17 and 0.33 µm3 for Prochlorococcus and Synechococcus, respectively (Grob et al., 336
2007), we calculated that glucose uptake by Prochlorococcus and Synechococcus was 337
similar (0.0013±0.0007 and 0.0009±0.0005 fg C µm-3 h-1, respectively). Compared to 338
carbon uptake from 14C-sodium bicarbonate (4.4±1.7 and 44±36 fg C cell-1 d-1 for 339
Prochlorococcus and Synechococcus, respectively), glucose uptake represented a small 340
fraction (<1%) of total (inorganic + organic) C uptake, similar to the values calculated 341
using results in Muñoz-Marín et al. (2013). This implies that mixotrophy may represent a 342
marginal fraction of Prochlorococcus and Synechococcus C uptake in the Atlantic and 343
Pacific Oceans, and confirms culture-based studies where Prochlorococcus actively takes 344
up glucose when available, but remains primarily autotrophic (Muñoz-Marín et al., 345
2017). Yet considering that glucose is only one of the greatly diverse dissolved organic C 346
molecules present in the ocean (Moran et al., 2016), the low assimilation rates may be the 347
result of glucose uptake competition with other sugars. Thus, other organic C compounds 348
need to be tested as substrates for mixotrophic growth by marine cyanobacteria. 349
However, mixotrophy by marine picocyanobacteria may represent a greater advantage in 350
response to inorganic nutrient limitation than to access an alternative form of C. Indeed, 351
we found that cell specific uptake of leucine and ATP by Prochlorococcus were on 352
average 35.5±16.5 and 3.4±2.3 times greater than cell specific uptake rates of glucose 353
(mol:mol). Still, Muñoz-Marín et al. (2013) argued that the bioenergetic advantage of 354
glucose uptake vs. glucose synthesis de novo may save Prochlorococcus significant 355
energy for other metabolic uses. 356
357
Photoheterotrophy by LNA bacteria. 358
The LNA group has been previously characterized using molecular tools and 359
results consistently show that it is largely dominated by SAR11 (Mary et al., 2006, 360
2008b, Gomez-Pereira et al., 2013, Morán et al., 2015), a highly abundant group in the 361
subtropical Pacific (West et al., 2016). SAR11 is a clade of proteorhodopsin-based 362
photoheterotrophic bacteria, which are characterized by light-controlled growth and 363
proteorhodopsin expression (Lami et al., 2009). Like in other studies (Mary et al., 2008b, 364
Zubkov 2009, Gomez-Pereira et al., 2013, Evans et al., 2015) we showed that light 365
enhances the assimilation of leucine and ATP by the LNA group. In our experiments, 366
Tdrinc was an excellent proxy of strict heterotrophic bacterial production as the Tdrinc
367
rates were similar in light and dark incubations, unlike Leuinc rates (Fig. 6). This confirms
368
that increased Leuinc rates in the light were mostly due to photoheterotrophy and
369
mixotrophic capacities of Prochlorococcus, but not to an indirect effect related to 370
enhanced phytoplankton excretion/exudation in the light. Light-enhanced cell-specific 371
glucose uptake by LNA bacteria was large (~35%), albeit lower than for 372
Prochlorococcus and Synechococcus, implying that photons can supply a significant part 373
of the energy demand during daytime and the requirement for organic molecules as 374
energy sources is significantly decreased. Surprisingly, the addition of DCMU reduced 375
organic molecules incorporation by LNA. DCMU has been widely used to study 376
phytoplankton metabolism (Jeanjean 1976, Lewis et al., 1984, Garrigue et al., 1992, 377
Ikeya et al., 1997, DeLorenzo et al., 2001, Laurent et al., 2013, Halsey et al., 2014), 378
including photoheterotrophy (Estep & Hoering 1981, Paerl 1991, Johnson & Alric 2012, 379
Knoop et al., 2013, You et al., 2015, Oren et al., 2016, Muñoz-Marín et al., 2017). These 380
studies indicate that DMCU is not lethal, that its inhibitory effect is reversible and that it 381
does not affect heterotrophic processes, even in autotroph-heterotroph symbiotic 382
associations (Vandermeulen et al., 1972, Mühlbauer & Eichacker 1998, Francoeur et al., 383
2007). Combined with good efficiency against algal photosynthesis (Fig. 6d), and 384
because it was also chosen to study photoheterotrophic metabolism in culture isolates of 385
Prochlorococcus (Muñoz-Marín et al., 2017), we used DCMU as selective inhibitor of 386
the photosystem II in cyanobacteria. However, we observed a reduction in organic 387
molecules incorporation in LNA which suggests that DCMU affected LNA directly or 388
indirectly. A direct effect could be either toxicity on heterotrophic metabolism of strict 389
heterotrophs or an action on the light-driven proton pump, proteorhodopsin. Yet, at the 390
end of incubation, LNA cell abundances were similar between treatments, indicating that 391
DCMU may not be lethal to LNA. Moreover, DCMU did not inhibit the light-driven 392
proton pump of the cyanobacteria Gloeobacter violaceus which has two types of light-393
driven proton pumps, chlorophyll-based photosystems and rhodopsin (Choi et al., 2014). 394
Alternatively, the reduction of activity by LNA in DCMU samples may be indirect, 395
resulting from the inhibition of photosynthate production by phytoplankton 396
(photosynthesis was inhibited, Fig. 6d) on which bacteria rely greatly as a source of labile 397
organic substrates for growth (Church et al., 2004, Ruiz-Gonzalez et al., 2012a, 2013). 398
Implication of picocyanobacterial uptake of leucine for bacterial production 400
measurements in the ocean. 401
Despite being important for our understanding of biological productivity in the 402
ocean, light enhanced bacterial production and uptake of leucine by the most abundant 403
marine microbes, Prochlorococcus, Synechococcus and LNA, have been the subject of a 404
limited number of studies (Church et al., 2004, Michelou et al., 2007, Mary et al., 2008b, 405
Ruiz-Gonzalez et al., 2013, Björkman et al., 2015). In incubations with saturating 406
concentrations of leucine (20 nM), previous reports found that Prochlorococcus 407
contributes significantly to bacterial production estimates in the North Pacific (Björkman 408
et al., 2015), North Atlantic (Michelou et al., 2007) and Mediterranean Sea (Talarmin et 409
al., 2011a), both in dark or in the light. Here we show that light enhanced bulk Leuinc
410
rates (incorporation rates of leucine into TCA insoluble material), as well as cell-specific 411
leucine uptake by Prochlorococcus, Synechococcus and LNA in the tropical southwest 412
Pacific Ocean. However, light significantly enhanced bulk Tdrinc rates to a much lesser
413
extent (dark to light ratio was 73–100 %, mean 89%). This may be due to thymidine 414
being preferentially used by heterotrophic bacteria than leucine which can be used by 415
mixotrophic phytoplankton (Michelou et al., 2007, Björkman et al., 2015). Indeed, in our 416
samples, over a third of the total leucine uptake was attributable to the Prochlorococcus 417
group. Unfortunately, due to low thymidine specific activity, we were not able to measure 418
its group-specific uptake. This should be verified in future studies as cyanobacteria tested 419
so far do not incorporate Tdr in culture, which was related to a probable lack of 420
thymidine kinase (Pollard & Moriarty 1984). The contribution of picocyanobacteria to 421
bacterial production estimates, particularly using 3H-leucine, should thus be considered 422
when measuring bacterial production in marine environments, even in dark incubations 423
(Talarmin et al., 2011a, Björkman et al., 2015). Longnecker et al. (2006) found higher 424
Leuinc/Tdrinc ratio in dark incubated HNA than in the LNA group, and also higher in
425
surface samples than below, particularly in the open-sea station. Besides the general 426
hypothesis of higher rates of protein synthesis relative to DNA synthesis in larger cells, 427
this result could also be partially due to the difficulty to separate Prochlorococcus from 428
HNA during cell sorting after SYBR green DNA staining, particularly in sub-surface 429
waters. As seen from seawater cultures, the Leuinc/Tdrinc ratio can be representative of
430
decoupling between cell division and biomass production (Chin-Leo & Kirchman 1990). 431
In situ, Leuinc rates has been shown also to vary more than Tdrinc rates along diel cycles
432
(Riemann & Bell 1990). Consequently, the use of Leuinc/Tdrinc ratio as a proxy of
433
unbalanced growth should be misleading when samples are incubated in the light as we 434
demonstrated that it was also affected by photoheterotrophic processes (higher in the light 435
than in the dark or with DCMU). 436
437
Conclusion
438We present several lines of evidence that natural Prochlorococcus and 439
Synechococcus can assimilate organic molecules with variable C:N:P composition, as 440
well as organic molecules devoid of heteroatoms (i.e. glucose). Prochlorococcus and 441
Synechococcus assimilated organic molecules in the light but also in the dark or when 442
photosynthesis was altered by DCMU, albeit at significantly reduced rates, verifying 443
previous findings in culture indicating that cyanobacteria are nutritionally versatile. Yet 444
Prochlorococcus and Synechococcus C uptake from glucose was small compared to CO2
uptake, indicating that they obtain carbon primarily through an autotrophic metabolism. 446
Nevertheless, mixotrophy by these unicellular cyanobacteria was widespread in 447
biogeochemically distinct regions of the WTSP Ocean and cell and group-specific 448
assimilation rates were generally higher in surface than at the DCM. However, cell-449
specific assimilation rates of the N- and P- containing molecules (leucine and ATP) were 450
significantly higher than that of glucose. Thus, mixotrophy by marine cyanobacteria is 451
more likely to be an adaptation to low inorganic nutrient availability. Many details of 452
marine cyanobacteria mixotrophic metabolism remain to be elucidated. In particular, 453
additional experiments will be necessary to evaluate the global importance of organic vs. 454
inorganic C uptake by marine cyanobacteria and assess the diel variability in these 455
processes, in order to improve C fluxes models (Gasol et al., 2008, Zubkov 2009). 456
Further study of mixotrophic metabolism is likely to contribute not only to our 457
understanding of microbial adaptations to light and nutrient availability but also to our 458
knowledge of marine DOM cycling, and the role of light in modulating bacteria and 459
cyanobacteria biogeochemical functions in the ocean. 460 461
Experimental Procedures
462 Field sampling 463This study was conducted in the WTSP along trophic gradients during the 464
OUTPACE cruise (DOI: http://dx.doi.org/10.17600/15000900, RV L’Atalante, February– 465
April 2015) between New Caledonia and Tahiti (Moutin et al., 2017). Three incubation 466
experiments were carried out at the long duration stations LDA, LDB, and LDC, selected 467
for their contrasted biogeochemical conditions (Table 1). At LDA and LDB, seawater 468
was sampled within the well-lit top mixed layer (ML at 54% PAR, 7 and 9 m depths, 469
respectively) and at the DCM (0.3% PAR, 70 and 90 m, respectively). LDC was sampled 470 at 60 m depth (10% PAR). 471 472 Bacterioplankton enumeration 473
Bacterioplankton groups were enumerated from untreated samples using a BD 474
Influx flow cytometer (BD Biosciences, San Jose, CA, USA). Prochlorococcus and 475
Synechococcus were enumerated in unstained samples while the low-DNA-content 476
(LNA) and high-DNA-content (HNA) bacteria groups were discriminated in a sample 477
aliquot stained with SYBR Green I DNA dye (0.01% final), following published 478
protocols (Gasol et al., 1999, Duhamel et al., 2014). Using a forward scatter detector with 479
small particle option and focusing a 488 plus a 457 nm (200 and 300 mW solid state, 480
respectively) laser into the same pinhole greatly improved the resolution of dim surface 481
Prochlorococcus population from background noise in unstained samples. However, in 482
stained samples from the ML, Prochlorococcus overlapped with HNA bacteria and HNA 483
abundances were calculated by subtracting Prochlorococcus enumerated from unstained 484
samples. Calibration and alignment were done using 1-μm yellow-green microspheres 485 (Polysciences, USA). 486 487 Incubation experiments 488
Seawater collected at the LD stations was distributed into acid-washed and 489
sample rinsed transparent polycarbonate bottles for separate incubations with different 490
radioactive-labeled molecules and under different treatment conditions. For each 491
radioactive molecule tested, a killed control was prepared by adding paraformaldehyde 492
(0.5 % final w/v) for 30 min before adding the radioisotope. Bottles were incubated in 493
on-deck blue-shielded incubators to mimic the amount of transmitted light at the 494
corresponding sampled depth and cooled with surface seawater. Samples were treated 495
with or without addition of 3-(3,4-dichlorophenyl)-1,1-dimethylurea (DCMU, at 20 µM 496
final, for 15 min before adding the radioisotope). For dark incubations, the bottles were 497
masked using multi-layers of matte black aluminum foil (Rosco Matte Black Cinefoil). 498
For each treatment, D-[6-3H(N)]-glucose (45.7 Ci mmol-1), L-[3,4,5-3H(N)]-499
Leucine (112 Ci mmol-1) and [2,5’,8-3H]-Adenosine-5’-triphosphate (52 Ci mmol-1), 500
were used in separate incubations to measure assimilation rates of organic C alone 501
(glucose, Glc), and N- (leucine, Leu) and P- (Adenosine-5’-triphosphate, ATP) –enriched 502
organic compounds, respectively (Perkin Elmer, Waltham, MA, USA). Isotope additions 503
were kept as low as possible considering the specific activity and sensitivity of the cell 504
sorting procedure described below: 3H-glucose, 3H-leucine and 3H-ATP were added at a 505
final concentration of 2, 7 and 1 nmol l-1, respectively. Samples were incubated for 4 to 6 506
h and uptake linearity was checked before each experiment. Additional incubations were 507
done using [14C]-sodium bicarbonate (43.3 mCi mmol-1) at 3.3 µCi ml-1 final 508
concentration from dawn to dusk (~8 h). At the end of incubation, samples were fixed 509
with paraformaldehyde (0.5 % final, for 15-min in the dark), 20 µl were sampled to 510
measure total activity (dpm l-1, with β-phenylethylamine for 14C samples) and determine 511
the concentration of added molecules (S*, nmol l-1), 4-ml were filtered onto 0.2-µm 512
polycarbonate membranes to monitor incorporation by the total microbial community 513
(total activity –dpm l-1, and total microbial assimilation rate –nmol l-1 h-1) and 30 to 50 ml 514
was gently concentrated to 4 ml and preserved at -80°C for flow cytometry cell sorting. 515
Radioactivity was measured using scintillation cocktail with low background and high 3H 516
counting efficiency (Ultima Gold LLT, Perkin Elmer) and a Packard Tri-Carb 3110 TR 517
liquid scintillation counter with ultra-low-level option kit. The turnover time (h) was 518
calculated by dividing the total activity (dpm l-1) by the activity on the 0.2-µm filter (dpm 519
l-1 h-1). The total microbial assimilation rate (nmol l-1 h-1) was calculated by dividing the 520
substrate concentration (ambient concentration (Sa) plus S*) by the turnover time (h). The
521
ambient concentrations of glucose, leucine and ATP were estimated using a concentration 522
series bioassay of untreated live samples as described by Wright and Hobbie (1966) and 523
modified by Zubkov and Tarran (2005), which represents an upper estimate of ambient 524
concentrations. Thus, calculated assimilation rates represent an upper estimate of 525
assimilation rates at in situ concentrations. 526
527
Flow cytometry cell sorting 528
Bacterioplankton groups were characterized as described above. Note that 529
because of the overlap in Prochlorococcus with HNA in stained ML samples, we did not 530
systematically sort the HNA population for which results were biased by the contribution 531
of Prochlorococcus activity. The Influx flow cytometer was set at the highest sorting 532
purity (1.0 drop single mode) and potential attached cells were discarded using a pulse 533
width vs. forward scatter plot. The drop delay was calibrated using Accudrop Beads (BD 534
Biosciences, USA) and sorting efficiency was verified manually by sorting a specified 535
number of 1-μm yellow-green microspheres (Polysciences, USA) onto a glass slide and 536
counting the beads under an epifluorescence microscope. Using 1.0 drop single mode we 537
systematically recovered 100% of the targeted beads. Performance was validated by 538
sorting Prochlorococcus and Synechococcus from natural samples and reanalysing the 539
sorted cells flow cytometrically to confirm sort purity, which exceeded 96 %, a result 540
similar to Baer et al. (2017). Increasing numbers of cells from the same incubation 541
sample were sorted (20,000–600,000 LNA and 10,000–300,000 Prochlorococcus and 542
Synechococcus). Sorted cells were assessed by liquid scintillation following Talarmin et 543
al. (2011b). The 14C-labeled samples were acidified with 0.5 ml of 1N HCl for 24 h to 544
remove any unincorporated 14C-sodium bicarbonate. For each group, at least three 545
samples were sorted and regression analysis between the number of cells sorted and the 546
radioactivity taken up by the sorted cells was used to calculate the per cell activity (dpm 547
cell-1). Radioactivity in the killed control sorted samples (dpm cell-1) was deduced from 548
radiaoactivity in the respective sorted samples. The cell-specific assimilation rate (nmol 549
cell-1 h-1) was calculated by dividing the radioactivity per cell (dpm cell-1) by the total 550
microbial activity (dpm l-1) measured in the same treatment, and then multiplied by the 551
total microbial assimilation rate at ambient plus added organic substrate concentration 552
(Sa+S*, nmol l-1 h-1). Statistical tests (one-way ANOVA, Tukey's multiple comparisons
553
test) were carried out to assess significant differences between treatments (P < 0.05) 554
using Prism 6 (GraphPad software, La Jolla, CA, USA). 555
556
Bulk bacterial production 557
Samples were incubated with [methyl-3H]-thymidine (Tdr, 20 nM, 48.8 Ci mmol -558
1
) or with L-[3,4,5-3H(N)]- leucine (Leu, 6 nM, 112 Ci mmol-1) for 5 to 6 h. Killed 559
controls and incubation terminations were fixed with formalin 1% final concentration. 560
Tdr samples were treated by the filtration technique (Bell, 1993, ice cold- trichloroacetic 561
acid (TCA) extract) and Leu samples by the centrifuge technique (Smith & Azam, 1992). 562
In both methods, an ethanol rinse was included. Note that bulk bacterial production 563
experiments could not be done at LDA but were done at the short duration station 8 564
instead (hereafter SD8, in the ML, 12m). We occasionally checked that we were working 565
at saturating concentration of Tdr and Leu by testing activities using a range of 566
concentrations of Tdr varying from 5 to 60 nM and of Leu varying from 2 to 45 nM. We 567
confirmed that the Tdr concentration was saturating at all stations and that Leu 568
concentration was saturating at all stations, excepted at SD8 where measured rates were 569
about half the maximum velocities. 570
571
Acknowledgments
572We thank T. Moutin, chief scientist of the OUTPACE cruise, O.R. Anderson, A. Martiny 573
and an anonymous reviewer for their insightful comments to previous versions of this 574
manuscript. We are indebted to O. Grosso and S. Helias-Nunige for nutrient 575
measurements and to G. Rougier and M. Picheral for their help in CTD rosette 576
management and data processing. We are grateful to the crew of the R/V L'Atalante for 577
outstanding shipboard operation. SD was funded by the National Science Foundation 578
(OCE-1434916). MB was funded by the People Program (Marie Skłodowska-Curie 579
Actions) of the European Union's Seventh Framework Program (FP7/2007-2013) under 580
REA grant agreement number 625185. This is a contribution of the OUTPACE project 581
(https://outpace.mio.univ-amu.fr/) funded by the French research national agency (ANR-582
14-CE01-0007-01), the LEFE-CyBER program (CNRS-INSU), the GOPS program 583
(IRD) and the CNES. 584
585
References
586Baer, S.E., Lomas, M.W., Terpis, K.X., Mouginot, C., and Martiny, A.C. (2017) 587
Stoichiometry of Prochlorococcus, Synechococcus, and small eukaryotic 588
populations in the western North Atlantic Ocean. Environmental Microbiology 589
19: 1568-1583.
590
Bell, R.T. (1993) Estimating production of heterotrophic bacterioplankton via 591
incorporation of tritiated thymidine. In: Kemp PF, Sherr, B.F., Sherr, E.B. and 592
Cole, J.J. (ed) Handbook of Methods in Aquatic Microbial Ecology. Lewis 593
Publishers, Boca Raton, FL. 594
Benavides, M., Berthelot, H., Duhamel, S., Raimbault, P., Bonnet, S. (2017) Dissolved 595
organic matter uptake by Trichodesmium in the Southwest Pacific. Sci Rep 596
7:41315. 597
Björkman, K.M., Church, M.J., Doggett, J.K., Karl, D.M. (2015) Differential assimilation 598
of inorganic carbon and leucine by Prochlorococcus in the oligotrophic North 599
Pacific Subtropical Gyre. Front Microbiol 6. 600
Béjà, O., Suzuki, M. (2008) Photoheterotrophic marine prokaryotes. In: DL K (ed) 601
Microbial Ecology of the Oceans John Wiley & Sons, Hoboken, NJ. 602
Chinleo, G., Kirchman, D.L. (1990) Unbalanced growth in natural assemblages of marine 603
bacterioplankton. Mar Ecol Progr Ser 63:1-8. 604
Choi, A.R., Shi, L., Brown, L.S., Jung, K.-H. (2014) Cyanobacterial Light-Driven Proton 605
Pump, Gloeobacter Rhodopsin: Complementarity between Rhodopsin-Based 606
Energy Production and Photosynthesis. PLOS ONE 9:e110643. 607
Church, M.J., Ducklow, H.W., Karl, D.M. (2004) Light dependence of [3H]Leucine 608
incorporation in the oligotrophic North Pacific Ocean. Appl Environ Microbiol 609
70:4079-4087. 610
Claustre, H., Sciandra, A., Vaulot, D. (2008) Introduction to the special section bio-611
optical and biogeochemical conditions in the South East Pacific in late 2004: the 612
BIOSOPE program. Biogeosc 5:679-691. 613
Coe, A., Ghizzoni, J., LeGault, K., Biller, S., Roggensack, S.E., Chisholm, S.W. (2016) 614
Survival of Prochlorococcus in extended darkness. Limnol Oceanogr 61:1375-615
1388. 616
DeLorenzo, M.E., Lewitus, A.J., Scott, G.I., Ross, P.E. (2001) Use of metabolic 617
inhibitors to characterize ecological interactions in an estuarine microbial food 618
web. Microb Ecol 42:317-327. 619
de Verneil, A., Rousselet, L., Doglioli, A. M., Petrenko, A. A., Maes, C., Bouruet-620
Aubertot, P., Moutin, T. (2018) OUTPACE long duration stations: physical 621
variability, context of biogeochemical sampling, and evaluation of sampling 622
strategy, Biogeosciences 15: 2125-2147, doi.org/10.5194/bg-15-2125-2018. 623
Duhamel, S., Björkman, K.M., Doggett, J.K., Karl, D.M. (2014) Microbial response to 624
enhanced phosphorus cycling in the North Pacific Subtropical Gyre. Mar Ecol 625
Progr Ser 504:43-58. 626
Duhamel, S., Björkman, K.M., Karl, D.M. (2012) Light dependence of phosphorus 627
uptake by microorganisms in the North and South Pacific subtropical gyres. 628
Aquat Microb Ecol 67:225-238. 629
Estep, M.F., Hoering, T.C. (1981) Stable hydrogen isotope fractionations during 630
autotrophic and mixotrophic growth of microalgae. Plant Physiol 67:474-477. 631
Evans, C., Gómez-Pereira, P.R., Martin, A.P., Scanlan, D.J., Zubkov, M.V. (2015) 632
Photoheterotrophy of bacterioplankton is ubiquitous in the surface oligotrophic 633
ocean. Progr Oceanogr 135:139-145. 634
Francoeur, S.N., Johnson, A.C., Kuehn, K.A., Neely, R.K. (2007) Evaluation of the 635
efficacy of the photosystem II inhibitor DCMU in periphyton and its effects on 636
nontarget microorganisms and extracellular enzymatic reactions. J North Am 637
Benthol Soc 26:633-641. 638
Gao, H., Xu, X.D. (2012) The Cyanobacterial NAD Kinase Gene sll1415 Is Required for 639
Photoheterotrophic Growth and Cellular Redox Homeostasis in Synechocystis sp 640
Strain PCC 6803. J Bacteriol 194:218-224. 641
Garrigue, C., Clavier, J., Boucher, G. (1992) The use of photosynthesis inhibitor 642
(DCMU) for in situ metabolic and primary production studies on soft bottom 643
benthos. Hydrobiol 246:141-145. 644
Gasol, J.M., Pinhassi, J., Alonso-Sáez, L., Ducklow, H., Herndl, G.J., Koblízek, M., et 645
al., (2008) Towards a better understanding of microbial carbon flux in the sea. 646
Aquat Microb Ecol 53:21-38. 647
Gasol, J.M., Zweifel, U.L., Peters, F., Fuhrman, J.A., Hagstrom, A. (1999) Significance 648
of size and nucleic acid content heterogeneity as measured by flow cytometry in 649
natural planktonic bacteria. Appl Environ Microbiol 65:4475-4483. 650
Gomez-Baena, G., Lopez-Lozano, A., Gil-Martinez, J., Lucena, J.M., Diez, J., Candau, 651
P., et al., (2008) Glucose uptake and its effect on gene expression in 652
Prochlorococcus. Plos One 3. 653
Gomez-Pereira, P.R., Hartmann, M., Grob, C., Tarran, G.A., Martin, A.P., Fuchs, B.M., 654
et al., (2013) Comparable light stimulation of organic nutrient uptake by SAR11 655
and Prochlorococcus in the North Atlantic subtropical gyre. ISME J 7:603-614. 656
Grob, C., Ulloa, O., Claustre, H., Huot, Y., Alarcon, G., Marie, D. (2007) Contribution of 657
picoplankton to the total particulate organic carbon concentration in the eastern 658
South Pacific. Biogeosc 4:837-852. 659
Halsey, K.H., Milligan, A.J., Behrenfeld, M.J. (2014) Contrasting strategies of 660
photosynthetic energy utilization drive lifestyle strategies in ecologically 661
important picoeukaryotes. Metabolites 4:260-280. 662
Hill, P.G., Zubkov, M.V., and Purdie, D.A. (2010) Differential responses of 663
Prochlorococcus and SAR11-dominated bacterioplankton groups to atmospheric 664
dust inputs in the tropical Northeast Atlantic Ocean. FEMS Microbiol Lett 306: 82-665
89. 666
Ikeya, T., Ohki, K., Takahashi, M., Fujita, Y. (1997) Study on phosphate uptake of the 667
marine cyanophyte Synechococcus sp. NIBB 1071 in relation to oligotrophic 668
environments in the open ocean. Mar Biol 129:195-202. 669
Jeanjean, R. (1976) The effect of metabolic poisons on ATP level and on active 670
phosphate uptake in Chlorella pyrenoidosa. Physiol Plant 37:107-110. 671
Jiao, N., Luo, T., Zhang, R., Yan, W., Lin, Y., Johnson, Z.I., et al., (2014) Presence of 672
Prochlorococcus in the aphotic waters of the western Pacific Ocean. Biogeosc 673
11:2391-2400. 674
Johnson, X., Alric, J. (2012) Interaction between starch breakdown, acetate assimilation, 675
and photosynthetic cyclic electron flow in Chlamydomonas reinhardtii. J Biol 676
Chem 287:26445-26452. 677
Johnson, Z.I., Lin, Y. (2009) Prochlorococcus: Approved for export. PNAS 106:10400-678
10401. 679
Karl, D.M. (2007). Microbial oceanography: paradigms, processes and promise. Nat Rev 680
Microbio 5: 759-769. 681
Kirchman, D.L., Hanson, T.E. (2013) Bioenergetics of photoheterotrophic bacteria in the 682
oceans. Env Microbiol Rep 5:188-199. 683
Knoop, H., Gründel, M., Zilliges, Y., Lehmann, R., Hoffmann, S., Lockau, W., et al., 684
(2013) Flux balance analysis of cyanobacterial metabolism: the metabolic 685
network of Synechocystis sp. PCC 6803. PLOS Comp Biol 9:e1003081. 686
Lami, R., Cottrell, M.T., Campbell, B.J., Kirchman, D.L. (2009) Light-dependent growth 687
and proteorhodopsin expression by Flavobacteria and SAR11 in experiments with 688
Delaware coastal waters. Env. Microbiol. 11:3201-3209. 689
Laurent, J., Tambutté, S., Tambutté, É., Allemand, D., Venn, A. (2013) The influence of 690
photosynthesis on host intracellular pH in scleractinian corals. J Exp Biol 691
216:1398-1404. 692
Lewis, M.R., Cullen, J.J., Platt, T. (1984) Relationships between vertical mixing and 693
photoadaptation of phytoplankton: similarity criteria. Mar Ecol Progr Ser 15:141-694
149. 695
Li, W.K.W., Rao, D.V.S., Harrison, W.G., Smith, J.C., Cullen, J.J., Irwin, B., et al., 696
(1983) Autotrophic picoplankton in the tropical ocean. Science 219:292-295. 697
Longnecker, K., Sherr, B.F., Sherr, E.B. (2006) Variation in cell-specific rates of leucine 698
and thymidine incorporation by marine bacteria with high and with low nucleic 699
acid content off the Oregon coast. Aquat Microb Ecol 43:113-125. 700
Mary, I., Garczarek, L., Tarran, G.A., Kolowrat, C., Terry, M.J., Scanlan, D.J., et al., 701
(2008a) Diel rhythmicity in amino acid uptake by Prochlorococcus. Env 702
Microbiol 10:2124-2131. 703
Mary, I., Heywood, J.L., Fuchs, B.M., Amann, R., Tarran, G.A., Burkill, P.H., et al., 704
(2006) SAR11 dominance among metabolically active low nucleic acid 705
bacterioplankton in surface waters along an Atlantic meridional transect. Aquat 706
Microb Ecol 45:107-113. 707
Mary, I., Tarran, G.A., Warwick, P.E., Terry, M.J., Scanlan, D.J., Burkill, P.H., et al., 708
(2008b) Light enhanced amino acid uptake by dominant bacterioplankton groups 709
in surface waters of the Atlantic Ocean. FEMS Microbiol Ecol 63:36-45. 710
Martiny, A.C., Kathuria, S., and Berube, P.M. (2009) Widespread metabolic potential for 711
nitrite and nitrate assimilation among Prochlorococcus ecotypes. PNAS 106: 712
10787-10792. 713
Michelou, V.K., Cottrell, M.T., Kirchman, D.L. (2007) Light-stimulated bacterial 714
production and amino acid assimilation by cyanobacteria and other microbes in 715
the North Atlantic Ocean. Appl Environ Microbiol 73:5539-5546. 716
Moore, L.R. (2013). More mixotrophy in the marine microbial mix. PNAS 110: 8323-717
8324. 718
Moran, M.A., Kujawinski, E.B., Stubbins, A., Fatland, R., Aluwihare, L.I., Buchan, A., et 719
al., (2016) Deciphering ocean carbon in a changing world. PNAS 113:3143-3151. 720
Moran, M.A., Miller, W.L. (2007) Resourceful heterotrophs make the most of light in the 721
coastal ocean. Nat Rev Microbiol 5:792-800. 722
Morán, X.A.G., Alonso-Sáez, L., Nogueira, E., Ducklow, H.W., González, N., López-723
Urrutia, Á., et al., (2015) More, smaller bacteria in response to ocean's warming? 724
Proc R Soc Lond [Biol] 282. 725
Moutin, T., Doglioli, A. M., de Verneil, A., Bonnet, S. (2017) Preface: The Oligotrophy 726
to the UlTra-oligotrophy PACific Experiment (OUTPACE cruise, 18 February to 727
3 April 2015), Biogeosciences 14: 3207-3220. 728
Moutin, T., Wagener, T., Caffin, M., Fumenia, A., Gimenez, A., Baklouti, M., Bouruet-729
Aubertot, P., Pujo-Pay, M., Leblanc, K., Lefevre, D., Helias Nunige, S., Leblond, 730
N., Grosso, O., de Verneil, A (2018) Nutrient availability and the ultimate control 731
of the biological carbon pump in the Western Tropical South Pacific Ocean, 732
Biogeosciences 15: 2961-2989, doi.org/10.5194/bg-15-2961-2018. 733
Muñoz-Marín, M.D., Luque, I., Zubkov, M.V., Hill, P.G., Diez, J., Garcia-Fernandez, 734
J.M. (2013) Prochlorococcus can use the Pro1404 transporter to take up glucose 735
at nanomolar concentrations in the Atlantic Ocean. PNAS 110:8597-8602. 736
Muñoz-Marín, M.D., Gómez-Baena, G., Díez, J., Beynon, R.J., González-Ballester, D., 737
Zubkov, M.V., García-Fernández, J.M. (2017) Glucose Uptake in 738
Prochlorococcus: Diversity of Kinetics and Effects on the Metabolism. Front 739
Microbiol 8. 740
Mühlbauer, S.K., Eichacker, L.A. (1998) Light-dependent formation of the 741
photosynthetic proton gradient regulates translation elongation in chloroplasts. J 742
Biol Chem 273:20935-20940. 743
Neilson, A.H., Lewin, R.A. (1974) The uptake and utilization of organic carbon by algae: 744
an essay in comparative biochemistry. Phycol 13:227-264. 745
Oren, A., Abu-Ghosh, S., Argov, T., Kara-Ivanov, E., Shitrit, D., Volpert, A., et al., 746
(2016) Expression and functioning of retinal-based proton pumps in a saltern 747
crystallizer brine. Extremophiles 20:69-77. 748
Paerl, H.W. (1991) Ecophysiological and trophic implications of light-stimulated amino 749
acid utilization in marine picoplankton. Appl Environ Microbiol 57:473-479. 750
Paoli, A., Celussi, M., Del Negro, P., Umani, S.F., Talarico, L. (2008) Ecological 751
advantages from light adaptation and heterotrophic-like behavior in 752
Synechococcus harvested from the Gulf of Trieste (Northern Adriatic Sea). FEMS 753
Microbiol Ecol 64:219-229. 754
Partensky, F., Garczarek, L. (2010) Prochlorococcus: advantages and limits of 755
minimalism. Ann Rev Mar Sci 2:305-331. 756
Pinhassi, J., DeLong, E.F., Béjà, O., González, J.M., Pedrós-Alió, C. (2016) Marine 757
bacterial and archaeal ion-pumping rhodopsins: genetic diversity, physiology, and 758
ecology. Microbiol Mol Biol Rev 80:929-954. 759
Pollard, P.C., Moriarty, D.J. (1984) Validity of the tritiated thymidine method for 760
estimating bacterial growth rates: measurement of isotope dilution during DNA 761
synthesis. App Env Microbiol 48:1076-1083. 762
Richardson, T.L., Jackson, G.A. (2007) Small phytoplankton and carbon export from the 763
surface ocean. Science 315:838-840. 764
Riddell, A., Gardner, R., Perez-Gonzalez, A., Lopes, T., Martinez, L. (2015). Rmax: A 765
systematic approach to evaluate instrument sort performance using center stream 766
catch. Methods 82: 64-73. 767
Riemann, B., Bell, R.T. (1990) Advances in estimating bacterial production and growth 768
in aquatic systems. Arch Hydrobiol 118:385-402. 769
Rippka, R. (1972) Photoheterotrophy and chemoheterotrophy among unicellular blue-770
green algae. Arch Mikrobiol 87:93-98. 771
Ruiz-Gonzalez, C., Gali, M., Lefort, T., Cardelus, C., Simo, R., Gasol, J.M. (2012a) 772
Annual variability in light modulation of bacterial heterotrophic activity in surface 773
northwestern Mediterranean waters. Limnol Oceanogr 57:1376-1388. 774
Ruiz-Gonzalez, C., Simo, R., Sommaruga, R., Gasol, J.M. (2013) Away from darkness: a 775
review on the effects of solar radiation on heterotrophic bacterioplankton activity. 776
Front Microbiol 4. 777
Ruiz-Gonzalez, C., Simo, R., Vila-Costa, M., Sommaruga, R., Gasol, J.M .(2012b) 778
Sunlight modulates the relative importance of heterotrophic bacteria and 779
picophytoplankton in DMSP-sulphur uptake. ISME J.= 6:650-659. 780
Smith, D.C., Azam, F. (1992) A simple, economical method for measuring bacterial 781
protein synthesis rates in seawater using 3H-leucine. Mar Microb Food Webs 782
6:107-114. 783
Stanier, R.Y. (1973) Autotrophy and heterotrophy in unicellular blue-green algae. In: 784
N.G. Carr BAWE (ed) Biology of Blue-Green Algae. Blackwell, Oxford. 785
Talarmin, A., Van Wambeke, F., Catala, P., Courties, C., Lebaron, P. (2011a) Flow 786
cytometric assessment of specific leucine incorporation in the open 787
Mediterranean. Biogeosciences 8:253-265. 788
Talarmin, A., Van Wambeke, F., Duhamel, S., Catala, P., Moutin, T., Lebaron, P. 789
(2011b) Improved methodology to measure taxon-specific phosphate uptake in 790
live and unfiltered samples. Limnol Oceanogr Methods 9:443-453. 791
Vandermeulen, J.H., Davis, N.D., Muscatine, L. (1972) The effect of inhibitors of 792
photosynthesis on zooxanthellae in corals and other marine invertebrates. Mar 793
Biol 16:185-191. 794
Viviani, D.A., Karl, D.M., Church, M.J. (2015) Variability in photosynthetic production 795
of dissolved and particulate organic carbon in the North Pacific Subtropical Gyre. 796
Front Mar Sc 2. 797
Waterbury, J.B., Watson, S.W., Valois, F.W., Franks, D.G. (1986) Biological and 798
ecological characterization of the marine unicellular cyanobacterium 799
synechococcus. Can J Fish Aquat Sci 214:71-120. 800
West, N.J., Lepere, C., Manes, C.L.D., Catala, P., Scanlan, D.J., Lebaron, P. (2016) 801
Distinct spatial patterns of SAR11, SAR86, and Actinobacteria diversity along a 802
transect in the ultra-oligotrophic south Pacific Ocean. Front Microbiol 7:234 doi: 803
10.3389/fmicb.2016.00234. 804
Wright, R.R., Hobbie, J.E. (1966) Use of glucose and acetate by bacteria and algae in 805
aquatic ecosystems. Ecol 47:447-464. 806
Yelton, A.P., Acinas, S.G., Sunagawa, S., Bork, P., Pedros-Alio, C., Chisholm, S.W. 807
(2016) Global genetic capacity for mixotrophy in marine picocyanobacteria. 808
ISME J 10:2946-2957. 809
You, L., He, L., Tang, Y.J. (2015) Photoheterotrophic fluxome in Synechocystis sp. strain 810
PCC 6803 and its implications for cyanobacterial bioenergetics. J Bacteriol 811
197:943-950 812
Zubkov, M.V. (2009) Photoheterotrophy in marine prokaryotes. J Plankton Res31:933-813
938 814
Zubkov, M.V., Fuchs, B.M., Tarran, G.A., Burkill, P.H., and Amann, R. (2003) High rate 815
of uptake of organic nitrogen compounds by Prochlorococcus cyanobacteria as a 816
key to their dominance in oligotrophic oceanic waters. Applied and 817
Environmental Microbiology 69: 1299-1304. 818
Zubkov, M.V., Tarran, G.A. (2005) Amino acid uptake of Prochlorococcus spp. in 819
surface waters across the South Atlantic Subtropical Front. Aquat.Microb Ecol 820
40:241-249 821
Zubkov, M.V., Martin, A.P., Hartmann, M., Grob, C., and Scanlan, D.J. (2015) Dominant 822
oceanic bacteria secure phosphate using a large extracellular buffer. 6: 7878. 823
824 825
Table and Figure Legends:
826Table 1. Ancillary data Characteristics of the seawater samples collected at stations LDA, LDB and LDC used in experiments. 827
Latitude (Lat.), longitude (Long.), fraction of surface photosynthetically active radiation (PAR, %) received at the corresponding 828
depth (m), temperature (T, C), Prochlorococcus (Pro), Synechococcus (Syn), and LNA cell abundances (103
cell ml–1), phosphate and 829
nitrate concentrations (PO4 3−
and NO3 −
nmol l–1), and ambient concentrations of glucose (Glc), leucine (Leu) and ATP (nmol l–1). 830 831 832 833 834 835 836 837
Fig. 1: Cell specific (a, c, e, amol cell−1 h−1) and group specific (b, d, f, pmol l−1 h−1) 838
assimilation rates of glucose (a, b), leucine (c, d) and ATP (e, f) by Prochlorococcus 839
(Pro, black bars), Synechococcus (Syn, white bars) and LNA bacteria (LNA, grey bars) in 840
incubations in the light. Error bars represent standard deviation on triplicate samples. * 841
indicate non-measurable rates (killed control corrected rates ≤ killed control). 842
843
844 845