HAL Id: hal-02279199
https://hal.archives-ouvertes.fr/hal-02279199
Submitted on 5 Sep 2019
HAL is a multi-disciplinary open access
archive for the deposit and dissemination of
sci-entific research documents, whether they are
pub-lished or not. The documents may come from
teaching and research institutions in France or
abroad, or from public or private research centers.
L’archive ouverte pluridisciplinaire HAL, est
destinée au dépôt et à la diffusion de documents
scientifiques de niveau recherche, publiés ou non,
émanant des établissements d’enseignement et de
recherche français ou étrangers, des laboratoires
publics ou privés.
Solid state fermentation pilot-scaled plug flow
bioreactor, using partial least square regression to
predict the residence time in a semicontinuous process
Quentin Carboué, Catherine Rébufa, Nathalie Dupuy, Sevastianos Roussos,
Isabelle Bombarda
To cite this version:
Quentin Carboué, Catherine Rébufa, Nathalie Dupuy, Sevastianos Roussos, Isabelle Bombarda. Solid
state fermentation pilot-scaled plug flow bioreactor, using partial least square regression to predict
the residence time in a semicontinuous process. Biochemical Engineering Journal, Elsevier, 2019, 149,
pp.107248. �10.1016/j.bej.2019.107248�. �hal-02279199�
Contents lists available atScienceDirect
Biochemical Engineering Journal
journal homepage:www.elsevier.com/locate/bej
Solid state fermentation pilot-scaled plug
flow bioreactor, using partial least
square regression to predict the residence time in a semicontinuous process
Quentin Carboué
a,b,⁎, Catherine Rébufa
b, Nathalie Dupuy
b, Sevastianos Roussos
b,
Isabelle Bombarda
baVinovalie, ZA les portes du Tarn, 81370, Saint-Sulpice-la-Pointe, France bAix Marseille Univ, Avignon Université, CNRS, IRD, IMBE, Marseille, France
H I G H L I G H T S
•
Semicontinuous production of fungal compounds was obtained with a Plug Flow Bioreactor (PFB) prototype.•
Productions of same metabolites obtained over time at lab scale were used to build a Partial Least Square (PLS) model.•
A residence time of solid particles was associated to each PFB compartment using the PLS model.•
The PFB prototype was suitable to continuously produce fungal secondary metabolites.•
PLS was an innovative approach to evaluate the scale-up of the metabolite production. A R T I C L E I N F OKeywords: Plugflow bioreactor Solid state fermentation Partial least square regression Residence time
Aspergillus niger
A B S T R A C T
Plugflow bioreactor (PFB) used in solid state fermentation gives the possibility to have semicontinuous culture. However, it is complicated to follow a single particle during its residence inside the bioreactor and to therefore study precisely the culture process all along the device. In this study, semicontinuous production of fungal compounds was successfully obtained by cultivating Aspergillus niger with a PFB prototype. Kinetic productions of the same metabolites along the bioreactor were obtained at laboratory scale to predict the residence time of the particles inside the PFB from Partial Least Square (PLS). This original methodology allowed (1) the com-parison between the production kinetics at the two production scales (pilot and laboratory) and (2) the ob-servation of eventual changes following the scale-up of the process offering a good overall insight of the PFB performance.
1. Introduction
Solid state fermentation (SSF) is a microbial culture on wet solid material under controlled conditions in absence of free running water [1]. For numerous biotechnological compounds produced at laboratory scale, SSF proved to be preferable to the liquid state fermentation. SSF advantages include lower processing cost, less energy requirements, production of solid waste, enhanced productivity, improvement of product stability and lower catabolic repression [2,3]. Particularly in the case offilamentous fungi, SSF recreates the natural habitat of mi-croorganisms and is therefore the preferred choice for their growth and production of useful compounds with added value, especially on an optimized medium [4,5].
So far, liquid fermentations are still largely privileged at industrial
scale. Yet, as in every aerobic process, the fungal growth is accom-panied by the release of heat, CO2, and volatile compounds due to re-spiratory activities. As the production scale increases, those metabolic products are by consequence proportionally produced and may accu-mulate during the course of fermentation because of the heterogeneous nature, the intrinsic low effective thermal conductivity, and the po-tential compaction effects of the solid porous medium [6,7]. The low-quality mass and energy transfers cause a decrease in the subsequent removal of heat and CO2from the bioreactor bed: this can inhibit the microorganism growth and affect the production of metabolites [6,8,9]. The ineffective removal of the generated products is obviously amplified in static systems whereas medium agitation is one possible strategy to optimize mass and heat transfers [10,11]. If the cultivated microorganism tolerates agitation, agitated bioreactors can thus be
https://doi.org/10.1016/j.bej.2019.107248
Received 14 February 2019; Received in revised form 21 May 2019; Accepted 27 May 2019
⁎Corresponding author at: Vinovalie, ZA les portes du Tarn, 81370, Saint-Sulpice-la-Pointe, France.
E-mail address:[email protected](Q. Carboué).
Available online 28 May 2019
1369-703X/ © 2019 Elsevier B.V. All rights reserved.
used to overcome the scale-up challenge in SSF. Agitated bioreactors are also used to achieve continuous SSF to bypass productivity draw-backs linked to traditional batch culture [12]. In a true continuous fermentation system, substrate is constantly provided to the reaction vessel, while a correspondingflow of fermented material is discharged to keep volume of the reactor medium constant. Furthermore, the balance between feed and discharge is maintained for long enough time to achieve steady state operation without any changes in the conditions within the reactor [13]. Two types of bioreactor are used in continuous SSF: continuous stirred tank bioreactor (CSTB) and the plug flow bioreactor (PFB) [14,15]. Due to perfect mixing, the CSTB ideal model specifies that the composition of the bed is homogenous and identical to the outgoing flow leading to a very heterogeneous residence time among the solid particles. Conversely, the PFB ideal model indicates no axial dispersion and a perfect mixing in the radial dimension so the solid particles move inside the bioreactor with uniform kinetic profiles thus sharing the same residence time [16]. In this case, under steady state, the product concentration at any single point along the PFB is constant. Overall, a stable concentration profile is obtained, with the concentration varying in space as the production occurs along theflow path [17]. Position becomes thus the equivalent of a time marker in a batch-operated process [18]. In practice, neither of these ideal models can be considered fully accurate and the measurement of residence time distribution (RTD) of the outflowing solid medium in a non-ideal PFB gives a sense of the axial dispersion existing along the bioreactor. With continuous process, it is also difficult to follow a single particle inside the bioreactor, though some models exist [19]. In order to optimize the bioprocess, it is therefore necessary to use models to approximate the residence time of the solid particles all along the bioreactor. In addition, this temporal modeling is an important prerequisite to further mathe-matical modelling classically used to describe the impact of operating variables on the bioreactor performances. For example, both macro-scale bioreactor models such as balance/transport sub-model – de-scribing mass and heat transfer within and between the various phases of the bioreactor – and the kinetic sub-model – describing how the growth rate of the microorganism depends on the key local environ-mental variables– include time in their equations [20]. However, ap-proximating the time studying growth kinetics may be tedious since many parameters have to be measured [21].
In our study, an original approach was proposed to predict temporal gradient along a prototype PFB. From kinetic data of production of various fungal compounds obtained by cultivating Aspergillus niger at laboratory scale, a Partial Least Square (PLS) regression was built to predict a residence time associated to different points along the PFB working under steady state using the concentrations of these same compounds found inside the bioreactor. However, since the PFB was intermittently fed and agitated, the process is considered semicontin-uous rather than truly continsemicontin-uous. Commonly, spectroscopic data were recorded for one-line monitoring of various fermentation processes to implement PLS models to predict physical and chemical process para-meters [22].
Here, a multivariate analysis not only allowed to predict the me-tabolites concentration over time in controlled laboratory conditions but it also permitted to compare the metabolites production between the laboratory and the pilot scales and see the eventual changes fol-lowing the scale-up of the process.
2. Materials and methods
2.1. Fungal strain and cultivation conditions
Aspergillus niger G131 was provided by École Nationale Supérieure Agronomique de Toulouse (France). The fungal strain was conserved at 4 °C in a 5 ml bottle on potato dextrose agar (PDA). The inoculum stock was prepared by propagating the fungus in Erlenmeyer flasks con-taining PDA. The cultures were incubated at 25 °C for 5–10 days. The
inoculum suspension was prepared by adding 0.01% (v/v) Tween 80 and scraping with a magnetic stirrer to recover the conidia. The quantity of conidia was counted using a Malassez cell prior to in-oculation of the solid medium.
2.2. SSF
Fermentations were carried out on previously autoclaved solid medium composed by 50% vine shoots and 50% wheat bran (w/w) at 25 °C and the moisture content was set at 60%. Each sample collection was performed in duplicate. The monitored variables were secondary metabolites belonging to the naphtho-gamma-pyrones (NγPs) family: fonsecin, ustilaginoidin A, unidentified NγPs mix, fonsecin B, some other fungal metabolites: nigragilin, aspernigrin A, some degradation products such asβ-D-glucose, p-coumaric acid, trans-ethyl ferulate and the conidias.
Laboratory scale: fungal cultures were done in triplicate in Erlenmeyerflasks of 250 mL on 5 g (dry matter) occupying nearly 40% of the volume, humidified at 60%, inoculated with 2.107conidia g−1 (dry matter) and during 9 days in an incubator at 25 °C. One triplicate was removed each day, as samples.
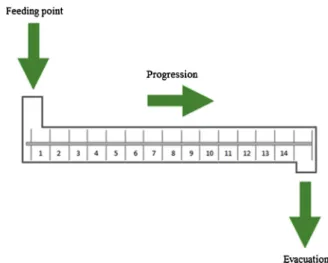
Pilot scale: the PFB used was a bioreactor prototype built by Vinovalie company (France) that consists in 3.50 m long and 50 cm diameter containing a stainless steel feeder screw. The screw has 14 threads, each one delimiting a compartment that can befilled with solid material (Fig. 1). These compartments only serve to delimit the various locations along the bioreactor, they communicate with each other as some solid particles are exchanged between two of them placed nearby during the rotation of the screw. The whole system has a total capacity of 5 kg (dry matter) and was fed every 24 h with 300 g (dry matter) of solid medium. This alimentation compensated the fermented material that exited the PFB in order to attain a mass balance inside the bior-eactor. The rotation speed of the screw was set at 6 rpm. 20 g of fer-mented materiel was added each time the bioreactor was fed. The bioreactor was cleaned with an ethanolic solution to reach partial as-ceptic conditions and autoclaved medium was introduced using a Bunsen burner to avoid contamination inlet during the feeding step. The bioreactor was operated during 3 weeks. The evaluation of the steady state of the bioreactor is made by comparison of the outflowing fermented material total NγPs productions each week – samples were carried out in triplicate – during the semicontinuous process. Tem-perature was monitored using a meat thermometer and water content was measured directly on harvested samples. Sample collection was performed every day recovering the fermented material evacuated from the bioreactor. Under steady state samples were collected in duplicate
Fig. 1. Photo of the bioreactor with the detail of the threads and its schematic representation.
Q. Carboué, et al. Biochemical Engineering Journal 149 (2019) 107248
Fig. 2. Behavior of the solid particles inside the bioreactor during time.
A: the percentage of recovered tracer during its residence time inside de bioreactor; B: the residence time distribution function E(t) plotted with the residence time, its integration gives the fraction of the leaving solid material that has resided in it for a given interval of time (for example, in the present case, between 5 and 7 days, 50% of the solid material leaves the bioreactor); C: the function tE(t) plotted with the residence time, its integration between 0 and +∞ gives the mean residence time tm.
Fig. 3. Comparison of the total NγPs production during the process. Error bars represent the variability associated with the measurements of tri-plicate samples of the outflowing material every week. A t-test shows no sig-nificant difference between the total NγPs production values (α = 5%).
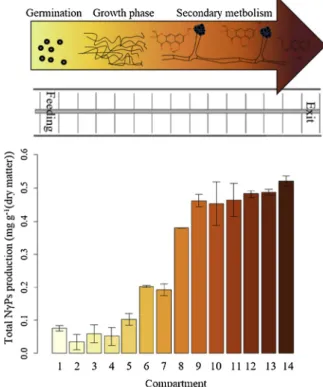
Fig. 4. Total NγPs production along the PFB working at a steady state at 25 °C and 60% humidity.
Error bars represent the variability associated with the measurements of du-plicate samples inside each compartment.
inside each compartment along the PFB. 2.3. Residence time distribution (RTD)
The rotation of the screw allows the moving of the fermented ma-terial inside the PFB, the selected pattern in this study was 25 s rotation in forward direction and 15 s rotation in backward direction, corre-sponding to a cycle of agitation. A value of 7 days residence time of the solid particles was established by programming stationary periods during 8700 s between each rotation episode of the screw. The process is therefore an intermittently agitated culture. The determination of the RTD and the mean residence time were performed by filling the first compartment with bagasse wetted with a red-colored solution con-taining 1 g L−1of erythrosin B (Sigma-Aldrich, USA) and measuring the concentration of red dye in the outflowing material: 1 g of recovered solid medium is extracted in 10 mL of ethanol and then centrifugated at 5000 rpm. The optical density of the obtained extract is measured at 530 nm using a spectrophotometer UVmini-1240 (Shimadzu, Japan). This corresponds to a pulse injection of a colored tracer inside the bioreactor.
In this case, the RTD function is defined as following:
∫
= ∞ E t P t P t dt ( ) ( ) ( ) 0 (1)The mean residence time is:
∫
= ∞tE t dt
tm ( )
0 (2)
The variance, which corresponds to the second moment of the RTD function:
∫
= ∞t E t dt−
σ2 ² ( ) tm2
0 (3)
The variance can also be expressed as:
= − ⎛ ⎝ ⎞ ⎠ − − Pe Pe e σ2 2 2 1 ²(1 Pe) (4) Solving Eq.(4)gives the Péclet number Pe.where P(t) is the per-centage of recovered red-colored tracer, E(t) is the RTD function, tmis the mean residence time, Pe the Péclet number and t the residence time. 2.4. Water content
The results were expressed in dry weight. To determine the dry weight of a sample, 1 g of moist fermented material was put in an oven at 105 °C during 24 h and was reweighted to measure the percentage of lost water.
2.5. Secondary metabolites extraction and measurement
The secondary metabolites produced by the fungus were extracted using 1 g of moist fermented material taken from each sample with 10 mL of analytical ethanol (Sigma-Aldrich, USA). The mixture was stirred during 1 h. The obtained crude extract was then filtered with 0.2μm filter prior to high performance liquid chromatography (HPLC) analysis. The HPLC system (Agilent Technologies, USA) was equipped with a diode array detector (DAD), a RP18 analytical column (150 × 5 mm, 4.6μm particle size, Zorbax Eclipse XDB, Agilent Technologies), fitted to a RP18 guard column (10 × 4 mm, Agilent Technologies, USA) and kept at 30 °C during the analysis. The crude extracts (40μL) were injected using an auto-sampler. The mobile phase consisted of acidified water (0.2% glacial acetic acid) (A) and analytical acetonitrile (B) (Sigma-Aldrich, USA). The linear gradient started from 30% to 100% of B during 45 min, then 100% B for 5 min at aflow rate of 1 mL.min−1. The metabolites were monitored at 280 nm and the subsequent peaks were observed using ChemStation B.02.01 (Agilent
Technologies, USA). The secondary metabolites investigated being mostly NγPs, the concentrations were determined using the commercial standard rubrofusarin A (> 98% purity, Bioviotica Naturstoffe GmbH, Germany). The results were expressed in mg equivalent rubrofusarin g−1dry matter based on the calibration curve obtained from the ana-lysis of standard solutions ranging from 2 to 200 mg L−1.
2.6. Conidia counting
1 g of each sample was collected, introduced in distilled water with Tween 80 (Sigma-Aldrich, USA) 0.01% (v/v) and stirred for 5 min. After appropriate dilution, the conidia were counted using a hemocyt-ometer.
2.7. Partial least square (PLS) regression
PLS is a supervised analysis based on the relation between the multivariable data and the characteristics of the sample multi-component analysis such as time in kinetics. The algorithm is based on the ability to mathematically correlate multivariable data to a property matrix of interest while simultaneously accounting for all other sig-nificant factors influences the data. To construct a model, the first step is to perform a calibration. This involves collecting a calibration set of reference samples which should contain all chemical and physical variations to be expected in the unknown samples, which will be pre-dicted later. The purpose of this calibration is to establish a multiple linear regression between multivariable data and the kinetic evolution. Cross-validation was applied in regression tofix the required number of latent variables for model construction. So, the optimal number of la-tent variables is determined on the basis of prediction of samples kept out from the individual model. The second step is to validate the model using a prediction set (different from the calibration one), i.e. to com-pare the values obtained by the model to the values obtained by the reference method.
The evaluation of the calibration performance is estimated by computing the standard error of calibration (RMSEC) after comparing the real modification with the computed one for each component. The formula for the standard error of calibration is:
= ∑ − − = RMSEC C N p ( – C ) 1 i N i 1 i' 2 (5) where Ci is the known value, C’i is the calculated value, N the number of samples and p is the number of independent variables in the
Table 1
PLS results for the prediction of residence time from lab scale experiments.
Compounds production* Time (days)
Min Max Min Max Conidia 1.10 × 10⁷ 3.28 × 10⁹ 1 9 p-coumaric acid 0.00 0.20 1 9 Trans-ethyl ferulate 0.00 0.43 1 9 Unidentified NγPs mix 0.00 0.12 1 9 Fonsecin B 0.00 0.12 1 9 β-D-glucose 0.38 0.96 1 9 Nigragilin 0.08 0.57 1 9 Aspernigrin A 0.07 0.31 1 9 PLS parameters Calibration Nb R2 SEC LV 14 0.99 0.31 3 Validation Nb R2 SEP LV 7 0.97 0.52 3
* Conidia production expressed in conidia g−1(dry matter) and the other compounds production expressed in mg equivalent rubrofusarin g−1(dry matter).
Q. Carboué, et al. Biochemical Engineering Journal 149 (2019) 107248
regression.
The standard error of prediction (RMSEP) gives an estimation of the prediction performance during the step of validation of the calibration equation: = ∑= RMSEP C M ( – C ) i M i 1 ' 2i (6) where Ciis the known value, C’iis the value calculated by the cali-bration equation, and M is the number of samples in the prediction set. The predictive ability of the model should also be expressed by the square of correlation coefficient (R²) also called determination coeffi-cient, usually called Q² in prediction. The regression coefficients are the numerical coefficients, which express the link between the predictor variations and the response variations.
In this work, PLS regression has been used to build a linear model able to predict the fermentation time associated to each compartment of the PFB working at its steady state. The model has been built using dataset of productions of secondary metabolites and conidia produced inflasks under similar temperature and humidity conditions than those observed at the pilot scale, thus 25 °C and 60% of humidity. The sec-ondary metabolites retained were p-coumaric acid, trans-ethyl ferulate, fonsecin B,β-D-glucose, nigragilin and aspernigrin A. This dataset has been divided in two parts: 2/3 of the data– 14 samples – were used for the calibration model and the remaining 1/3–7 samples – were used for the validation step: the predicted time values were compared with the experimental observations (reference values). The explained data (metabolites concentrations) have been centered, reduced and divided with the standard deviation for the model construction to avoid giving importance to high metabolites concentrations.
2.8. Production scales comparison
The various compound productions measured from the PFB were plotted using the residence time values associated to the compartments they were sampled from – predicted by the PLS model – and were
compared to the production kinetics obtained at the laboratory scale. 2.9. Statistical analysis
Curves and analysis were carried out using R. 3. Results and discussion
3.1. PFB characterization
The aim of the use of a PFB was to semicontinuously produce fer-mented material that shared the same properties at each recovery episode at the end of the process. Being a biological process, the time is a parameter of major importance and before inoculation it is essential to set a mean residence time for the solid particles inside the apparatus. The measurement of red dye outflowing showed the look of the dis-persion of the solid particles when the screw inside the PFB was oper-ated with 25 s rotation forward and 15 s rotation backward. The results indicate a mixing during the agitation events: some solid particles moved from their compartment to the following next or previous ones when the screw rotated. The integration of the outflowing red-colored tracer percentage during residence time function allows to determine the RTD function, itself allowing the determination of the mean re-sidence time tm= 7.12 days for the solid particles inside the bioreactor (Fig. 2). The existence of an axial dispersion obviously places the bioreactor in a non-ideal PFB category, which itself can be considered as various ideal CSTB placed in series [23]. Eq.(3)gives a value of varianceσ² equal to 0.09 day² and the solving of Eq.(4)gives a Péclet number Pe equal to 2.19. This value of Pe is closer to the one of an ideal CSTB (Pe = 0) than one of an ideal PFB (Pe > 100).
As the production scale increases, contamination becomes a major issue in SSF, especially in continuous processes [24]. In the present case, adding inoculum to the sterilized medium during the feeding step not only allowed inoculation but also decreased the contamination risk. Indeed, because the process was performed in no complete asepsis, the
Table 2
Conidia production and metabolites concentration in PFB*.
Compartment Conidia p-coumaric acid trans-ethyl ferulate Unidentified NγPs mix Fonsecin B β-D-glucose Nigragilin Aspernigrin A 1 3.47 × 10⁷ 1.74 × 10⁻² 2.60 × 10⁻² 0.00 0.00 2.49 × 10⁻¹ 1.19 × 10⁻¹ 1.21 × 10⁻¹ 1 3.64 × 10⁷ 0.00 2.60 × 10⁻² 0.00 0.00 2.16 × 10⁻¹ 8.87 × 10⁻² 5.08 × 10⁻² 2 9.37 × 10⁷ 0.00 0.00 0.00 0.00 2.29 × 10⁻¹ 9.24 × 10⁻² 6.08 × 10⁻¹ 2 8.84 × 10⁷ 0.00 0.00 0.00 0.00 2.36 × 10⁻¹ 7.89 × 10⁻² 6.79 × 10⁻² 3 1.28 × 10⁷ 8.85 × 10⁻³ 0.00 0.00 0.00 2.67 × 10⁻¹ 1.04 × 10⁻¹ 6.77 × 10⁻² 3 9.73 × 10⁷ 1.09 × 10⁻² 4.53 × 10⁻² 0.00 0.00 2.87 × 10⁻¹ 1.19 × 10⁻¹ 6.77 × 10⁻² 4 7.85 × 10⁷ 1.02 × 10⁻² 3.94 × 10⁻² 0.00 0.00 3.32 × 10⁻¹ 1.13 × 10⁻¹ 7.36 × 10⁻² 4 9.46 × 10⁷ 1.00 × 10⁻² 4.56 × 10⁻² 0.00 0.00 2.91 × 10⁻¹ 8.25 × 10⁻² 6.36 × 10⁻² 5 4.57 × 10⁸ 1.50 × 10⁻² 4.85 × 10⁻² 0.00 0.00 3.69 × 10⁻¹ 1.42 × 10⁻¹ 7.19 × 10⁻² 5 3.86 × 10⁸ 1.00 × 10⁻² 3.98 × 10⁻² 0.00 0.00 3.88 × 10⁻¹ 1.32 × 10⁻¹ 9.19 × 10⁻² 6 1.08 × 10⁹ 5.16 × 10⁻² 6.85 × 10⁻² 0.00 0.00 4.02 × 10⁻¹ 1.33 × 10⁻¹ 8.98 × 10⁻² 6 7.32 × 10⁸ 4.06 × 10⁻² 5.65 × 10⁻² 0.00 0.00 3.95 × 10⁻¹ 1.43 × 10⁻¹ 8.98 × 10⁻² 7 4.56 × 10⁸ 7.54 × 10⁻² 6.75 × 10⁻² 0.00 0.00 3.80 × 10⁻¹ 1.65 × 10⁻¹ 8.21 × 10⁻² 7 4.56 × 10⁸ 0.00 6.07 × 10⁻² 0.00 0.00 3.87 × 10⁻¹ 1.48 × 10⁻¹ 9.21 × 10⁻² 8 1.34 × 10⁹ 1.12 × 10⁻¹ 6.98 × 10⁻² 2.55 × 10⁻² 2.56 × 10⁻² 4.58 × 10⁻¹ 2.44 × 10⁻¹ 1.06 × 10⁻¹ 8 1.28 × 10⁹ 9.82 × 10⁻² 7.36 × 10⁻² 3.55 × 10⁻² 1.96 × 10⁻² 6.15 × 10⁻¹ 2.74 × 10⁻¹ 1.18 × 10⁻¹ 9 1.87 × 10⁹ 1.00 × 10⁻¹ 1.03 × 10⁻¹ 3.15 × 10⁻² 3.55 × 10⁻² 4.99 × 10⁻¹ 2.96 × 10⁻¹ 9.75 × 10⁻² 9 1.72 × 10⁹ 8.92 × 10⁻² 9.64 × 10⁻² 4.75 × 10⁻² 4.00 × 10⁻² 5.87 × 10⁻¹ 3.37 × 10⁻¹ 1.08 × 10⁻¹ 10 2.12 × 10⁹ 1.05 × 10⁻¹ 1.13 × 10⁻² 3.52 × 10⁻² 3.63 × 10⁻² 5.57 × 10⁻¹ 3.48 × 10⁻¹ 1.12 × 10⁻¹ 10 2.19 × 10⁹ 9.00 × 10⁻² 8.94 × 10⁻² 4.46 × 10⁻² 4.00 × 10⁻² 5.26 × 10⁻¹ 3.38 × 10⁻¹ 8.18 × 10⁻² 11 3.08 × 10⁹ 1.15 × 10⁻¹ 7.25 × 10⁻² 3.95 × 10⁻² 3.95 × 10⁻² 5.02 × 10⁻¹ 4.08 × 10⁻¹ 1.21 × 10⁻¹ 11 2.79 × 10⁹ 9.31 × 10⁻² 9.83 × 10⁻² 4.78 × 10⁻² 4.20 × 10⁻² 4.08 × 10⁻¹ 3.98 × 10⁻¹ 1.22 × 10⁻¹ Conidia production and metabolites concentration in PFB*
Compartment Conidia p-coumaric acid trans-ethyl ferulate Unidentified NγPs mix Fonsecin B β-D-glucose Nigragilin Aspernigrin A 12 3.26 × 10⁹ 1.08 × 10⁻¹ 1.05 × 10⁻¹ 4.75 × 10⁻² 4.10 × 10⁻² 6.40 × 10⁻¹ 3.57 × 10⁻¹ 1.68 × 10⁻¹ 13 3.20 × 10⁹ 1.05 × 10⁻¹ 8.55 × 10⁻² 4.35 × 10⁻² 4.56 × 10⁻² 5.86 × 10⁻¹ 3.41 × 10⁻¹ 1.46 × 10⁻¹ 13 2.98 × 10⁹ 9.80 × 10⁻² 9.68 × 10⁻² 4.90 × 10⁻² 4.80 × 10⁻² 6.16 × 10⁻¹ 2.91 × 10⁻¹ 1.62 × 10⁻¹ 14 3.03 × 10⁹ 1.10 × 10⁻¹ 9.12 × 10⁻² 4.49 × 10⁻² 4.25 × 10⁻² 6.41 × 10⁻¹ 3.85 × 10⁻¹ 2.04 × 10⁻¹ 14 3.09 × 10⁹ 1.08 × 10⁻¹ 1.16 × 10⁻¹ 4.97 × 10⁻² 4.20 × 10⁻² 5.56 × 10⁻¹ 2.25 × 10⁻¹ 1.86 × 10⁻¹
newly introduced sterile medium had to be colonized quickly by A. niger. The semicontinuous process was performed during 3 weeks. During this period, no significant variation related to the temperature nor the water content of the outflowing material was observed (data not shown). The comparison of the measurements of the total NγPs pro-duction carried out each week– corresponding to an interval of time equal to the mean residence time – during this period revealed no significant difference in terms of composition of the fermented material at the end of the process (Fig. 3).
This result allowed us to consider the bioreactor to be operating under steady state because, despite a RTD, the exiting product has a uniform composition [24].
To ensure a good optimization of PFB, a monitoring of NγPs and related compounds was done for each 14 compartments. The evolution of total NγPs concentration showed that the production reached a plateau (Fig. 4) which was characteristic of the stationary phase of the growth associated with secondary metabolism [25]. The total NγPs
concentration was low in thefirst compartments because the produc-tion was preceded by the conidial germinaproduc-tion of the inoculum and the growth phase [26]. These results confirmed that the chosen settings of
the movement of the screw were therefore suitable for the fungal duction although the plateau shape implies that an equivalent pro-ductivity could have been obtained with a shorter bioreactor. Indeed, a mean residence time of 7 days allows the microorganism to produce secondary metabolites until a maximum value, and the fact that those compounds are not degraded posteriorly suggests that the RTD– and
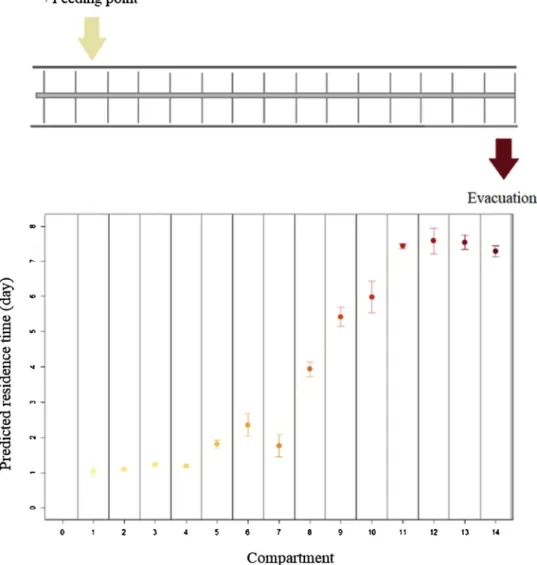
Fig. 5. Temporal gradient along the PFB associated to the different compartments.
Fig. 6. Comparison of conidia production kinetics under lab and pilot scales. Conidia production is expressed in number of conidia by g of dry matter, time is expressed in days. Time values used for the pilot scale correspond to predicted residence time obtained with the PLS model. Error bars represent the variability associated with the measurements of triplicate samples inside each compart-ment.
Q. Carboué, et al. Biochemical Engineering Journal 149 (2019) 107248
thus the presence of older solid particles – is not detrimental for the process as the secondary metabolites concentration remains stable.
The total NγPs concentration in the different compartments when the PFB has reached a steady state seemed to validate that the fungus was able to perform its lifecycle. However, a comparison of the pro-duction kinetic curves for the various compounds studied between the two scales– laboratory and pilot – could bring a more precise insight of the biological processes occurring, particularly inside the PFB. Nonetheless, this comparison was necessarily preceded by a modeling of the temporal character of the process inside the PFB.
3.2. PLS prediction
The PLS calibration model was therefore built on production ki-netics data for the fungus growing in lab scaleflasks recorded between 1 and 9 days. Fonsecin and ustilaginoidin A were removed from the model because they interfered with thefinal prediction quality. Finally, the matrix was composed of 21 lines (7 kinetics with 3 replicates) and 8 rows which corresponded to the compounds productions measured at a given time.Table 1summarized PLS model parameters based on lab scale experiments.
PLS results showed that the residence time was well predicted from
lab scale measurements using metabolites concentrations; it was pre-dicted to half a day near with a good correlation coefficient (R2
of 0.97). This model was thus applied to predict the temporal gradient along the PFB using as input variables the metabolite compositions and conidia number relating to each compartment of the bioreactor. Measurements of metabolites concentration were done in duplicate for each compartment (Table 2). Predicted residence time values associated to each compartment were averaged and graphically represented to visualize the temporal evolution through PFB (Fig. 5).
Predicted residence time values showed that the fermentation oc-curs during a week inside the bioreactor (a constant value of 7.5 was obtained in the last compartments). This result was consistent with the value of mean residence time inside the bioreactor obtained previously. 3.3. Scales comparison
In order to evaluate the performance of the PFB for this process, thus see the impact of the transition from laboratory scale to the pilot, including the screw rotation effect on the conidia and metabolites productions, the production kinetics of the various fungal compounds were compared to those obtained in laboratory conditions. These pilot-scaled production kinetics consisted in the different compounds
Fig. 7. Comparison of compounds production kinetics under lab and pilot scales.
Compounds productions are expressed in mg equivalent rubrofusarine by g of dry matter, time is expressed in days. Time values used for the pilot scale correspond to predicted residence time obtained with the PLS model. Error bars represent the variability associated with the measurements of triplicate samples inside each compartment.
measured in the PBF plotted using the predicted residence time values associated to the compartments they were sampled from. The different curves are presented inFigs. 6 and 7.
As long as it is not a static process, it is essential tofind an adapted speed for the rotation inside the bioreactor: many mycelial SSF are shear sensitive due to disruption of the mycelia at higher speed. On the other hand, low agitation rates limit the mass and energy transfer at higher scale of production [27]. The comparison between the two production scales showed no significant difference for conidia produc-tion. This observation is interesting because it has been shown that agitated culture in PFB using a screw substantially lowered the conidia formation because a mechanical scraping of mycelia interferes with spore formation by breaking either the conidiophore, or the superficial structures on it, i.e. aerial hyphae are crushed onto the substrate surface during agitation thereby inhibiting sporulation [28]. This affirmation
however, is based on a constant agitation rate of 0.7 rpm and a solid support made of polyurethane foam cubes. In the present study how-ever, the solid medium included a support made of vine shoots chips, that unlike polyurethane foam, are very resistant to compaction phe-nomena and agitation was performed intermittently, thus reducing the shear forces negative impact on the fungus. It has been shown that agitation pattern is of great importance in enzymes production: like in our case, intermittent agitation has been proven to be beneficial for the production of pectinases by SSF in a pilot-scale packed-bed bioreactor leading to good production homogeneity within all the bed [29]. In addition, the absence of notable difference in the conidia production at both scales is also interesting because spores are obviously a compound of great interest, especially for the potential utilization of such propa-gules as biocontrol agent against pathogens [30,31]. Concerning the NγPs – fonsecin, ustilaginoidin A, unidentified NγPs mix and fonsecin B – productions, like conidia results, the curves obtained in this work suggest that the screw rotation parameters, along with the solid medium characteristics are suitable to these secondary metabolites productions thus we can speculate that a good balance is found between acceptable shear forces and good mass and heat transfers. Two com-pounds had nonetheless their productions lowered at a larger scale: the p-coumaric acid and the trans-ethyl ferulate. In fact, these hydro-xycinnamic acids are degradation products of the vegetal solid medium by the action of fungal feruloyl and p-coumaroyl esterases [26]. The same observation can be made forβ-D-glucose which is also a product generated by the fungal enzymes action on the culture medium. The lower productions of degradation product may be due, in this process, to a reduced production of hydrolases at higher scale. Lopez-Ramirez et al. [32], observed that the application of an agitation drastically diminished the cellulases production in comparison to their static conditions. The fact that productions of fonsecin and ustilaginoidin A started after two days of growth in lab scale and not in the PFB is the consequence of the RTD due to mixing and the adding of fermented materiel as inoculum in thefirst compartment leading to presence of these metabolites in thefirst compartments of the bioreactor. 4. Conclusion
The modelling of the temporal aspect of the fermentation in the PFB working semicontinuously under steady state is an important pre-requisite for further modelling of the biological processes occurring in the bioreactor. The experimental data of metabolites production mea-sured in laboratory scale were successfully used to perform PLS models to associate a predicted residence time from the measurement of the same fungal compounds to the different compartments of the bioreactor operating in the same humidity and temperature conditions. The pre-dicted residence time in thefinal compartment of the bioreactor cal-culated with the PLS model was in accordance with the mean residence time calculated experimentally with colored tracer injection. This temporal modelization also allowed the performance evaluation of the PFB with the comparison at lab and pilot scale, of the compounds
production kinetics and revealed promising results for secondary me-tabolites production with the bioreactor.
Acknowledgments
Support from Vinovalie (CIFRE ANRT number 2015/0027) is gratefully acknowledged.
References
[1] A. Pandey, Solid-state fermentation, Biochem. Eng. J. 13 (2003) 81–84. [2] Q. Carboué, I. Perraud-Gaime, M.S. Tranier, S. Roussos, Production of microbial
enzymes by solid state fermentation for food applications, in: R.C. Ray, C.M. Rosell (Eds.), Microbial Enzyme Technology for Food Applications, CRC Press, Boca Raton, 2017, pp. 437–451.
[3] N. Trivedi, C.R.K. Reddy, R. Radulovich, B. Jha, Solid state fermentation (SSF)-derived cellulase for saccharification of the green seaweed Ulva for bioethanol production, Algal Res. 9 (2015) 48–54.
[4] Q. Carboué, M. Claeys-Bruno, I. Bombarda, M. Sergent, J. Jolain, S. Roussos, Experimental design and solid state fermentation: a holistic approach to improve cultural medium for the production of fungal secondary metabolites, Chemometr. Intell. Lab. Syst. 176 (2018) 101–107.
[5] R.R. Singhania, A.K. Patel, C.R. Soccol, A. Pandey, Recent advances in solid-state fermentation, Biochem. Eng. J. 44 (2009) 13–18.
[6] C.S. Farinas, Developments in solid-state fermentation for the production of bio-mass-degrading enzymes for the bioenergy sector, Renew. Sustain. Energy Rev. 52 (2015) 179–188.
[7] T.L. Richard, A.H.M. Veeken, V. de Wilde, H.V.M. Hamelers, Air-filled porosity and permeability relationships during solid-state fermentation, Biotechnol. Prog. 20 (2004) 1372–1381.
[8] S.R. Couto, M.Á. Sanromán, Application of solid-state fermentation to food in-dustry-a review, J. Food Eng. 76 (2006) 291–302.
[9] P. Gervais, P. Molin, The role of water in solid-state fermentation, Biochem. Eng. J. 13 (2003) 85–101.
[10] H.Z. Chen, Z.H. Liu, S.H. Dai, A novel solid state fermentation coupled with gas stripping enhancing the sweet sorghum stalk conversion performance for bioe-thanol, Biotechnol. Biofuels 7 (2014) 1–13.
[11] L.P. Ooijkaas, F.J. Weber, R.M. Buitelaar, J. Tramper, A. Rinzema, Defined media and inert supports: their potential as solid-state fermentation production systems, Trends Biotechnol. 18 (2000) 356–360.
[12] J. van de Lagemaat, D.L. Pyle, Solid-state fermentation: a continuous process for fungal tannase production, Biotechnol. Bioeng. 87 (2004) 924–929.
[13] S. Brethauer, C.E. Wyman, Review: continuous hydrolysis and fermentation for cellulosic ethanol production, Bioresour. Technol. 101 (2010) 4862–4874. [14] R. Liguori, V. Ventorino, O. Pepe, V. Faraco, Bioreactors for lignocellulose
con-version into fermentable sugars for production of high added value products, Appl. Microbiol. Biotechnol. 100 (2016) 597–611.
[15] T.H. Varzakas, S. Roussos, I.S. Arvanitoyannis, Glucoamylases production of Aspergillus niger in solid state fermentation using a continuous counter-current reactor, Int. J. Food Sci. Technol. 43 (2008) 1159–1168.
[16] K. van’t Riet, J. Tramper, Basics, in: K. van’t Riet, J. Tramper (Eds.), Basic Bioreactor Design, Marcel Dekker Inc., New York, 1991, pp. 27–136.
[17] A.T.S. Walker, A.A. Wragg, The modelling of concentration—time relationships in recirculating electrochemical reactor systems, Electrochim. Acta 22 (1977) 1129–1134.
[18] M. Ballyk, H. Smith, A model of microbial growth in a plugflow reactor with wall attachment, Math. Biosci. 158 (1999) 95–126.
[19] M.A.I. Schutyser, W.J. Briels, A. Rinzema, R.M. Boom, Numerical simulation and PEPT measurements of a 3D conical helical-blade mixer: a high potential solids mixer for solid-state fermentation, Biotechnol. Bioeng. 84 (2003) 29–39. [20] D.A. Mitchell, O.F. von Meien, N. Krieger, Recent developments in modeling of
solid-state fermentation: heat and mass transfer in bioreactors, Biochem. Eng. J. 13 (2003) 137–147.
[21] J.Z. Liu, L.P. Weng, Q.L. Zhang, H. Xu, L.N. Ji, A mathematical model for gluconic acid fermentation by Aspergillus niger, Biochem. Eng. J. 14 (2003) 137–141. [22] H. Jiang, C. Mei, K. Li, Y. Huang, Q. Chen, Monitoring alcohol concentration and
residual glucose in solid state fermentation of ethanol using FT-NIR spectroscopy and L1-PLS regression, Spectrochim. Acta A. Mol. Biomol. Spectrosc. 204 (2018) 73–80.
[23] D. Olivet, J. Valls, M.À. Gordillo, À. Freixó, A. Sánchez, Application of residence time distribution technique to the study of the hydrodynamic behaviour of a full-scale wastewater treatment plant plug-flow bioreactor: Residence time distribution of a wastewater treatment plant plug-flow bioreactor, J. Chem. Technol. Biotechnol. 80 (2005) 425–432.
[24] L.B.R. Sánchez, M. Khanahmadi, D.A. Mitchell, Continuous solid-state fermentation bioreactors, in: D.A. Mitchell, N. Krieger, M. Berovič (Eds.), Solid-State-Fermentation Bioreactors, Springer, Berlin-Heidelberg, 2006, pp. 141–158. [25] T. Robinson, D. Singh, P. Nigam, Solid-state fermentation: a promising microbial
technology for secondary metabolite production, Appl. Microbiol. Biotechnol. 55 (2001) 284–289.
[26] W.S. Borneman, R.D. Hartley, W.H. Morrison, D.E. Akin, L.G. Ljungdahl, Feruloyl and p-coumaroyl esterase from anaerobic fungi in relation to plant cell wall de-gradation, Appl. Microbiol. Biotechnol. 33 (1990) 345–351.
Q. Carboué, et al. Biochemical Engineering Journal 149 (2019) 107248
[27] S. Liu, Continuous cultivation, in: S. Liu (Ed.), Bioprocess Engineering: Kinetics, Sustainability, and Reactor Design, Elsevier, Amsterdam, 2017, pp. 699–782. [28] J. van de Lagemaat, Solid-state fermentation and bioremediation: development of a
continuous process for the production of fungal tannase, Chem. Eng. J. 84 (2001) 115–123.
[29] A.T. Jung Finkler, A. Biz, L. Oliveira Pitol, B. Schweitzer Medina, H. Luithardt, L. Fernando de Lima Luz Jr., N. Krieger, D.A. Mitchell, Intermittent agitation con-tributes to uniformity across the bed during pectinase production by Aspergillus niger grown in solid-state fermentation in a pilot-scale packed-bed bioreactor, Biochem. Eng. J. 121 (2017) 1–12.
[30] L.G. Copping, J.J. Menn, Biopesticides: a review of their action, applications and efficacy, Pest Manage. Sci. 56 (2000) 651–676.
[31] T. Glare, J. Caradus, W. Gelernter, T. Jackson, N. Keyhani, J. Köhl, P. Marrone, L. Morin, A. Stewart, Have biopesticides come of age? Trends Biotechnol. 30 (2012) 250–258.
[32] N. Lopez-Ramirez, T. Volke-Sepulveda, I. Gaime-Perraud, G. Saucedo-Castañeda, E. Favela-Torres, Effect of stirring on growth and cellulolytic enzymes production by Trichoderma harzianum in a novel bench-scale solid-state fermentation bior-eactor, Bioresour. Technol. 265 (2018) 291–298.