Ecosystem metabolism in salt marsh tidal creeks and ponds: Applying triple
oxygen isotopes and other gas tracers to novel environments
by
Evan M. Howard
B.A. in Chemistry, University of Washington 2009 B.S. in Oceanography, University of Washington 2009 Submitted in partial fulfillment of the requirements for the degree of
Doctor of Philosophy at the
MASSACHUSETTS INSTITUTE OF TECHNOLOGY and the
WOODS HOLE OCEANOGRAPHIC INSTITUTION February 2017 MASSACHUSETTS INSTITUTE OF TECHNOLOGY
FEB 22
207
LIBRARIES
ARCHVEo
0 2017 Evan M. Howard. All rights reserved.The author hereby grants to MIT and WHOI permission to reproduce and to distribute publicly paper and electronic copies of this thesis document in whole or in part in any medium now known or hereafter created.
Author
...
Signature redacted
Evan M. Howard Joint Program in Oceanography/Applied Ocean Science and Engineering Massachusetts Institute of Technology and Woods Hole Oceanographic InstitutionDecember 20, 2016 C ertified by... C ertified by... A Accepted by...
S ig n a t
ignature redacted
...
RacheI'I.R. Stanley Assistant Professor, Wellesley CollegeI - <-,Thesis Co-Supeyvisor
Signature redacted
Scott D. Wankel ssociate Scientist, Woods Hole Oceanographic Institution Thesis Co-Supervisor
ure
redacted.
...
..
Shuhei Ono ssociate Professor, Massachusetts Institute of Technology
Ecosystem metabolism in salt marsh tidal creeks and ponds: Applying
triple oxygen isotopes and other gas tracers to novel environments
by
Evan M. Howard
Submitted to the MIT-WHOI Joint Program in Oceanography/Applied Ocean Science and Engineering in partial fulfillment of the requirements for the degree of
Doctor of Philosophy in Chemical Oceanography
Abstract
Salt marshes are physically, chemically, and biologically dynamic environments found globally at temperate latitudes. Tidal creeks and marshtop ponds may expand at the expense of productive grass-covered marsh platform. It is therefore important to understand the present magnitude and drivers of production and respiration in these submerged environments in order to evaluate the future role of salt marshes as a carbon sink. This thesis describes new methods to apply the triple oxygen isotope tracer of photosynthetic production in a salt marsh. Additionally, noble gases are applied to constrain air-water exchange processes which affect metabolism tracers. These stable, natural abundance tracers complement traditional techniques for measuring metabolism. In particular, they highlight the potential importance of daytime oxygen sinks besides aerobic respiration, such as rising bubbles. In tidal creeks, increasing nutrients may increase both production and respiration, without any apparent change in the net metabolism. In ponds, daytime production and respiration are also tightly coupled, but there is high background respiration regardless of changes in daytime production. Both tidal creeks and ponds have higher respiration rates and lower production rates than the marsh platform, suggesting that expansion of these submerged environments could limit the ability of salt marshes to sequester carbon.
Thesis supervisor: Rachel H.R. Stanley Title: Assistant Professor, Wellesley College Thesis supervisor: Scott D. Wankel
Acknowledgments
Financial support for my doctoral research was provided by the United States Department of Defense through the National Defense Science and Engineering Graduate Fellowship Program, the National Science Foundation under grant OCE-1233678, and the Woods Hole Oceanographic Institution (WHOI) under grants from the WHOI Coastal Ocean Institute, Ocean and Climate Change Institute, and Ocean Life Institute. WHOI Academic Programs Office also provided funding support for research, through the Ocean Ventures Fund, and for my stipend, as graduate research assistantships including an assistantship from the United States Geological Survey administered by WHOI. I am very grateful for this financial support which allowed me earn a living wage while focused on my doctoral research.
In addition, the great majority of this work would not have been possible without the outstanding logistical and in kind support of many scientific teams and individuals, including the Plum Island
Ecosystems Long Term Ecological Research site and TIDE experiment staff and scientists (these projects
funded by NSF OCE 1238212, NSF DEB 1354494, and NE Climate Science Center grant DOI
G 1 2ACOOOO 1), Nancy Pau at the Parker River National Wildlife Refuge who granted permits for the work in Chapters 4 and 5, and Liz Kujawinski and Krista Longnecker at WHOI who invited me to participate on cruise KN210-04 in the South Atlantic (funded by NSF grant OCE 1154320).
Specific acknowledgments are also found in each chapter of this thesis, but I'd like to thank a number of individuals in particular who helped me plan for, collect, and analyze the data that underlies this
dissertation. First my advisor, Rachel Stanley has supported me over every step of the last five years, whether in the lab or in the field, and she has helped me develop into a better scientist, educator, and communicator. It has been a great pleasure to work with her and I am profoundly glad that she took me on as her student. Her undergraduate students at Wellesley College are very fortunate to have her as a
mentor. Second, I am very thankful for the support and advice of my thesis committee, including Anne Giblin, Phil Gschwend, Amanda Sipvak, and my co-advisor Scott Wankel. All have devoted considerable time and energy to helping me succeed and I am lucky to have a team of such distinguished and
thoughtful scientists guiding and improving my work. Anne in particular has been an important mentor and role-model for me outside of WHOI. I'd also like to thank Meg Tivey, who chaired my defense and provided me with detailed comments on every chapter. Kim Vaeth also gave me thoughtful feedback on three of the four data chapters in this work, which greatly improved their quality for communicating my scientific work.
Zo8 Sandwith was involved in nearly every aspect of my research as the laboratory manager for my advisor Rachel Stanley, and this dissertation would not have been possible without her. Inke Forbrich and Jimmy Nelson were experienced and thoughtful sources of advice and support for every aspect of my work in the marsh, and went out of their way to make me feel like part of a larger scientific community. Anne Giblin and Linda Deegan did the same, and invited me into the Plum Island Ecosystem and TIDE Project community and helping me take advantage of the wellspring of resources and expertise associated with these projects. Justin Ossolinski also helped collect data that I use in three of the following chapters, including both open ocean and marsh work. Jen Karolewski, now a student in the MIT/WHOI Joint Program, was my partner in swampling and provided essential help collecting and analyzing data for Chapters 4 and 5 of this work. I am also grateful to Ashley Bulseco-McKim, David Behringer, Hap Garritt, Katherine Hoering, Kate Morkeski, and the "Sams" (the power team of Sam Kelsey and Sam Bond) who contributed instruments, advice, and muscle power to working in the marsh. I'd also like to thank the staff of the WHOI Isotope Geochemistry Facility for their amazing support with noble gas sampling and analysis: Bill Jenkins, Dempsey Lott, Joanne Goudreau, Josh Curtice, and Kevin Cahill.
I also would like to thank my collaborators on the various papers associated with some of the work that went into this dissertation, some of whom were mentioned above in other contexts. These include my
advisor Rachel Stanley, as well as Jen Bowen, Kevin Cahill, Colleen Durkin, Inke Forbrich, Anne Giblin, Gwenn Hennon, Pat Kearns, Dempsey Lott, Francois Ribalet, and Amanda Spivak.
I'd especially like to thank my labmate Cara Manning, who made our lab such an enjoyable place to work and without whose insights and advice I could not have completed this thesis. Cara's friendship and scientific collaboration has been the best part of my time in the Joint Program. I have many other friends at WHOI and MIT that have made my time here enjoyable and productive: Thank you all.
My family of course deserves thanks as well for supporting my scientific aspirations and being interested in even the most esoteric aspects of my research. My mother, father, and brother have cheered me one throughout my oceanography studies, over a decade at this point, and even earlier encouraged my interest in the sciences by way of trips to places like the Royal Tyrell Museum of Paleontology (a trip to the Canadian badlands was a grand family adventure). My grandfather and nana provided early inspiration for a career in science and technology, going so far as to send me vintage electronics textbooks. Thank you also to the Sawatzki "outlaws" that have embraced me as their own.
Most importantly and finally, thanks to my partner Kate Sawatzki. We've been partners in life and rabbit husbandry for a decade, and it is very much her responsibility that we moved to Boston and I embarked on doctoral research. I would not be who or where I am today without her, and this is definitely for the best (a couple of Boston winters excluded).
Contents
Chapter 1 Introduction
p. 1 1
Chapter 2
Biological production, export efficiency, and phytoplankton communities across 8000 km of the South Atlantic: Basin scale similarity with mesoscale variability
p. 19
Chapter 3
Evaluating the effects of nutrient addition on whole ecosystem oxygen metabolism in salt marsh tidal creeks
p. 5 9
Chapter 4
Using noble gases in a shallow aquatic environment to compare common gas exchange parameterizations and to constrain efflux of oxygen by ebullition
p. 117
Chapter 5
Production and respiration, and unusual metabolic processes in a salt marsh pond: insights from multiple chemical tracers
p. 135 Chapter 6 Conclusion p. 173 Bibliography p. 179
Chapter 1-Introduction
1 Salt marshes-ecologically rich environments with globally significant carbon fluxes Salt marshes, which are tidally flooded coastal meadows, are a dominant coastal environment at temperate latitudes globally, and are important in mediating the flow of carbon and nutrients between terrestrial and freshwater environments and the coastal ocean (Cai 2011, Deegan et al. 2012). Net primary production (the balance between photosynthetic production and autotrophic respiration only) is at least an order of magnitude greater in salt marshes than in the open ocean per unit area, and on par with that in tropical forests (Valiela 1995). A small but significant fraction of the carbon dioxide taken up by high rates of primary production in salt marshes is sequestered from the atmosphere on the scale of hundreds to thousands of years because of its rapid burial as peat (Hopkinson et al. 2012); organic matter burial in salt marshes is up to two orders of magnitude faster than in tropical forests on an areal basis, making salt marshes and tropical forests similar global carbon sinks (60-90 Tg C y- each) despite the fact that salt marshes cover less than 2% as much surface area (Duarte et al. 2005, Mcleod et al. 2011).
High primary production and subsequent peat accumulation in the grass covered salt marsh platforms provide the basis for a number of ecosystem services. These include physical protection of shoreline from storm surge and erosion, habitat and food for ecologically and economically important species (including the species that contribute 70-80% of the value of United States fisheries), and filtering of nutrients from coastal waters (Valiela and Teal 1979, Lellis-Dibble et al. 1998, Shepard et al. 2011). However, salt marshes are susceptible to human driven stressors that jeopardize the provision of these ecosystem services (Bromberg Gedan et al. 2009).
In particular, increased nitrogen loading from agricultural runoff and wastewater may alter ecosystem level metabolic fluxes such that the marsh becomes less effective at sequestering carbon (Deegan et al. 2012). Organic matter released from the marsh into the coastal ocean is expected to be respired and returned to the atmosphere, exacerbating carbon dioxide emissions and their contribution to climate change (Cai 2011; Hopkinson et al. 2012, Duarte et al. 2013a). Enhanced nitrogen loading may also lead to algal blooms in surrounding coastal waters that can cause hypoxia, fish kills, and shading and death of seagrasses (McGlathery 2001, Paerl 2006, Thronson and Quigg 2008).
Sea-level rise and infilling of mad-made drainage ditches, extensively used from colonial periods through the early I 9th century to control mosquitos and manage hay production, are also hypothesized to
contribute to expansion of tidal creeks and marshtop ponds throughout the marsh (Hartig et al. 2002, Wilson et al. 2014). Nutrient loading may similarly contribute to geomorphological change and expansion of these environments at the expense of the productive, grass covered marsh platform (Deegan et al.
2012).
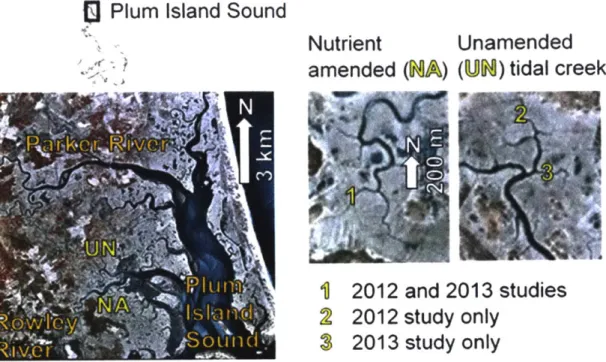
The metabolism of tidal creeks and ponds, as compared to the better studied grasses, is the primary focus of this thesis (Fig. 1). Because of sea-level rise and increased nutrients in estuaries, marshtop ponds and tidal creeks may be expected to play a larger role in overall salt marsh metabolism in the future. Thus, the primary producers and metabolic rates that characterize these environments will become increasingly important to the overall carbon cycling in salt marshes. It is therefore important to understand both the present magnitude and drivers of production and respiration in these environments and how these fluxes may change when evaluating the future role of salt marshes as a carbon sink.
C-)
Ponds
Grass
Tidal creeks
C CZ
Figure 1: Different environments within the Plum Island Ecosystems Long Term Ecological Research salt marsh in northeastern Massachusetts, USA. Aerial photograph shows tidal creeks and ponds (black), grass covered high marsh platform (gray, light brown) and low marsh with grass and mudflats (green, dark brown). Ponds, tidal creeks, and the grass covered high marsh from this setting are pictured separately as well.
2 Primary production in salt marshes-vascular plants, seaweeds, and benthic microalgae The importance of salt marsh primary production and resultant storage or export of organic matter to adjacent estuaries has been recognized for decades (Teal 1962). Along the United States' East coast, salt marsh macrophyte (visible) plant net primary production is dominated by marsh cordgrass, Spartina
alternmflora and S. patens. Annual aboveground net primary production by S.patens and S. alterniflora is
50 and 90 mol C M2 y', respectively, in the Plum Island Estuarine system in Northeastern Massachusetts, the site of much of my thesis work (Deegan et al. 2012, Morris et al. 2013). Despite these high production
rates, Spartina detritus does not appear to support much of the salt marsh food web at this location
(Galvin et al. 2011). Belowground production of Spartina roots and rhizomes can be greater than
aboveground production, and contributes to the impressive carbon burial rates in salt marshes (Dame and Kenny 1986, Turner et al. 2009).
In areas of the marsh that are generally submerged, macrophytes including the seagrass Ruppia maritima and macroalgae such as Ulva intestinalis are important primary producers, contributing between I to 30 Mol C m- y- or more depending on the nutrient supply (Roman et al. 1990, Peckol and Rivers 1996, Kinney and Roman 1998). Ulva in particular opportunistically bloom during nutrient enrichment. A final important group of primary producers in the salt marsh are the benthic microalgae. These microbial photosynthesizers, including diatoms, cyanobacteria, and green algae, are known to be
in submerged environments and on the marsh platform. Microalgae mediate nutrient and carbon fluxes in shallow environments year-round, and if light-limited by macrophyte shading in the spring and summer may actually have peak production when macrophyte grasses are least productive (Van Raalte et al. 1976, McGlathery et al. 2004, Sand-Jensen and Nielsen 2004). In salt marshes in particular, microalgae can contribute as much as 10-40% of annual net primary production on the rarely flooded marsh platform, and are the important or even dominant producers on creek banks, mudflats (Van Raalte et al. 1976, Pinckney and Zingmark 1993, Sullivan and Currin 2000), and shallow ponds on the marsh platform (Gallagher and Daiber 1974). Annual primary production by benthic microalgae in salt marshes ranges from around 4-25 mol C m-2
y-', although there are significant uncertainties associated with the techniques used to measure microalgae production and validate models of annual production (Williams and Lefevre 1996, Sullivan and Currin 2000).
It is increasingly important to understand drivers and magnitudes of production by primary producers in the submerged environments as these environments expand. Yet the predicted range and measured uncertainty of previous estimates of production by microalgae, macroalgae, and other submerged producers makes it difficult to evaluate their role in salt marsh metabolism, and thus the role of
submerged tidal creeks and ponds on salt marsh carbon cycling. Further, a variety of processes consume and produce metabolic tracers including oxygen and dissolved inorganic carbon that are commonly used to examine production. These processes, such as light enhanced consumption of oxygen or anaerobic
metabolisms, may vary with environmental conditions in ways that are not readily captured by standard methods of measuring metabolism fluxes.
3 Measuring metabolism in submerged environments-existing methods
Community metabolic fluxes in aquatic ecosystems include respiration, gross primary production (total carbon fixation prior to any respiration), and net community production (synonymously, net ecosystem production or net ecosystem metabolism), the net difference between carbon fixation and respiration in in the ecosystem. Respiration rates vary between autotrophs and heterotrophs, and may be limited by both
organic matter and electron acceptor availability. A variety of respiratory mechanisms exist as well, including aerobic and anaerobic respiration pathways. In sunlit systems, gross primary production is generally a measure of total photosynthesis, but chemolithoautotrophs can also fix inorganic carbon and produce organic matter, and may be important primary producers in estuarine sediments. In principle, net community production is the simplest rate to quantify, as it is the net balance of biological carbon fluxes in the ecosystem and should be readily related to the varying abundance of terminal metabolites such as dissolved oxygen and dissolved inorganic carbon. However, variable rates of chemically and physically driven sinks and sources of metabolites can complicate interpretation of the biological fluxes.
In lakes and estuaries in general, net community production and respiration are often evaluated from rates of oxygen production using techniques such as paired light-dark bottle or core incubations (Odum 1956, Cebrian et al. 2007), or diurnal differences of in situ oxygen concentrations in the water column (Vallino et al. 2005, Staehr et al. 2010). Respiration is inferred from the net community production rate in dark experiments or overnight, where photosynthesis is inferred to be zero. Barring major roles of anoxygenic photosynthesis, chemolithoautotrophy, and anaerobic respiration metabolisms (which change
concentrations of dissolved inorganic carbon but not oxygen) or non-aerobic sinks of oxygen (such as unconstrained physical fluxes or unconventional biological oxygen utilization pathways), gross primary production can then be calculated as the sum of the measured net community production in the light and inferred respiration.
However, production rates calculated using this standard method may be in error for methodological or environmental reasons. Incubations of water or sediment may introduce methodological biases, and in situ oxygen concentrations are sensitive to many processes besides production. Both incubation and open
water methods either assume that respiration in the light equals respiration in the dark or must model gross primary production using generalized relationships such as production-biomass or photosynthesis-irradiance curves derived from other methods of measuring primary production. Light respiration may exceed dark respiration by factors of 1.5 to to 10 or more in water column and benthic marine systems (Bender et al. 1987, Fenchel and Glud 2000, Pringault et al. 2007) because of processes including light-enhancement of mitochondrial respiration (i.e. dark respiration) and additional biological oxygen sinks driven by high daytime concentrations of irradiance such as photoreduction, photorespiration, and chemical oxidation of reduced compounds.
Alternative methods for assessing gross primary production are varied, with different methodological limitations. In general these techniques fall into three major categories: measurements of Chlorophyll-a or biomass combined with models of growth under various environmental conditions (light, nutrients), more nuanced interpretations of variability in oxygen concentrations, and isotope uptake experiments. Sediment and water column chlorophyll can be measured using fluorometry or high performance liquid
chromatography, either on extracted samples or in situ (Underwood and Kromkamp 1999, Kromkamp et al. 2006, Brotas et al. 2007). Unfortunately, the relationship between chlorophyll content and gross primary production depends strongly on species dependent physiology and physical factors such as light attenuation and chlorophyll to carbon ratios, which can vary by almost an order of magnitude (Flynn 2003, Ross and Geider 2009), though theoretical advances suggest that these limitations could be overcome moving forward (Halsey et al. 2010). Additionally, spectrophotometric estimation of
Chlorophyll-a in salt marshes may be complicated by interference from degradation products (MacIntyre et al. 1996).
Oxygen microelectrodes in sediments can provide highly precise in situ measurements of benthic production that are independent of the light-dark assumption (Revsbech and Jorgensen 1983). However, these measurements tend to be limited to a very small spatial scale and require correction for benthic community dynamics such as the diel vertical migration of benthic diatoms, which limits their usefulness in determining production at an ecosystem scale (Brotas et al. 2007). The eddy correlation technique uses paired microelectrodes and velocimeters to integrate benthic fluxes over a spatial scale of tens of square meters with high temporal resolution, but can reintroduce assumptions related to light-dark respiration ratios (Berg et al. 2003, Glud et al. 2010).
Gross primary production can be estimated from uptake of radiocarbon labeled bicarbonate in short-term bottle or sediment incubations, or by uptake of H2180 in bottle incubations (Gazeau et al. 2007,
Krause-Jensen et al. 2011). The radiocarbon method has long been used in estuaries and marshes, but rates vary substantially with incubation time and there is uncertainty as to whether they reflect gross primary production or something closer to net primary production (gross primary production minus autotrophic respiration only; Dring and Jewson 1982; Williams and Lefevre 1996). Indeed, many conclusions about the magnitude and stoichiometry of production based on radiocarbon incubations have subsequently been largely dismissed as artifacts of methodological biases related to that method (Williams and Robertson
1991). Despite this limitation, radiocarbon incubations are the only technique summarized here that accounts for chemoautotrophy, which may be of comparable magnitude to oxygenic photosynthesis in poorly flushed sediments (Tobias and Neubauer 2009). In the open ocean, gross primary production determined from 180 tends to be similar or greater to that obtained from light-dark bottle incubations.
However, work in a lake and estuaries that are well below oxygen saturation suggest that 180 derived GPP
can be depressed because of intracellular recycling of labeled 180160, with large uncertainties related to
fractionation during respiratory pathways (Yacobi et al. 2007, Gazeau et al. 2007), and the method is perhaps unsuited for work in the generally low oxygen salt marsh environments. In either type of
incubation experiment, bottle effects complicate interpretation of production estimates (Quay et al. 2010). Clearly there are many potential approaches to measuring production and in particular gross primary production in estuaries that may be applicable to submerged salt marsh environments. I introduce one new
method as a tool for studying production in salt marshes which has strengths that compliment standard methods.
4 Applying the triple oxygen isotope method to salt marsh environments
In this thesis, I use the natural abundance ratios of triple oxygen isotopes (160, 170, and 180) to estimate
gross primary production. This method has been applied in marine environments, particularly the pelagic ocean, for more than a decade (Luz and Barkan 2000, Juranek and Quay 2013), but is not typically used in estuarine systems. This technique combines some of the strengths of the isotopic and oxygen based methods-it provides a direct measurement of photosynthetic rate, and, when used in situ, integrates over large spatial scales. At the same time, it does not require an artificial isotope spike but relies on natural abundance stable isotopes. Moreover, the triple oxygen isotope method is relatively insensitive to normal aerobic respiration and other mass-dependent fractionation processes, and thus does not require major assumptions regarding the relative rates of light and dark respiration.
The triple oxygen isotope method is based on the different isotopic signatures of dissolved molecular oxygen (02) that is added to a body of water via gas exchange versus that generated in situ during photosynthesis. Atmospheric 02 has a distinct ratio of stable oxygen isotopes 160:170:180 set by mass independent fractionation during dissociation of ozone in the stratosphere (Thiemens and Heidenreich
1983, Thiemens et al. 2012). Photosynthesis fractionates seawater in a mass dependent manner and generates 02 with an isotopic composition similar to that of the water it was produced from (Luz and Barkan 2000, Barkan and Luz 2011). All measured aerobic respiration pathways have mass dependent fractionation with a nearly constant ratio of 170:160 to 180:160 isotope enrichment factors (Angert et al. 2003, Luz and Barkan 2005, 2009). The constancy of the ratio between the respiration enrichment factors means that 180:160 can be related to 170:160 in such a way that respiration effects cancel out. The
combined triple oxygen isotope tracer, typically represented by the notation 7A, depends primarily on the source of the dissolved 02 (Fig. 2), i.e. atmospheric or photosynthetic 02. With an independent estimate of the amount of atmospheric oxygen dissolved in the water using a gas exchange parameterization, the concentration of photosynthetic 02 can be solved for, and
gross primary production.
ete02...---
max ...---. +4Adissolved
0 - 1730
In(6
18/1000+1)
it's time rate of change is directly related to
Figure 2: Triple oxygen isotope systematics for dissolved oxygen, after Juranek and Quay
(2013). 1 7
Adissolved is the water value, which falls along a mixing line between '7Aair, the
atmospheric endmember, and 17Amax the expected photosynthetic endmember for a given system. Respiration along the slope yR=0.5179 0.006 does not change the relative relationship of the oxygen isotope ratios, plotted here in standard isotope notation
(6x=(xo: 1
60sample / x0:16
Analysis of data from salt marshes presents some new challenges for the triple oxygen isotope method. In the mixed layer of the pelagic ocean, steady state between photosynthetic production and gas exchange is generally assumed, and the ratio of 02 from each source is equal to the ratio of gross primary production to gas exchange (Hendricks et al. 2004). However, a steady state interpretation is poorly suited to tidal creeks and marshtop ponds, which experience large diel swings in chemical, physical, and biological parameters. So even with an independent estimate of gas exchange, additional constraints related to the physical transport and time evolution of 02 in the water are required. Kaiser (2011) and Prokopenko et al. (2011) derive equations that include additional corrections for equilibrium and kinetic fractionation factors related to gas exchange and photosynthesis, and that do not require an assumption of steady state in dissolved 02 concentration or isotopic ratios if both are monitored. The triple oxygen isotope method is typically also applied assuming a known seawater isotopic composition. However, in salt marshes a substantial fraction of the estuarine water may be derived from meteoric water (from precipitation, rivers, and groundwater) and local seawater may not be similar isotopically to the mean global seawater
composition (Luz and Barkan 2010, Li et al. 2015). Additionally, the small photosynthetic fractionations vary between algae types (Helman et al. 2005), such as diatoms versus cyanobacteria, and the mean fractionations assumed for seawater include groups that are unrepresentative of salt marshes, such as coccolithophores. Thus when applying the triple oxygen isotope method in estuarine or coastal environments, care must be taken to account for local differences in water isotopic composition and community structure.
The triple oxygen isotope technique provides a direct, natural abundance measure of gross primary production that yields some improvements over many existing techniques, but the triple oxygen isotope method has weaknesses as well. Sample processing (described in detail in the thesis chapters) is
technically challenging, and requires a minimum quantity of total dissolved 02 in the sample for precise and accurate measurement in the isotope ratio mass spectrometer. Low 02 concentrations typical of some tidal stages and periods in the salt marsh require modified sample processing that is particularly time-intensive, and at particularly low 02 large uncertainties can make the method impractical. Additionally, like any oxygen based method it will not capture anoxygenic photosynthesis or chemolithoautotrophic production. Temporal resolution of triple oxygen isotope derived rates from discrete samples is by necessity coarser than 02 concentration based methods since the latter can use rapid response sensors. Finally, production must be relatively high to minimize uncertainties relative to measured values. Despite these limitations, the triple method provides a useful and novel tool for evaluating primary production in salt marsh tidal creeks and ponds, especially when used in tandem with other metabolism measurement techniques. The triple oxygen isotope method complements standard methods in particular because it requires few assumptions about the relative rate of daytime respiration versus nighttime respiration; indeed, unlike most existing methods, the magnitude of daytime oxygen sinks can be determined by directly comparing triple oxygen isotope derived gross primary production to net community production from measured daytime oxygen fluxes.
5 Applying noble gases to constrain physical fluxes in salt marsh environments
In physically dynamic salt marsh environments, physical fluxes of metabolic products such as 02 may be as large or larger than metabolic fluxes. Thus, accurate determination of metabolic fluxes requires careful accounting for physical processes. As part of this thesis, I use the dissolved noble gases in order to
constrain air-water fluxes. The stable noble gases (helium, neon, argon, krypton, and xenon) are a suite of naturally occurring, biologically inert tracers that vary widely in solubility and are sensitive to a range of physical processes over the same timescales as 02 and carbon dioxide (Stanley and Jenkins 2013). These processes include diffusive gas exchange and bubbling from the sediments, or ebullition. More soluble gases including krypton and xenon are primarily sensitive to changes in temperature while less soluble neon and helium are highly sensitive to bubble processes. Argon exhibits intermediate sensitivity to these
processes, similarly to 02. Thus the noble gases allow comparison of published gas exchange
parameterizations in addition to characterization of other important, site-specific air-water fluxes that may affect oxygen concentrations and triple oxygen isotope ratios. As air-water gas exchange is frequently the largest source of error for metabolic rates derived from dissolved gas tracers (Raymond and Cole 2001, Emerson et al. 2008, Staehr et al. 2010), noble gas data plays an important role in selecting appropriate air-water exchange parameterizations and maximizing accuracy of calculated metabolism rates.
6 Thesis overview
This thesis applies dissolved gas tracers previously used in open ocean settings to less studied salt marsh tidal creeks and pond, in order to better understand the role of these settings to salt marsh carbon cycling and how that may change in a period of increasing human influence on coastal environments. Salt marsh tidal creeks and ponds are physically, chemically, and biologically dynamic environments that have additional complications and require additional considerations compared to surface ocean environments. The following chapters have an overarching theme of applying and modifying methods for dissolved gas tracers of integrated, in situ biological and physical effects (triple oxygen isotopes, oxygen to argon ration, noble gases) to environments where metabolic rates may be poorly constrained by existing techniques.
Chapter 2 uses the triple oxygen isotopes and oxygen to argon ratio in a more standard open ocean setting, but with some modifications to the calculation scheme that allow more accurate assessment of metabolism using these tracers in specific environments in which normal processing of the tracer data falls short. For example, in this chapter equations are introduced to use triple oxygen isotopes in environments where isotopic measurements are influenced by mixing of water masses with different isotopic composition. In Chapter 3, triple oxygen isotopes are used in salt marsh tidal creeks, requiring consideration of even more extensive mixing and physical fluxes which modify the composition of dissolved oxygen simultaneously with biological fluxes. Benthic chamber experiments are introduced as a way to simplify the physical system, but lead to new methodological considerations and biases to the tracer measurements. In Chapter 4, I use dissolved noble gases in a salt pond to evaluate the suitability of literature gas exchange parameterizations to this environment and identify additional important physical fluxes of gases that may influence metabolism tracers. This work sets the stage for Chapter 5, in which I use both the triple oxygen isotope tracer and more standard metabolic tracers (dissolved oxygen and dissolved inorganic carbon) to measure production, respiration, and net metabolism over hourly to seasonal timescales. The combination of tracers allows me to systematically evaluate light-dependent oxygen uptake compared to dark respiration and the potential role of anaerobic and anoxygenic metabolisms on carbon cycling in the salt marsh pond.
I highlight the common themes and guiding questions of the four data analysis chapters below. Taken together, the answers to these questions leads to better understanding of the role of salt marshes in the carbon cycle compared to other marine settings, and how that role may evolve over time in these changing environments.
Themes:
Relationships between metabolism and community of primary producers (Chapters 2, 3, 5). Application of dissolved gas tracers in marine settings where they have not previously been used (Chapters 2, 3, 4, 5).
Methodological modifications for evaluating production in a setting where standard triple oxygen isotope data processing cannot be used (2, 3, 5).
Physical and biological processes often neglected in ocean settings that may be important for interpreting metabolism (Chapters 3, 4).
Research questions:
Chapter 2-ocean setting
How are metabolism, carbon export, and community structure related in the surface South Atlantic Ocean?
Chapter 3-metabolism in salt marsh tidal creeks
How does nutrient enrichment affect community metabolism in tidal creeks, and does this response differ between the creek-bottom sediments and the integrated creek ecosystem?
Chapter 4-air-water gas exchange in a salt marsh pond
What air-water diffusive gas exchange parameterization is most appropriate to this small, shallow aquatic system, and are there other physical gas fluxes that are large compared to this flux?
Chapter 5-metabolism in a salt marsh pond
What are the metabolic rates in a marshtop pond, and how do they vary over hourly to seasonal
timescales? Compared to oxygenic photosynthesis and aerobic respiration, do unusual oxygen or carbon metabolisms play a major role in controlling carbon cycling in this environment?
Chapter 2
Biological production, export efficiency, and phytoplankton communities
across 8000 km of the South Atlantic: Basin scale similarity with mesoscale
variability
A version of this chapter is under review for potential publication in Global Biogeochemical Cycles. The authors are: Evan M. Howard, Woods Hole Oceanographic Institution, Massachusetts Institute of Technology; Colleen A. Durkin, Moss Landing Marine Laboratories; Gwenn M.M. Hennon, Lamont-Doherty Earth Observatory; Francois Ribalet, University of Washington; Rachel H.R. Stanley, Wellesley College.
Data availability
Supporting data are included in the electronic supplementary information (not in this text because of space and file size constraints). The electronic supplementary information is available from the
MBL/WHOI library (https://darchive.mblwhoilibrary.org/handle/1 912/1172). Additional hydrographic data are available through the Biological and Chemical Oceanography Data Management Office (http://www.bco-dmo.org/project/2204).
Abstract
In situ oxygen tracers (triple oxygen isotope and oxygen/argon ratios) were used to evaluate meridional trends in surface biological production and export efficiency across -8000 km of the tropical and subtropical South Atlantic in March-May 2013. We used observations of pico-, nano-, and
microphytoplankton to evaluate community structure and diversity, and assessed the relationships of these characteristics with production, export efficiency, and particulate organic carbon (POC) fluxes. Rates of productivity were relatively uniform along most of the transect with net community production (NCP) between 0 and 10 mmol 02 m-2
d-1, gross primary production (GPP) between 40 and 100 mmol 02 m-2 d-, and NCP/GPP, a measure of export efficiency ranging from 0.1-0.2 (0.05-0.1 in carbon units). However, notable exceptions to this basin scale homogeneity included two locations with highly enhanced NCP and export efficiency compared to surrounding regions. POC flux correlated with GPP rather than with NCP. No significant production differences were observed between different phytoplankton communities, but the variance of production and diversity correlated between biogeographic provinces, indicating a possible shared driver of variability of production and diversity. Overall these results highlight the
similarity of biological production over large regions of the Atlantic on the scale of thousands of
kilometers, overlain with high variability on the scale of hundreds of kilometers. This intriguing increase in variability on small scales supports growing evidence that mesoscale and smaller processes may be key controls on the biological carbon pump.
Keywords
Biological carbon pump, community structure, diversity, triple oxygen isotopes, oxygen argon, particulate organic carbon, South Atlantic, mesoscale
Acknowledgments and data
Cruise KN210-04 was supported by NSF grant OCE 1154320 to E.B. Kujawinski and K. Longnecker (WHOI). The author was supported by grants from the Woods Hole Oceanographic Institution (WHOI) Ocean and Climate Change Institute and WHOI Ocean Life Institute to R.H.R.S., and the National Defense Science and Engineering Graduate Fellowship program. I would like to thank the captain, crew, and shipboard scientific technicians of the RV Knorr for at sea support, and cruise principal investigators E.B. Kujawinski and K. Longnecker for inviting participation on KN201-04 and generous in-kind support. Thanks as well to Colleen A. Durkin, Gwenn M.M. Hennon, and Francois Ribalet for their constructive feedback on this work in addition to the version under review on which they are coauthors. I am grateful to Z. Sandwith for cruise setup and laboratory assistance with gas tracer analyses and J. Swallwell for assistance with setup and operation of the SeaFlow continuous underway flow cytometry system, and to B. Van Mooy and J. Ossolinski for support in collecting sediment trap samples.
1 Introduction
Marine systems play an important role in the global carbon cycle as sinks or sources of atmospheric carbon dioxide [Takahashi et al. 2009]. The biologically mediated processes controlling fixation and export of carbon from the euphotic zone to the deep ocean, called the biological carbon pump [Volk and
Hoffert 1985], are a major control on atmospheric CO2. A primary means of transporting organic matter
to the deep ocean is through sinking particulate organic carbon (POC) such as cells, detrital aggregates, and zooplankton fecal pellets [Benitez-Nelson et al. 2001, Ducklow et al. 2001]. Dissolved organic carbon (DOC) fluxes are additionally an important component of carbon export to depth [Hansell et al. 2009, 2013]. Fluxes of POC and DOC out of the surface mixed layer are modulated by community structure and production of phytoplankton and zooplankton [Boyd and Newton 1995, Boyd and Trull, 2007, Lomas and
Bates 2004, Guidi et al. 2009, 2016]. Plankton community structure is variable across space (tens of
meters to ocean basins) and time (hours to decadal time scales), and may be a major factor determining the magnitudes of production rates and carbon export, and thus the efficiency of the biological carbon pump in sequestering carbon to the deep ocean [Karl et al. 2001, 2012, Vaillancourt et al. 2003,
Richardson and Jackson 2007, Henson et al. 2012]. Investigators have described correlations of
community structures with patterns of primary production and carbon export in a variety of nutrient regimes [Pollard et al. 2009, Moreno-Ostos et al. 2011, Lockwood et al. 2012, Cassar et al. 2015]. Transition regions at gyre edges between higher and lower nutrient regimes can be zones of high biomass and intensified production [Juranek et al. 2012, Ostle et al. 2015] with unique phytoplankton
communities distinct from the regions to either side [Kavanaugh et al. 2014a, Palevsky et al. 2013,
Ribalet et al. 2010].
Such relationships between physical ocean structure and nutrients, biological community structure, and the biological carbon pump can be combined with expanding availability of remotely sensed data
[Johnson et al. 2009, McClain 2009, Xing et al. 2011] in order to model primary production and carbon
export over regional and global scales [Behrenfeld and Falkowski 1997, Westberry et al. 2008, Utiz et al. 2010]. In some parts of the ocean, satellite informed model results poorly reproduce in situ observations of production and export in terms of both magnitude and variability [Friedrichs et al. 2009, Palevsky et
al. 2013, Emerson 2014, Lee et al. 2015, Swirgoni and Stramska 2015], suggesting that there are still gaps
in the mechanistic understanding of what drives production and export. The food-web approach of Siegel
et al. [2014] demonstrates that a better understanding of how community structure affects production can
improve model predictions of carbon export [Stukel et al. 2015]. A growing body of literature suggests that physical variability is an important determinant of community structure [Barton et al. 2010], production [Nicholson et al. 2008], and export [Ayers and Lozier 2012]. In particular submesoscale to mesoscale (kilometers to hundreds of kilometers) variability may play an important role in increasing phytoplankton community diversity [Clayton et al. 2013, 2014, Levy et al. 2014, 2015] and concentrating
or enhancing biological activity [McGillicuddy et al. 2007, Klein and Lapeyre 2009, Estapa et al. 2015] at small scales.
Variability in carbon export is affected by both community structure and the underlying physical variation driving changes in phytoplankton production. We evaluate biological carbon pump fluxes and
phytoplankton community structure from the mesoscale to the basin scale across an 8000 km transect in the western subtropical and equatorial South Atlantic Ocean by combining measurements of gross primary production and net community production rates (triple oxygen isotope and oxygen argon natural
abundance tracers) with concurrent in situ, high resolution measurements of cyanobacteria and
picoeukaryote abundances (underway flow cytometry), nano-and microphytoplankton abundances (visual microscopy), and POC export fluxes below the surface mixed layer (drifting sub-surface sediment traps). Gross primary production (GPP) is equal to total photosynthetic production prior to any respiration or other recycling of oxygen or organic carbon [Williams 1993]. Net community production (NCP) is equal to GPP minus community respiration, and expresses the net carbon drawdown or oxygen production by the biological pump. NCP should be balanced by export of carbon over sufficient scales of time and space
[Emerson et al. 1997, Brix et al. 2006], including dissolved organic carbon (DOC) and zooplankton
mediated export in addition to POC sinking out of the mixed layer [Emerson 2014]. The NCP/GPP ratio is a measure of metabolic efficiency akin to the f-, e-, and ef-ratios [Eppley and Peterson 1979, Murray et
al. 1996, Laws et al. 2000]. Thus the ratio of NCP/GPP has been called an "export ratio in 02 currency" [Juranek and Quay 2013]. Higher NCP/GPP ratios indicate that a larger fraction of production is not
respired locally over the residence time of the oxygen based tracers.
In particular, we evaluate (1) how changes in the spatial variability of phytoplankton abundance,
community structure, and diversity and production relate to export from the basin scale to the mesoscale, (2) whether differences in net community production and particulate organic carbon export rates are potentially balanced by dissolved organic carbon production, and (3) if export is proportional to autotroph production (GPP) in a transect where picophytoplankton dominate the phytoplankton community
[Richardson and Jackson 2007, Stukel and Landry 2010, Guidi et al. 2016].
2 Methods
All samples were collected aboard the RVKnorr (KN210-04). The cruise traversed 8480 km and nearly 220 of latitude of the western South and Equatorial Atlantic (Figure 1) between Montevideo, Uruguay, and Bridgetown, Barbados from 25 March through 9 May of 2013, in austral fall. The cruise track encompasses a number of surface physical regimes, including the South Atlantic subtropical front and transition region, subtropical gyre, and the tropics and equatorial current system [Tsuchiya et al. 1994,
Stramma and Schott 1999, Memery et al. 2000]. Finally, the cruise passed through the pelagic and
mesohaline portions of the Amazon River plume [Hu et al. 2004]. These physically defined regions overlap distinct biogeographic provinces [Longhurst 1995], including the South Subtropical transition zone (SST), the South Atlantic Gyre (SAG), the Western Tropical Atlantic (WTA) and the Amazon River Plume (ARP). Samples for gas tracer analysis were collected from surface waters while underway and at discrete stations (Table 1). At three stations (locations 2, 9, and 20) the Knorr remained stationary for one to two days. At three other stations, the ship followed drifting particle traps [Durkin et al. 2016] in a quasi-Lagrangian manner for one to three days (locations 7, 25, 31). At all of these stations with longer sampling durations (Table 1), multiple discrete gas tracer samples were collected either at arrival and departure from the station, or as a time-series over the duration of the stay. Gas tracer estimates of production across the transect were compared with concurrent underway observations of surface cyanobacterial and picoeukaryote populations [Hennon 2015, Hennon et al. in prep]. Data were also compared with concurrent observations of surface eukaryotic phytoplankton abundance and the
phytoplankton and carbon fluxes captured in free-floating particle interceptor traps at 125 m reported by
Durkin et al. [2016]. Particulate nitrogen fluxes analyzed simultaneously with particulate carbon were not
k
a
60 W 30 W 1.25 60 W 30 W ;29 29 27 25 U WTA -RP ARP CO 0 0 0 2-2- 07 0~.U 0.8 119 15 25 23 0.6 1 2 3 15 S 3 15 S 21 . 0.4 9 SAG 19 7C* 30' S 0.2 30' S -S 17 0.1 0.05 15 _r 15Figure 1: Sample locations in the Equatorial and South Atlantic overlaid on satellite derived (a) sea surface Chlorophyll-a and (b) daytime sea surface temperature averaged from March through May 2013 (with odd station numbers labeled). Four biogeographic provinces identified as in the text (South
Subtropical Transition zone, SST; South Atlantic Gyre, SAG; Western Tropical Atlantic, WTA; Amazon River Plume, ARP) are noted in each panel and separated by dashed lines. Sea surface data are from MODIS-Aqua satellite and obtained from the Giovanni online data system (Acker and Leptoukh [2007]; http:Giovanni.gsfc.nasa.gov/Giovanni/) maintained by the NASA Goddard Earth Science Data and Information Services Center.
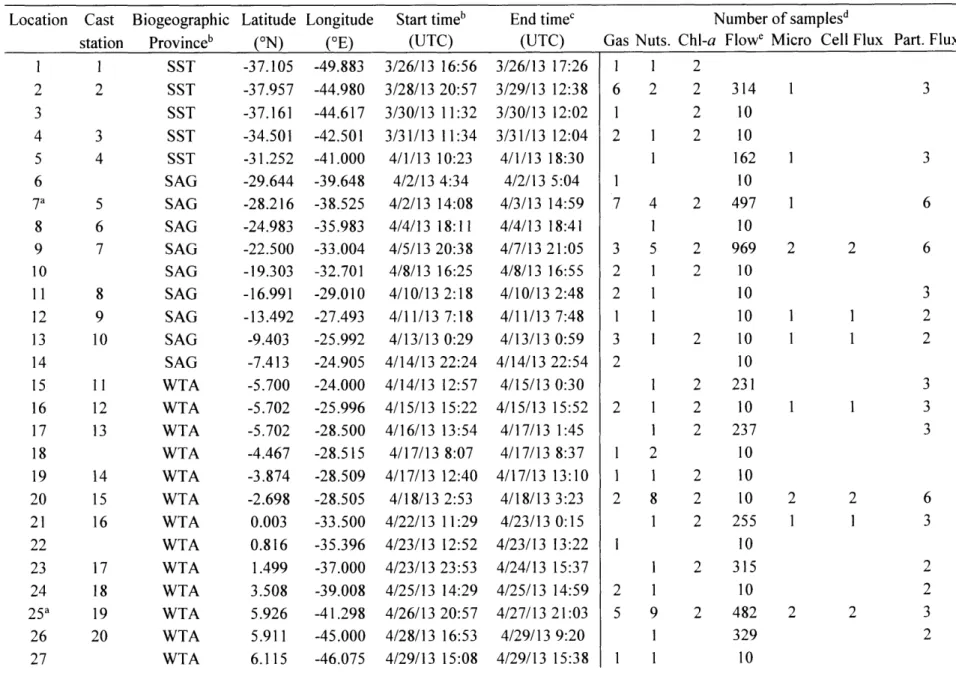
Table 1: Sample locations and replicates with respect to biogeographic provinces
Location Cast Biogeographic Latitude Longitude Start timeb End timec Number of samplesd
station Provinceb (ON) (OE) (UTC) (UTC) Gas Nuts. Chl-a Flowe Micro Cell Flux Part. Flux
1 2 3 4 5 6 7a 8 9 10 11 12 13 14 15 16 17 18 19 20 21 22 23 24 25a 26 27 3 4 5 6 7 8 9 10
11
12 13 14 15 16 17 18 19 20 1 2 SST SST SST SST SST SAG SAG SAG SAG SAG SAG SAG SAG SAG WTA WTA WTA WTA WTA WTA WTA WTA WTA WTA WTA WTA WTA 1 61
1
2 U, 3 3 -37.105 -37.957 -37.161 -34.501 -31.252 -29.644 -28.216 -24.983 -22.500 -19.303 -16.991 -13.492 -9.403 -7.413 -5.700 -5.702 -5.702 -4.467 -3.874 -2.698 0.003 0.816 1.499 3.508 5.926 5.911 6.115 -49.883 -44.980 -44.617 -42.501 -41.000 -39.648 -38.525 -35.983 -33.004 -32.701 -29.010 -27.493 -25.992 -24.905 -24.000 -25.996 -28.500 -28.515 -28.509 -28.505 -33.500 -35.396 -37.000 -39.008 -41.298 -45.000 -46.075 4/22/13 4/23/13 4/23/13 4/25/13 4/26/13 4/28/13 4/29/13 11:29 12:52 23:53 14:29 20:57 16:53 15:08 3/26/13 16:56 3/28/13 20:57 3/30/13 11:32 3/31/13 11:34 4/1/13 10:23 4/2/13 4:34 4/2/13 14:08 4/4/13 18:11 4/5/13 20:38 4/8/13 16:25 4/10/13 2:18 4/11/13 7:18 4/13/13 0:29 4/14/13 22:24 4/14/13 12:57 4/15/13 15:22 4/16/13 13:54 4/17/13 8:07 4/17/13 12:40 4/18/13 2:53 3/26/13 17:26 3/29/13 12:38 3/30/13 12:02 3/31/13 12:04 4/1/13 18:30 4/2/13 5:04 4/3/13 14:59 4/4/13 18:41 4/7/13 21:05 4/8/13 16:55 4/10/13 2:48 4/11/13 7:48 4/13/13 0:59 4/14/13 22:54 4/15/13 0:30 4/15/13 15:52 4/17/13 1:45 4/17/13 8:37 4/17/13 13:10 4/18/13 3:23 4/23/13 0:15 4/23/13 13:22 4/24/13 15:37 4/25/13 14:59 4/27/13 21:03 4/29/13 9:20 4/29/13 15:38 2 2 314 2 10 2 10 162 10 2 497 10 2 969 2 10 10 10 2 10 10 2 231 2 10 2 237 10 2 10 2 10 2 255 10 2 315 10 2 482 329 10 2 2 6 6 3 2 2 3 3 3 1 2 1 7 41
3 5 2 1 2 11
1
3 1 2 2 1 1 1 2 1 1 2 8 2 1 5 9 I I 1 1 2 1 2 1 6 3 2 2 3 2 2 2 I 11
1
l
Table 1: Sample locations and replicates with respect to biogeographic provinces, continued Location Cast station 28 21 29 22 30 31a 23 Biogeographic Province WTA WTA ARP ARP Latitude (ON) 6.513 8.279 9.835 9.670 Longitude (OE) -48.008 -49.984 -55.860 -55.283 Start timeb (UTC) 4/30/13 11:19 5/1/13 14:06 5/3/13 8:48 5/3/13 15:39 End time' (UTC) 4/30/13 11:49 5/1/13 14:36 5/3/13 9:18 5/6/13 14:33 Gas 2 1 2 10 Nuts. I 1 1 4 Chl-a 2 2 2 2 Number of samplesd Flowe Micro Cell Flux
10 2 2
10 10
1418 2 2
a. quasi-Lagrangian sampling
b. South Subtropical Transition (SST), South Atlantic Gyre (SAG), Western Tropical Atlantic (WTA), Amazon River Plume (ARP) c. corresponds to evaluated period of underway flow cytometry
d. Gas tracers (gas), nutrients (nut.), Chlorophyll-a (Chl-a), Flow cytometry (Flow), microscopy (micro), cell and particle number flux (Cell Flux), particulate organic carbon and particulate nitrogen flux (Part. Flux)
e. number of 3 minute averaging periods
Part. Flux 3 2
2.1 Underway sampling line
Surface water was collected using the ship's underway flow-through system at 5 m depth, and passed through an inline de-bubbler and a Seabird Electronics SBE45 thermosalinograph prior to sample collection. In order to minimize biofouling, the underway line was flushed with bleach at the beginning and halfway through the cruise (April 3, 2013) by dissolving 150-200 g pelletized sodium hypochlorite in the -150 L sea chest (-0.1% sodium hypochlorite solution) [after Juranek et al. 2010]. After each
cleaning, the underway line was then flushed for 12-15 hours by normal seawater flow prior to commencing sampling. 1 L min-' of water from the underway line was diverted for sampling of gas tracers, nutrients, and Chlorophyll-a.
2.2 Discrete gas tracer theory, sampling, and analysis
2.2.1 02/Ar and triple oxygen isotope ratio theory and calculation ofproduction rates
We use the oxygen to argon ratio as a tracer of net oxygen production in the surface mixed layer. Argon acts as a biologically inert analogue of oxygen in seawater, and the difference in saturation state between the two gases is assumed to correspond primarily to the balance of photosynthesis and respiration [e.g.
Craig and Hayward 1987, Spitzer and Jenkins 1989, Emerson et al. 1991]. Extending the equations by Cassar et al. [2011 ] such that argon is not assumed to be at saturation and neglecting horizontal and
vertical mixing, the time evolution of oxygen relative to argon in the mixed layer is controlled by production and gas exchange:
z( Oa 2 [s2][ rAr sat] p = NCP - k02 sat
[
A1 sat5 =NP-o Ar (at)
where z is the mixed layer depth defined as a 0.125 kg m-' offset in potential density from the surface
[Levitus 1982], 02 and Ar are measured concentrations (molal), and O2sat and Arsat are saturation concentrations (molal) [Garcia and Gordon 1992, 1993, Hamme and Emerson 2004]. The ratio
A02/Ar-[(02/Ar)/(02/Ar)saturation-1] x 100% reflects the net biological oxygen production or consumption
[Hendricks et al. 2004, Kaiser et al. 2005]. In particular, the "measured" Ar is actually derived from the
measured 02 and 02/Ar. NCP is an areal rate (mol 02 m-2 d-') and ps, is the in situ density of seawater. k0 2 is the gas transfer coefficient (m d-') calculated from 6 h NCEP/NCAR Reanalysis winds [Kalnay et al.
1996] for the cruise track from March to May 2013 using the gas exchange parameterization of Stanley et
al. [2009] and the 60 day weighting scheme of Reuer et al. [2007]. The relationship between windspeed
and gas exchange is constrained to - 15-20% [Stanley et al. 2009, Ho et al. 2011, Wanninkhofet al. 2014], and is in general the largest source of error in resulting NCP rates.
The triple isotope composition of dissolved oxygen is related to photosynthetic oxygen production and is largely independent of respiration. Juranek and Quay [2013] discuss the theory, advantages, and
limitations of this method in detail. Measured stable oxygen isotope ratios (180/170/160 ) can be used to define the triple oxygen isotope tracer 17 in order to conceptualize the relative contribution of
photosynthetic oxygen to different water samples, with greater values indicating increased rates of production relative to gas exchange with the atmosphere. In this work we use the definition
17
A=(ln[(
170/160)mneasured/(17
0/160)ai]-kln[(180/160)measure/(
80/160)air])x 106 per meg [Angert et al. 2003] relative to an atmospheric oxygen standard, where k=0.518 is the ratio of the mass dependent isotope enrichment factors for 170/160 and 180/160. Gross primary production (mmol 02 m-2
d-) is calculated for the surface mixed layer in terms of a balance between gas exchange and production using the oxygen
isotope ratios and
k.
If the measured 170/160 and 180/160 ratios are notated as 17X and 18X:where 'XP is the photosynthetic production ratio and 'Xsat the saturated equilibrium ratio for each isotope (Table Si; this and all other supplementary tables are available electronically as described in the data availability statement). Alternate choices for 'Xp and 'Xsat and , may be appropriate under some
circumstances [Kaiser 2011, Nicholson 2011, Kaiser and Abe 2012]. The above equation is identical to Equation S8 in the Supplemental Information of Prokopenko et al. [2011], and neglects fractionation effects during gas exchange and bubble fluxes [Kaiser 2011].
Nicholson et al. [2014] suggest including corrections to Equation 2 to account for seasonal entrainment
and mixing across the base of the thermocline (e.g. left side of Eq. 2 becomes z(a/t)(0 2 "A) Psw - CGPp).
These corrections are expressed as the tracer difference from an appropriate point measured below the mixed layer multiplied by the entrainment az/at (only when the mixed layer deepens) and mixing rate Kz/(zd-z), where K, is the vertical diffusivity coefficient (M2 d-1) across the thermocline at Zd, the depth of
the sub-mixed layer sample. We apply the same approach to calculating NCP from 02 and Ar.
Simplifying the expressions of Nicholson et al. [2014] in terms of measured variables (see supplemental text for derivation), in the case where az/&t>o, we obtain corrections CNCP and CGPP for Equations I and 2:
az Kz
)
2 [Ozd-O2 Ard-Ar(3)
CNCP - (Zd-Z) (02 sat[ 02 sat Ar sat D
Ps(
CGPP
=
(a + KZ )) 02d - 1] -A [, - P(4)where the d subscript refers to measurements below the base of the mixed layer (~20 m below the bottom of the mixed layer). Entrainment is estimated from the Monthly Isopycnal and Mixed-layer Ocean Climatology [Schmidko et al. 2013] based on Argo profiler data, and Dz/t is set to zero for a shoaling mixed layer. Kz is estimated to have a lower bound of 1.Oxl 0' m2
s-' (8.6x 10- m2 d-') across the bottom of the mixed layer based on direct measurements along a similar transect at the same time of year
[Mourino-Carballido et al. 2011]. The time rate of change terms generally cannot be evaluated using the
discrete gas samples, so steady-state is assumed and Equations I and 2 are solved for NCP and GPP as:
NCP = k0 202 sat [A02 Psw - CNCP (5)
GPP = kozo2 sat (
1 7
Xsat X 18 -
PXsat
Psw - CGPP]l - 18 18X (6)The potential role of upwelling and surface divergence is not accounted for in this formulation. To calculate NCP and GPP for sample locations without depth profiles, sub-mixed layer values of A02/Ar
(and thus Ar/Arsat), '7
A, and 17X (see section 2.2.4) were approximated using weighted-mean averaging from adjacent casts. Oxygen profiles at the sample locations were additionally used to constrain likely subsurface values of A02/Ar. Five locations (noted in Figure 3) are separated from the nearest depth
profiles by more than 2' latitude, and interpolating sub-mixed layer A02/Ar for entrainment and mixing
corrections introduces additional uncertainty in the rate of NCP; the dynamic range of the corrections immediately below the mixed layer is five times greater for A02/Ar relative to its uncertainty than for
17
A.
We address probable systematic biases introduced in the gas mass balances for NCP and GPP in the supplemental text. These include lateral advection [Peterson and Stramma 1991, Lumpkin and Garzoli 2005, Brandt et al. 2006], upwelling [Helber et al. 2007, Grodsky et al. 2008, Rhein et al. 2010, Kadko
and Johns 2011], and greater vertical diffusivity [Carr et al. 1992, Wunsch and Ferarri 2004, Haskell et al. 2015]. Most assumptions above are reasonable for this dataset. However, diel cycles of the gas tracers [Sarma et al. 2006, Ferr6n et al. 2015, Nicholson et al. 2015] can lead to large errors in steady-state
production rates as calculated above (as high as 50%) if samples are taken during daily periods of peak tracer accumulation and deficit [Hamme et al. 2012]. While this is not a major bias in this dataset (see