A Disposable, Self-Administered Electrolyte Test
by
Ryan Prince
Submitted to the Department of Electrical Engineering and
Computer Science in partial fulfillment of the requirements for
the degree of
Master of Engineering in Electrical Engineering
at the
MASSACHUSETTS INSTITUTE OF TECHNOLOGY
February 2003
Copyright @2003 J. Ryan Prince. All rights reserved
The author hereby grants to MIT permission to reproduce and to distribute publicly paper and electronic copies of this thesis document in whole or in part.
Author
Department of Electrical Engineering and Computer Science
Certified by
__Joel Voldman
Assistant Professor
Thesis Supervisor
Certified by
John Williams
C. S. Draper Laboratory
Thesis-Supervisor
Accepted by
Arthur C. Smith
Chairman, Department Committee on Graduate Students
MASSACHUSETTS NsT TUTE OF TECHNOLOGY
A Disposable, Self-Administered Electrolyte Test
by
Ryan Prince
Submitted to the Department of Electrical Engineering and Computer Science on February 4, 2003 in partial fulfillment of the requirements for the degree of
Master of Engineering in Electrical Engineering
Abstract
This thesis demonstrates the novel concept that it is possible to make a disposable, self-administered electrolyte test to be introduced to the general consumer market.
Although ion specific electrodes have been used to perform point of care electrolyte tests in supervised health care environments since 1992, there has never been a personalized self-administered test available in a supermarket or convenience store. This thesis lays out a novel approach to adapting ion specific electrode technology to produce such a test. The suitability and method of integration of miniature ion-specific electrode technology
has been analyzed and shown to be viable for such a purpose. A microelectronic chip has been specifically designed to interface to the sensor, perform the necessary calibration
and decision making, and indicate the results to the user. It has been determined that the sensor, the electronics, and the supporting structures will be small and inexpensive enough to be included on a commercial sport drink bottle. The blueprints for this
extension, including the selection and integration of a suitable power source, and method of result indication have been specified and shown to support this thesis.
Thesis Supervisor: John Williams
Title: Principal Member Technical Staff, Draper Laboratory
Thesis Supervisor: Joel Voldman
Acknowledgements
This thesis was prepared at The Charles Stark Drpaer Laboratory, Inc., under Internal Company Sponsored Research Project 5047, Sensors for Blood Electrolytes.
Publication of this thesis does not constitute approval by Draper or the sponsoring agency of the findings or conclusions contained herein. It is published for the exchange and stimulation of ideas.
J. Ryan Prince
I've been extremely fortunate to have the people and the opportunities that have been placed in my path. I'm extremely grateful for being on the receiving end of an MIT education as well as the opportunity to do my research at C.S. Draper Laboratory.
Of specific importance to the success of this project are John Williams, who
consistently has brilliant ideas including this one, and Andy Dineen, who not only made the chemistry work but also helped me to understand it. I'd also like to thank my advisor, Joel Voldman, for his guidance throughout this project and Henry Raczkowski for
sharing the fun as well as the occasional frustration.
John and Andy have become the most recent additions to the short list of people I have considered mentors during my time at MIT. I am the engineer and the person that I am today due to people like them and Steve Bums, who taught me more about
engineering than any ten of my classes, Bob Brown, who has always believed in me and is responsible for my initial introduction to Draper, and Judy Froias and others like her, who were instrumental in the path my life has taken.
Finally, a special thanks to my daughter, Dana, for making me appreciate the simple things, and to the rest of my family for helping me take care of the simple things when I've been otherwise occupied.
Contents
1. INTRO DUCTION... 13
1.1 The Importance of the Sodium Electrolyte to the Human Body...15
1.2 Current Technology... 18
1.3 Contribution of Thesis... 20
1.4 References...22
2. DEVELOPMENT OF ION SPECIFIC ELECTRODE (ISE) SEN SORS ... 25
2.1 The Nernst Equation... 26
2.2 Reference Electrodes... 29
2.3 Ionophores...32
2.3.1 Effect of Total Ionic Strength... 33
2.3.2 Selectivity... 35
2.4 Experimental Performance of the Chosen lonophores... 37
2.4.1 The Reference lonophore... 38
2.4.1.1 M ulti-ISE Reference... 38
2.4.1.2 ISE Specific Reference... 40
2.4.2 The Sodium Ionophore... 41
2.4.2.1 Amino Silane as an Adhesion Promoter... 42
2.4.2.2 Importance of High Input Impedance Measurement... 43
2.5 M iniaturization of ISE Technology... 47
2.6 References...50
3. MICRO-ELECTRONIC MEASUREMENT SYSTEM...53
3.1 Low Voltage, Rail-to-Rail, CMOS Operational Amplifier... 53
3.2 Track and Hold Circuit Block... 63
3.3 Com parator Block... 67
3.4 Final Design of M icro-Fabricated Chip... 75
3.5 References...79
4. INTEGRATION OF TECHNOLOGY TO PRODUCE D ISPO SA BLE TEST ... 81
4.1 Battery ... 81
4.2 Indicator ... 84
4.3 Cost of the System ... 88
4.4 References ... 89
List of Figures
Figure 1.1 Electrolyte test incorporated on sport drink label...13
Figure 1.2 Possible design of disposable electrolyte test...14
Figure 2.0 The Clinical Electrolyte Test Procedure...25
Figure 2.1.1 Nernst equilibrium potential...27
Figure 2.2.1 The development of a potential across an ionophore layer...30
Figure 2.3.0 Chemical Structure of Ionophores...33
Figure 2.3.1 Activity Coefficients of some common ions...34
Figure 2.4.0: Wire electrodes used to test ionophores...38
Figure 2.4.1.1 Performance of Reference Ionophore...40
Figure 2.4.1.2 Sodium Specific Reference...41
Figure 2.4.2.2 Demonstration of the importance of high impedance measurement..44
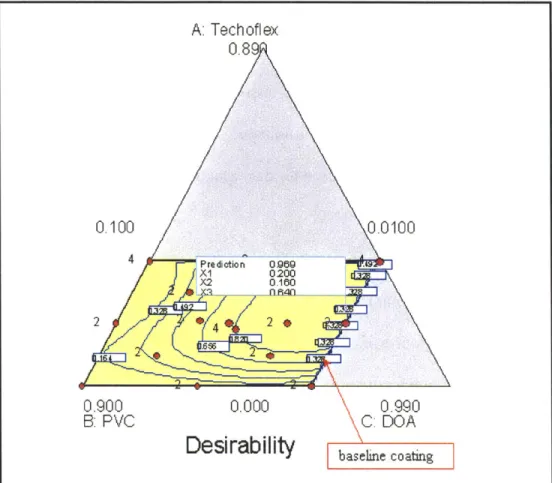
Figure 2.4.2.3 Desirability matrix from Design-of-Mixture experiment...46
Figure 2.4.2.4 Performance of the Sodium Ionophore...46
Figure 2.5.1 Mask Set (Single Seven-Electrode Sensor)...47
Figure 2.5.2: Cross Section of Micro-Fabricated Electrolyte Sensor...48
Figure 2.5.3 Mask Set (Single Two-Electrode Sensor)...48
Figure 3.0 Block Diagram of Transistor Level Circuit ... 54
Figure 3.1.1 Offset Variation of Similar Sodium ISEs...55
Figure 3.1.2 Schematic of Low-Voltage, Rail-to-Rail, CMOS Op Amp...56
Figure 3.1.3 PMOS Current Mirror with Multiplicity = 4...58
Figure 3.1.4 Layout Using Matrix With Common Centroid...58
Figure 3.1.5 Layout of Operational Amplifier...59
Figure 3.1.6 DC Response of OpAmp...60
Figure 3.1.7 Bandwidth of the Op Amp...61
Figure 3.1.8 Noise Analysis of OpAmp...62
Figure 3.1.9 Layout of the Input Amplifier Block...63
Figure 3.2.1 Track and Hold Schematic Block...64
Figure 3.2.2 Five Minute Simulated Performance of Track-and-Hold Circuit...66
Figure 3.2.3 Layout of Track and Hold Circuit Block...67
Figure 3.2.4 Simulated Performance of Track-and-Hold Circuit...68
Figure 3.3.1 Sodium Electrode Accuracy...69
Figure 3.3.2 Adjustable Limits for Comparator...70
Figure 3.3.3 Schematic of One Comparator Block ... 71
Figure 3.3.4 Layout of One Comparator Block ... 71
Figure 3.3.5 Signal Path Through the Comparator...72
Figure 3.3.6 Layout of Two Comparators and NOR Gate...73
Figure 3.3.7 DC Response of Comparator Block ... 74
Figure 3.3.8 Transient Response of Comparator Block...74
Figure 3.4.2 Simulation of Electrolyte Test...77
Figure 3.4.3 Noise Analysis Simulation of Electrolyte Test Chip ... 77
Figure 3.4.4 Layout of Disposable Electrolyte Test Chip ... 78
Figure 4.1.1 Power Requirement During Operation...82
Figure 4.1.2 Power Paper Battery Specifications (STD-1) ... 83
Figure 4.2 The 'LOW' Output Loaded With Indicator-Equivalent ... 87
Figure 5.1 Power Paper Battery and NTera Electrochromic Ink ... 92
List of Equations
Equation 2.1.1 Equation 2.1.2 Equation 2.1.3 Equation 2.1.4 Equation 2.1.5 Equation 2.1.6 Equation 2.1.7 Equation 2.1.8 Equation 2.2.1 Equation 2.3.2 Equation 3.1.1 Equation 3.1.2 Equation 3.2.1 Equation 3.2.2 Equation 3.2.3Fick's First Law of Steady-State Diffustion...27
O hm 's Law... 28
Conductivity as a function of concentration ... 28
Einstein Relation... 28
... ... ... ... ... ... ... ... 28
... 29
Nernst Equation (differential)...29
Nernst Equation (differential, simplified)... ...29
Nernst Equation (single concentration dependance)...31
Nicolsky-Eisenman equation... ... ... 35
Resistance of copper leads... ... 61
Johnson noise... ... ... 62
Switch leakage current...64
Subthreshold MOSFET current... ... ... 64
Chapter One
Introduction
This thesis is that a disposable electrolyte test is
possible to implement and manufacture for less than 25
cents per test. The vision is that the product will be
incorporated onto the label of a commercial sport drink
bottle (right) or pediatric electrolyte supplement. The
test requires a novel sensor technology for electrolyte
analysis, and the ability to extend this sensor
technology to be small and inexpensive enough to be
used as part of a disposable test (below). The blueprint
for this extension, including a design of the necessary
Figure 1.1 Electrolyte test
microelectronics, and incorporation of indicators and a incorporated on sport drink
label. Courtesy of Bill Travis
battery is fully described in this thesis. and Pam Toomy, Draper
Laboratory Graphic Design. The sensor technology, described in detail in chapter two, is being developed with
Draper Laboratory and will soon be commercially available as a viable alternative to the
currently available point-of-care (POC) medical electrolyte tests. The sensor technology
demonstrates a novel microfabricated technique of using ion specific electrodes (ISEs)
for blood analysis.
RJ Lee, a Pennsylvania company, is developing the system integration for the
medical use of Draper's sensor technology. However, it will be shown that, by limiting
the user interface and number of options, suitable microelectronics can be designed to be
electrolyte test, the disposable test proposed by this thesis will return one of five results:
very low, low, good, high, or very high. Chapter Three describes in detail one possible
implementation for the circuitry.
Chapter Four describes the claim that a power source and three indicators (to
display the five output states) can also be incorporated while adding only pennies to the
cost of the test. The major parts of this project include the innovative sensor technology,
the incorporated microelectronics, and the demonstration that these can be combined with
a battery and an indicator to make an entire system for less than 25 cents.
The remainder of Chapter 1 will describe the motivation for developing such an
electrolyte test and the way in which ion specific electrodes work to sense electrolyte
levels.
Figure 1.2 Possible design of disposable electrolyte test. Courtesy of Bill Travis and Pam Toomy, Draper Laboratory Graphic Design
The Importance of the Sodium Electrolyte to the Human Body
Sodium ion (Nat) is present in human saliva in a concentration of 140 to 148 mMol, which is isotonic with extracellular fluid. The sodium ion is at a higher
concentration than any other ion, only chloride ion (Cl) is close at a concentration of 100 to 108 mMol and potassium (Kt) and calcium (Ca'+) ions are at much lower
concentrations, about 4 and I mMol respectively (1 p240).
Intracellular fluid, however, has very different concentrations of these ions because of active pumps in the cell membrane. For example, the Nat Kt ATPase pump
actively transfers 3 sodium ions out of the cell while pumping into the cell a pair of potassium ions (2 p5). The difference in concentrations of the ions sets up a precise potential difference across the cell membrane. This potential difference is a necessary condition for a nerve cell to send an action potential (2 p31). It is also essential for cell metabolic processes, such as the passage of various nutrients across the cell membrane (1
p409, 2 p653).
Besides the nervous system and individual cell metabolism, sodium (which is the electrolyte screened for by the proposed disposable test), is a key factor in many of the body's processes. Renal function (1 p448), vision (2 p140), cardiac operation (2 p362),
pH balance (2 p763-776), and even olfactory sensation (1 p464) are directly influenced by the sodium ion. Because sodium concentrations are so important to the body, it will
regulate sodium concentration by adjusting the amount absorbed by the intestines or excreted by the kidneys. The hormones aldosterone, angiotensin II, and antidiuretic hormone are critical to this regulatory process, which responds slowly (minutes to hours)
to changes in sodium concentration (2 p951, 710-712). However, the intestines cannot absorb more sodium than is taken in by eating or drinking and the kidneys cannot excrete negative values.
If, during strenuous exercise, one replaces water without replacing salt, that
person's extracellular fluid may become less concentrated. In attempt to maintain the desired extracellular concentration of sodium, water will leave the extracellular fluid and enter the cells, which can then swell considerably. If, on the other hand, water is lost in greater proportion than salt, the extracellular fluid can become more concentrated. If this is the case, water will leave the cells to dilute the extracellular sodium, leaving the cells shriveled. Fluctuations of intracellular water content can damage cells and can be especially harmful to brain cells (3). Fluctuations of extracellular water directly affects blood pressure, which in turn affects almost every other process in the body.
Lower than normal sodium levels (hyponatremia) can be caused by excessive sweating, diarrhea, vomiting, or the use of diuretics. Symptoms include nausea, headache and cramps, swelling of the extremities, confusion and slurred speech. Hyponatremia can lead to seizure, coma or death (4, 5). Loss of sodium during a
workout is the primary reason why commercial sport drinks exist. Drinks like Gatorade and Powerade advertise that water alone is not sufficient as fluid replacement during a workout (4, 6). Of equal or greater importance is that children are especially susceptible to the loss of electrolytes due to flu or other illness. Pediatric electrolyte replacement is recommended by more pediatricians than any other treatment for fluid loss due to diarrhea and vomiting. And there are products available (i.e. Pedialyte and PTS Labs'
Another purpose of these products is to encourage fluid replacement, not just
electrolytes. They are flavored and therefore many people prefer the taste to plain water. An otherwise healthy person can experience greater than normal sodium levels
(hypernatremia) during dehydration, which can also occur during a workout or as a result
of vomiting and diarrhea (5). Some symptoms of mild dehydration include nausea,
weakness, dizziness, headaches and cramps. More severe dehydration can lead to a weak pulse, rapid breathing and disorientation. The body's ability to sweat is diminished due to unavailable fluid. Because sweating is the body's primary cooling mechanism, a
dehydrated person can easily overheat. Overheating can cause a range of conditions from heat cramps to exhaustion to stroke. Untreated, dehydration can be fatal (4).
Korey Stringer, a National Football League player died of heatstroke on July 30,
2001 (8). In September 2001, Craig Lobrano, an all-state football player in Virginia collapsed from heatstroke during practice and died two days later (9). One hundred
football players have died of heatstroke since 1960, according to the National Center for Catastrophic Sport Injury Research, whose report included an entire section on heat stroke and some very strong wording:
The 2001 data show three cases of heat stroke death. There is no excuse for any number of heat stroke deaths since they are all preventable with the proper precautions. In the past seven years 20 young football players have died from heat stroke. Every effort should be made to continuously educate coaches concerning the proper procedures and precautions when practicing or playing in the heat. (10)
Both hyponatremia and hypernatremia can be tested for by the proposed
disposable test. It is also important to note that a means of distribution, i.e. the labels of
sport drinks or pediatric electrolyte replacement products, is already in place with a
1.2 Current Technology
There are many methods of determining ionic concentration of a solution, including spectroscopy, chomatography, calorimetry, optical fluorescence, and
potentiometric titration (11). These techniques require large laboratory equipment and are therefore not portable. Currently, most hospital electrolyte tests are performed in a large multiple-analyte analyzer in a chemistry lab. These tests require drawn blood and results could take hours from the time a test is ordered to the time the caregiver receives the results. Recently, however, ion specific electrode technology has made point of care
(POC) electrolyte testing possible (12).
Of the nine POC electrolyte analyzers identified as 'competitive' by RJ Lee
Microsystems, seven use either disposable or reusable ion-specific electrodes. The
i-STAT system, made by Abbott Laboratories, is the leading technology in this area. The
test requires a cartridge that is inserted into the analyzer. A blood sample must be drawn and inserted into the cartridge, which is good for a single use. There are 13 different disposable cartridges depending on the particular array of tests that the caregiver orders. Each cartridge costs $2.70 and the analyzer unit costs $9000 (12).
Each i-STAT cartridge contains micro-fabricated ion-specific electrodes, and a calibration fluid pouch along with plastic structures for directing fluid flow and storing waste. The fluid pouch, containing known concentrations of the analytes, is punctured at the onset of a test and the calibration fluid passes over the sensors allowing a one-point calibration. The fluid is then flushed into the waste container and the blood sample is pushed in for testing (13). The accuracy of the i-STAT test for sodium, as reported by two separate independent studies, is within 1.5mmol/L (14) or, equivalently, about 0.89
percent (15). This exceeds the accuracy requirements of the FDA, which are 4mmol/L or
2.8 percent (12).
The team at Draper Laboratory has developed a miniature point-of-care electrolyte test that will be used in clinical settings. The test is an improvement on
i-STAT test in that it does not require blood to be drawn; only a finger prick. Another
improvement over i-STAT is the reduced cost due to the reusable nature. Instead of a disposable cartridge with intricate internal structures to perform the calibration process, Draper's system incorporates everything except the sensor itself into the analyzing unit.
All of the fluid channels, waste disposal, and storage of extra calibration fluid are
integrated and therefore reusable. Although i-STAT makes no claims about the
reusability of their sensors, it is very possible that the sensors themselves are useful for more than a single test, but the cartridge system makes it impossible.
About once each day, a new sensor head will be plugged in to the electronic analyzer system that will interpret the sensor outputs and convert them to values of concentration of the electrolytes in the blood. The initial sensor development
incorporates electrodes specialized for sodium, potassium, chloride, and calcium on a single sensor head. Current research, however, will be expanding the test to include such things as blood gasses, lithium, and heavy metals. The combination of sensor heads will all be compatible with the same electronic system.
Micralyne, a Canadian company, is fabricating the sensor itself for $600 per 4-inch wafer. The current layout, which includes seven electrodes on each sensor, allows for 250 sensors per wafer, which amounts to $2.40 per sensor. Because they are reusable, the cost per test is at least an order of magnitude less than i-STAT. Reducing the chip
size by including only two electrodes instead of seven can further reduce this cost for the
disposable version. This miniaturization is discussed in section 2.5.
The replaceable part of Draper's electrolyte test system is the micro-fabricated
sensor. It is only this sensor that is of interest in answering the question of whether a self-administered, disposable electrolyte test is possible. The intricate plastic channels of
the cartridge would be too bulky and expensive for this purpose. The specifications and
fabrication procedure of this sensor are the subject of chapter 2.
1.3 Contribution of Thesis
This thesis contends that it is possible to mass-produce a disposable,
self-administered electrolyte test for less than 25 cents per test. In order for this to be
possible, a novel manufacturing process for electrolyte-sensing ISEs has been developed.
The way in which the micro-ISEs can be integrated for marketing to the general public by
designing a CMOS chip, and integrating a silk-screened paper battery, and
electrochromic ink is described by this thesis.
The test should be able to distinguish concentration ranges of about 4 mmol/L of
sodium. It must be capable of a one-point calibration. The means of displaying the result
should be durable and clear to the user. The power source must be easily incorporated
into the test without prohibiting the test from being flexible and conformable. The shelf life should be in the same range as that of a bottle of sport drink, about 1 to 2 years.
The limiting factor for power consumption, chip size, number of output states,
and every other aspect of this test is the cost. For example, once the most inexpensive
15 mA hours. The sensitivity requirement was set by the standard of accuracy that the FDA requires of a medical electrolyte test.
The clinical use of ISEs to measure electrolyte levels in hospitals and other medical care centers began in 1992 (12). However, there has never been a personal, self-administered electrolyte test available in a supermarket or convenience store. There may be a trend toward inexpensive, "do-it-yourself" tests, apparent in Duracell's
thermochromic battery tester included in many battery packages, Guardian Angel's blood alcohol content test available for under a dollar at some drug stores. Even home
pregnancy tests and personal glucose monitoring systems represent a more expensive version of self-administered medical screening. A similar test for electrolytes would not be intended to give medically certain results, but rather to screen oneself or one's child so that proper action might be taken before medical attention becomes necessary.
Although all indications are that the results would theoretically be medically certain, a claim of such would require intense FDA scrutiny and approval. Such a claim might also require liability insurance, which would inflate the cost of the test. The label on the test might instruct the user not to eat, drink, or smoke for two minutes prior to testing, but there is no assurance, without the presence of medical guidance, that
directions will be followed. If this particular direction were not followed the test would be affected by the concentration of sodium in the food or beverage since the bodily fluid being tested is saliva.
The disposable test will indicate a range rather than an actual concentration. It will incorporate the sensor technology of the clinical version being developed at Draper Laboratory, with a simple calibration method and an easy to read display of
electrochromic ink (color change due to electric potential) to indicate results. Some
circuitry will be incorporated in order to read the potentiometric output of the sensors,
determine the concentration range and control the appropriate indicators.
The normal human concentration range of sodium is from 140 to 148 mMol/L
(12). The three indicators are configured to have five states corresponding to serum
sodium concentration as follows:
" Very High (top indicator), greater than 152 mMol Na+
" High (top and middle indicators), 148 mMol to 152 mMol Na+
- Good (middle indicator), 140 mMol to 148 mMol Na+
- Low (middle and bottom indicators), 136 mMol to 140mMol Na+ - Very Low (bottom indicator), less than 136 mMol Na+
The test will only take a few seconds and will not require a doctor visit, a
prescription, or more than a few cents. People can begin to monitor themselves or their
children using a product such as this and, hopefully, become more aware of their health
before a serious condition, such as severe dehydration or heat stoke, occurs.
1.4 References
1. Nelson, David L., Cox, Michael M., Lehninger Principles of Biochemistry: Third Edition, New York: Worth Publishers, 2000.
2. Berne, Robert M., Levy, Matthew N., Physiology: Fourth Edition, Boston: Mosby, Inc., 1998.
3. Harkness, Richard, "Take in Water, Sodium During Activity," The Sun Herald, Section: Lifestyle, July 20, 2002.
4. Huget, Jennifer, "Dehydration," The Washington Post, Section: Health, pF02, July 30, 2002.
5. Lee, Rozel A., "Getting Serious About Hydration," The Tampa Tribune, Section:
Brandon, Pg 11, August 15, 2002.
6. ACNielsen, "High Performance in the Sports Drinks Category," Business and
Industry, Gale Group, Inc., vII, n10, p44, October 15, 2002.
7. " PTS Labs Enters Licensing Agreement With Nickelodeon's 'Blue's Clues' on
Oral Electrolyte Product Line," PR Newswire Association, Inc. Section: Financial News, July 26, 2002.
8. Clarke, Liz, "Shock and Sadness; Stringer's Death from Heatstroke Leaves
Redskins Numb." The Washington Post, Section: Sports, pDOl, August 2, 2001.
9. O'Reilly, Kevin B., "For Athletes, Heat and Heavy Pads can be Deadly",
Chattanooga Times, Section: Lifestyle, pDl, July 15, 2002.
10. Mueller, Frederick 0., Director, "Annual Survey of Football Injury Research:
2001" National Center for Catastrophic Sport Injury Research. Available online at: http://www.unc.edu/depts/nccsi/SurveyofFootballInjuries.htm
11. Willard, Hobart H., Merritt, Lynne L. Jr., Instrumental Methods of Analysis. New
York: Littleton Educational Publishing, Inc., 1981.
12. Crawford, David, Marketing Analysis, RJ Lee Microsystems, personal communication.
13. i-STAT company website. http://www.istat.conproducts/docs/biosenso.pdf 14. Jacobs, Vadasdi, Sarkozi, and Colman, "Analytical evaluation of i-STAT Portable Clinical Analyzer and use by nonlaboratory health-care professionals," Clinical
Chemistry v39: 1993 p1069-1074.
15. Erickson, K.A., Wilding, P., "Evaluation of a novel point-of-care system, the i-STAT portable clinical analyzer," Clinical Chemistry v39: 1993 p2 8 3-2 8 7.
Chapter 2.
Development of Ion Specific Electrode (ISE) Sensors
There is ongoing work at Draper Laboratory to develop miniature ion-specific
electrodes to be used as part of a medical electrolyte test. This sensor, without its
supporting analyzer system can be adapted to become part of the disposable test.
The sensor being developed is especially suited for the design of a disposable test
because of its size and the fact that the interchangeable sensor head is independent from
the supporting structures such as calibration and waste disposal fluid chambers. The
sensor being developed at Draper Laboratory will be the first point of care electrolyte
test that does not require drawn blood. The only blood required will be extracted by a
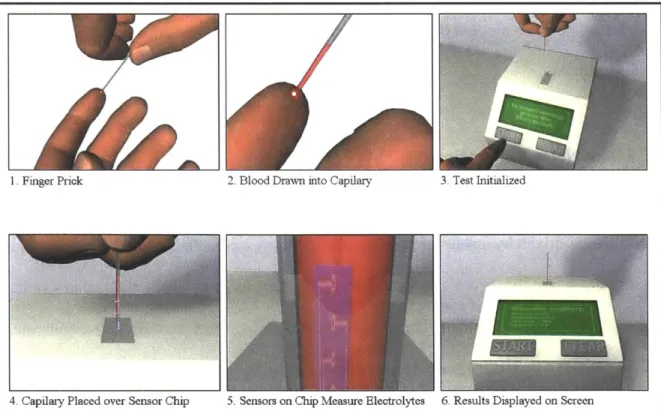
finger prick as shown in figure 2.0.
1. Finger Prick 2. Blood Drawn into Capilary 3. Test Initialized
4. Capilary Placed over Sensor Chip 5. Sensors on Chip Measure Electrolytes 6. Results Displayed on Screen
Figure 2.0 The Clinical Electrolyte Test Procedure (freeze-frames from an animation produced by Bill Travis and Pam Toomy, Draper Laboratory Graphics Design).
The current technology includes electrodes for sodium, potassium, chloride, and
calcium. Although currently there are four ionophores included in the design, this
number will soon be expanded to include sensors for oxygen, carbon dioxide, pH, and
eventually a variety of other things like lithium and heavy metals. There has been an
initial fabrication run resulting in preliminary sensor chips. These chips have been used
to demonstrate the viability of the sensor as it relates to the disposable test. The data
acquired during the feasibility testing is presented in this chapter.
A separate mask set is all that is required to change the seven-electrode sensor
chip into a two-electrode sensor chip The sensor is currently a small chip (0.1 by 0.05
inches) designed to have seven ion specific electrodes with electrical connections to each.
The electrodes required for the proposed disposable test will be one for sodium and one
reference. A sodium ion specific electrode will develop a potential that is proportional to
the log of the concentration of sodium. This potential is described according to the
Nernst equation.
2.1 The Nernst Equation
Ions can be transported by a number of processes including diffusion and drift.
Diffusion is driven by a concentration gradient, drift by a potential gradient. Ion
transport can also be driven by other sources of energy, for example thermal conduction,
or an active ion pump utilizing chemical energy to transport ions across a cell membrane.
Take the case of a semi-permeable membrane, the mechanism by which ion specific
(figure 2.1.1). The initial condition is that compartment A is filled with de-ionized water
and compartment B with a NaCl solution.
Membrane Permeable OIly To Na initial condition
000000
A
c o concentration gradient Membrane Permeable Oily To Na equilibriumB
A
O Na 4 Cl-, concentration gradient potential gradient Figure 2.1.1 A semi-permeable membrane sets up a Nernst equilibrium potentialBecause there is a concentration gradient across the membrane, sodium ions will
move from compartment B to compartment A based according to Fick's first law of
steady-state diffusion (1 vi p296). Equation 2.1.1 is Fick's first law in one dimension,
which says that the flux density in the x direction is equal to the negative concentration
gradient in the x direction times the diffusivity constant for the given species.
Jx = -D d[c] Equation 2.1.1
dx
Jx ion flux density (molecules / cm2 sec)
D diffusivity constant (cm2! sec)
[c] concentration (molecules / cm3)
However, only sodium ions will diffuse across the membrane because it is impermeable
to chloride. The result will be a net positive charge on the left and a net negative charge
on the right -- a potential gradient. The sodium ions will want to move from
*
0
*
0.
0
00
0
*0
0
0
00..
B
compartment A to compartment B according to Ohm's law (2 p58), which relates flux to
the negative gradient of potential by the conductivity of the solution.
Jx = a dM_ Equation 2.1.2
dx
a electrical conductivity (molecules / V cm sec)
W electric potential (V)
At equilibrium, there is no net flux of ions, so the sum of the two expressions above must
equal zero. Before solving, substitutions must first be made for the conductivity constant
and the diffusivity constant. Conductivity is expressed as a function of concentration (1
vI p448).
a = p z [c] Equation 2.1.3
p ion mobility (cm2 / V sec)
z valence charge (for sodium ion, z = +1) And the Einstein Relation, (2 p44)
k R T q F Making the D kT RT -g q F Boltzmann's constant (1.38x10⁻² 3 J / K)
Universal gas constant (8.314 J / K mol) Absolute Temperature (K)
charge of an electron (1.6x 10 C)
Faraday's constant (96,485 C/ mol)
appropriate substitutions for the equilibrium case:
d RTp d[c]
dx F dx
Equation 2.1.4
Equation 2.1.5
dy RT 1 d[c]
dx zF [c] dx Equation 2.1.6
The definite integral is then taken from compartment B to compartment A and the result is the Nernst Equation.
A- RB=- TIn [c]A Equation 2.1.7
zF [C]B
If the membrane is permeable to more than one ion, their contributions will be additive. The conversion from natural log to a logarithm of base ten can be combined with the numeric values of the constants at room temperature (298 K), to give the following form of the Nernst equation:
TA - TB = -59 mV [c]A Equation 2.1.8
z [c]B
2.2
Reference Electrodes
The Nernst Equation as written in equations 2.1.7 and 2.1.8 describes a potential difference between two compartments. The spatial integral that was taken to get the equation in the final form was a definite integral from side A to side B.
Whenever one describes an electric potential, the value is meaningless without a reference to compare it to. Therefore, while an ion specific electrode measures the potential in the compartment that contains (ideally) only the ion of interest, a reference electrode must measure the potential outside Another difference between an ion specific electrode and the simplified scenario described in section 2.1 is that the membrane has a
non-zero thickness. The
ionophore is the membrane and it
covers a Ag/AgCl electrode, not a
liquid bath. Therefore, the
concentration of the positive ion
in compartment A (the metal) is
zero and there is a gradient across
the membrane (figure 2.2.1). On
the liquid side of the membrane
there will be an excess of negative
ions to balance the positive charge
inside. -, 0 0. U. C C-charge densitv Liquid CBa <: +ions in ionolphore ons in liquid to balance charge ,A
E
x) JP(x) electric fieldThe figure shows,
qualitatively, the charge density,
electric field, and resulting T )= - Ex
potential AT
potential as functions of space.
The figure is based on Howe and Figure 2.2.1 The development of a potential across a
Sodii'sdisussin o PNsemipermeable ionophore layer
Sodini's discussion of PN
junctions in semiconductors (2 p 117). Although the medium is different the same
underlying mechanism of a potential resulting from the equilibrium between drift and
diffusion applies.
The concentration at the interface between ionophore and metal depends only on
[c]A term in equation 2.1.8 is a constant (the standard potential of the electrode) and can
be incorporated into the offset of the reference, T'B. Canceling the negative signs, the Nernst Equation becomes:
59mV
TA -T'IB = log[C]B Equation 2.2.1
The figure shows the potential on side B equal to zero, which is an arbitrary assignment. What is important is that AT is proportional to the log of the concentration of the relevant ion on side B. The slope is 59 mV per decade.
A good reference electrode will record the same potential regardless of
concentration. Any ionophore coating that is more permeable to some ions than others will set up a potential based on concentration like that in figure 2.2.1 and, therefore, not behave like a good reference. An ionophore coating that is not permeable to any ions would also be unacceptable because it would be completely electrically isolated so its potential could float unpredictably. An Ag/AgCI electrode with no coating at all will be sensitive to changes in chloride concentration. The chloride ion in the silver chloride layer will develop an equilibrium concentration depending on the concentration of the chloride ion in solution based on the opposing forces of diffusion and drift (3 p334). A potential will therefore be developed in the same way as described above for ionophores.
A silver wire without the AgCl layer will slowly oxidize in a salt solution resulting in an
inconsistent potential reading.
A good reference coating must be electrically conducting while not favoring the
conduction of any particular ion. This has been the most significant hurdle in the miniaturization of ISEs (4, 5, 10). Traditionally, large-scale reference electrodes utilize
at least one liquid junction. The inner chamber, close to the electrode, contains a
saturated solution, usually potassium chloride to achieve similar positive and negative
conductance. Because the concentration is easily kept at the saturated value, the
reference will record a constant potential.
The junction between the saturated solution and the test solution, sealed with a
porous ceramic frit, is electrically conductive but allows only very slow passage of the
internal filling solution. The inner solution can be easily maintained at saturation by
periodically adding potassium chloride. Some of the KCl will leak into the test solution
so for long term or very sensitive measurements a second liquid junction is often used.
An intermediate chamber of de-ionized water will be the recipient of the KCl
contamination and that chamber can be periodically flushed to prevent contamination of
the test solution.
Dry reference electrodes have been developed generally using one of two
techniques. One technique is to mix an ionophore coating that is equally conductive to
all relevant ions for a given application (4). Another technique requires a separate
ion-specific references, coated with a gel that is highly saturated with the ion of interest (5).
Both of the techniques for creating a dry reference electrode have been investigated using
the preliminary sensor chips. The results are in section 2.4.
2.3 lonophores
Man made membranes can be constructed in such a way to selectively allow some
ions to diffuse while blocking others. The membranes function in much the same way as
to bind polar compounds based on the position of fixed polarities of the molecules in the
channel (6). The structure of the potassium ionophore and the sodium ionophore that
were used by Draper Laboratory are shown in figure 2.3.0.
00 00 HNH 0 HN Valinomycin
0N
r' ETH 2120 N,N,NX,NX-Tetracyclohexyl-1,2-phenylenedioxydiacetamide.Figure 2.3.0 Potassium lonophore (left), Sodium Ionophore (right). Courtesy of Andy Dineen, Draper Laboratory Chemist.
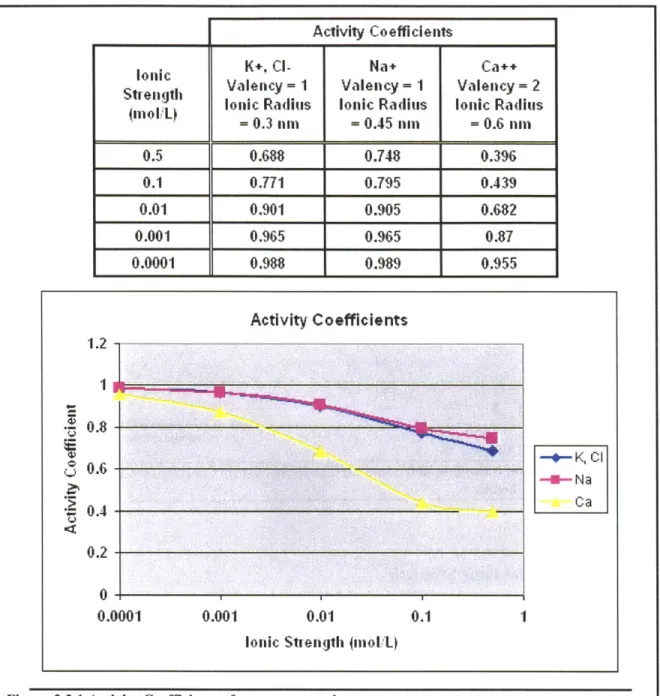
2.3.1 Effect of Total Ionic Strength
One factor that can cause deviation from the Nernst equation is the total ionic
concentration, or ionic strength, of the solution. The ions in a solution with very low
ionic strength will have very little interaction with each other. However, the more ions
present in that solution, the more likely they will be to collide and affect each other.
Therefore, only a percentage of the total number of ions will be available to affect the
sensor. This percentage is expressed in terms of an activity coefficient (11 p8.2). As
concentration increases, the percentage of the total number of ions that are unavailable to
4-Q
2
4-Activity Coefficients
1onic K+. CI- Na+ Ca++
Strenigtli Valenicy = 1 Valenicy = 1 Valency = 2
(molfL) lonic Radius lonic Radius lonic Radius
= 0.3 n
[
= 0.45 in = 0.6 1n 0.5 0.688 0.748 0.396 0.1 0.771 0.795 0.439 0.01 0.901 0.905 0.682 0.001 0.965 0.965 0.87 0.0001 0.988 0.989 0.955 Activity Coefficients 1.2 0.8 0.6 0.4 -0.2 0 I 0.0001 0.001 0.01 0.1 1lonic Streinth (mol"L)
--- K, C
- Na
Ca
Figure 2.3.1 Activity Coefficients of some common ions
For instance, a solution that is 45 mMol NaCl and 5 mMol KCl has an ionic
strength of 45 + 45 + 5 + 5 = 100 mMol. According to the chart below, at an ionic
strength of 0.1 mol/L, potassium has an activity constant of 0.771 so a potassium ISE will
observe a concentration of 5 mMol * 0.771 = 3.855 mMol. Now, if one were to add
ionic strength would be 0.5 mol/L, so according to the chart the activity coefficient would be 0.688 and the ISE would read 5mmol * 0.688 = 3.44 mMol of potassium.
2.3.2 Selectivity
Another factor that can cause deviation from the Nernst equation is the selectivity factor. Ideally the membrane would select only one ion, but the extent to which other ions can diffuse is described in the membrane's selectivity constant. If two compounds share similar characteristics, a channel designed for one may allow the other to also get through, although with less probability. Most ionophores are not completely selective to one and only one ion. The extent of this effect is described in terms of a selectivity coefficient, which can be found through experimentation (7-9).
The concentration of other ions in solution along with the respective selectivity factors for those ions needs to be considered and, if significant, adjusted for accordingly. This kind of adjustment will be included in the software package of a medical electrolyte test. However, the disposable test is simplified by the determination, as a result of the following argument, that this kind of correction is unnecessary.
The sodium ionophore that was chosen for this application has selectivity coefficient for potassium of 0.6 (8). Therefore, not only is the electrode potential affected by the concentration of sodium, but also potassium in a manor described by the Nicolsky-Eisenman equation (9).
[C]Na concentration of sodium
[c]K concentration of potassium
To constant that includes the standard potential of the electrode, and the reference electrode potential
The typical concentrations of these ions in extracellular fluid are 144 mmol and 4.4 mmol for sodium and potassium respectively. Using these numbers in equation 2.3.1, the potential on the electrode would be 127.809 mV + To instead of 127.344 mV + To, which is what it would be without the second term. Neglecting the To term for a moment, this is an error of 0.36%, which is acceptable for two reasons.
First, potassium is also an electrolyte and the goal of the test is to sense shifts in electrolyte concentration. The loss of water through dehydration leads to an overall increase in concentration in the extracellular fluid. This test is not intended to diagnose genetic abnormalities such as diabetes that lead to disproportionate concentrations of potassium with respect to sodium. This test is intended to screen for loss of water or electrolytes due to excessive sweating, overheating, dehydration, etc. All of these
conditions affect potassium in the same way as sodium. However, to anticipate the effect of non-ideal selectivity, the calibration fluid should contain ions such as potassium in the same concentration as expected in a normal human.
The second reason that selectivity is not a concern is that 0.36% is well within the 4% accuracy goal. This is because sodium is at a much higher concentration (almost two orders of magnitude) than potassium in extracellular fluid. If the situation were reversed and a potassium ionophore with the same selectivity coefficient was used, equation 2.3.2 would give an actual response of 115.53 mV + To, while the ideal answer would be only 37.96 mV + To, an error of 204.3%. Of course, both of these percentages are dependent
on the value of To, but the idea that a sodium electrode would be much more accurate than a potassium electrode without selectivity compensation has been demonstrated.
The fact that sodium is at a much higher concentration than any of the other electrolytes (the second highest concentration is chloride at about 100mmol/L), is the reason why the sodium electrode was chosen as the one ISE to include in a disposable test, as discussed in chapter one. Both the sodium and the reference electrodes used by Draper Laboratory have been evaluated to determine their viability as part of a
disposable test.
2.4 Experimental Performance of the Chosen lonophores
Preliminary testing of the coatings was conducted before the electrode chips were fabricated and then confirmed later on the chips. The chip fabrication process is
described in section 2.6. Prior to miniaturization, however, ordinary silver wire was used to make electrodes for the purpose of testing the coatings. The silver wire was cut into 3" sections and insulated with heat-shrink tubing. The tubing allowed about lcm of silver wire to be exposed at one end and was held in place with UV curable epoxy. The other end of the wire was used as the electrical connection (figure 2.4.0).
The exposed silver wire was then placed in a beaker containing a 1 M solution of KCl. The electrical connection was used to apply 0.5 volts for 5 minutes, which oxidized the surface of the exposed silver wire to AgCl making electrodes. The ionophore
material was applied by dipping the end of the electrode into the liquid ionophore and allowing it to dry. Two tip configurations, straight and looped, were used
2.4.1 The Reference lonophore
Both the multi-ISE reference and the ion-specific reference coatings perform well experimentally but have different fabrication steps. The final decision as to which reference to use should involve further investigation into the following two types,
especially the second, the formula of which was discovered in the process of carrying out these evaluative tests.
2.4.1.1 Multi-ISE Reference
The multi-ISE reference material was based in PU-40 but was doped with ion exchange material (the precise formula of which is proprietary), to maintain a constant
Aligator Clip
A g Wire
Pre-Shrunk Heat Shrink (Insulation)
UV curable epoxy
onophore ~ A g/A gC1 Ele ctro de
Looped Wire Straight Wire
potential in varying concentrations. This type of reference is especially useful if more than one electrolyte is being tested, as is the case with the medical application of the sensor.
It was difficult to cover the electrode surface with the polyurethane material. The solvent used was dimethylformamide (DMF), which is slow to dry, so applying multiple layers required about an hour between each application. Precise coating amounts were not quantified, however the electrode coatings were generally about 1mm thick. After the application of the reference material, the electrodes were placed in an oven at 55 deg C for at least 12 hours to drive off excess solvent. Even if the electrodes were origonally coated entirely, the coatings would sometimes crack, exposing the silver chloride material. There was less than 20% success rate using this methodology of application, making reproducibly an issue. Once the electrode chips were fabricated the success rate improved to about 50%
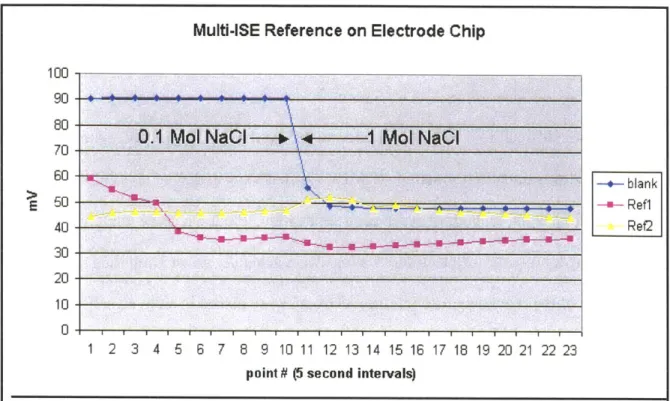
Two of the electrodes considered to be successful are shown in figure 2.4.1.1. Both of these electrodes were made on the electrode chip. The data points were taken every five seconds and the solution was changed one time from 0.1 Mol to I Mol sodium chloride. The blue data, labeled blank', represents an uncoated Ag/AgCl wire included for comparison. When the concentration is increased by a factor of ten, the blank
electrode shows a change of -42 mV (negative because the valence charge of chloride is
-1). Both of the reference electrodes, while displaying a short transient response, settle to
Multi-ISE Reference on Electrode Chip
100
90
60
0.1 Mol NaC--+
--
1 Mol NaCl
70 60 - -blank E 50 +_________ 40 Ref2 30 20 10 0 1 2 3 4 5 6 7 8 9 10 11 12 13 14 16 16 17 18 19 20 21 22 23
point # (5 second intervals)
Figure 2.4.1.1 Performance of Reference Ionophore
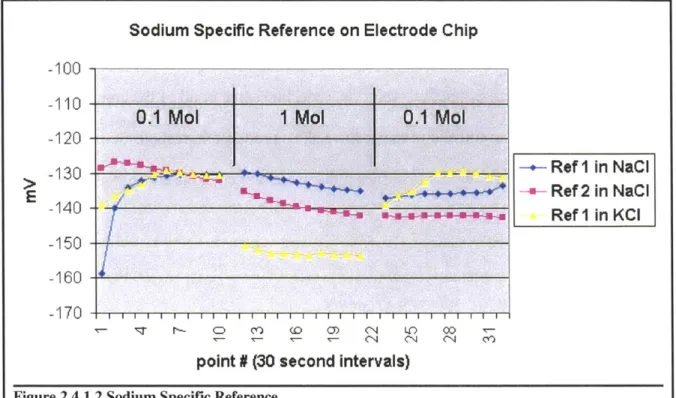
2.4.1.2 Ion Specific Reference
References specific to certain ions have been made by coating an electrode with a gel that is saturated with the ion of interest. Originally, this technique was not considered because the medical electrolyte test will measure a number of ions and providing each one with a separate reference would consume more space on the chip. The discovery of this particular sodium-specific reference was actually an accident and the formula will not be discussed here because it is proprietary.
This type of reference warrants further investigation. Because the disposable test is only testing sodium, a reference specific for sodium could be more accurate. The data that was taken (figure 2.4.1.2) shows no change in potential over an entire decade of sodium chloride, but about l5mV per decade in potassium chloride.
Sodium Specific Reference on Electrode Chip
-100 -110
0.1 Mol
1
Mol
0.1 Mol
-120 -130 -- Ref 1 in NaCi 140 +++++ * Ref 2 in NaCl -1 5 0- + = = - + R e f 1 in K C --150 --160 I~rt 1 CD CO~ (0 C)) C14 U0 ) 00
point N (30 second intervals)
Figure 2.4.1.2 Sodium Specific Reference
Also, another set of four electrodes were prepared using the same exact procedure only this time they were dipped in a poly-urethane solution that did not contain the ionophore. These electrodes also responded (about 30mV per decade) to changes in sodium chloride concentration. The stability of these reference electrodes has not yet been characterized. It should be apparent from this discussion, however, that a miniature dry reference electrode can be made and can be included on a miniature chip as part of a disposable electrolyte test.
2.4.2 The Sodium Ionophore
The matrix for the sodium ionophore is polyvinyl chloride (PVC) and the solvent is tetra-hydro-furan (THF). The procedure for making the sodium ionophore is in Appendix A. Sodium chloride was used to test the sodium ISEs. Potassium chloride and sodium carbonate were also used as controls. The changing chloride concentrations in
these solutions would have had a significant effect on any electrode that was not
completely coated with its ionophore. Any portion of Ag/AgCl exposed would respond
with a negative slope in response to chloride, canceling some or all of the anion effect
because the response would add to the positive slope produced in response to sodium.
For this reason, it was necessary to ensuring that there was no exposed Ag/AgCl on the
electrodes
2.4.2.1 Amino Silane as an Adhesion Promoter
It was found that even if an electrode was initially fully coated, after one to two
days of hydration, water would begin to penetrate through the coating and separate the
coating from the Ag/AgCl electrode. Once this occurred the ISE would become useless
because it would begin to respond to chloride. In order to minimize this effect, and also
to assist in the process of coating the wire electrodes in their entirety, some adhesion
promoters were investigated.
The silane family of adhesion promoters is designed with functional groups at
each of the two ends of a chain-like molecule. One end bonds with an OH-terminated
substrate (such as silicon or glass) and the other is chosen to bond to a polymer (12). A
variety of silanes exist with different functional groups that are suited for different
polymers. Six different silanes, including amino silane (which has an NH2 amino group),
were investigated as candidates for electrode adhesion promotion.
A 5% silane, 90% isopropanol, 5% water solution was prepared using each of the
silanes. Glass slides were immersed in the beakers containing these solutions for 2
the PVC matrix without ionophore, about 5gL each, were placed on the slides. After the slides had dried overnight the adhesion was tested by poking the drops with a beaver blade. The slides were then placed in de-ionized water for three days. Once every twelve hours, there was another round of poking.
The slide that best retained drops of PVC after the hydration was the one coated with amino silane. It adhered the drops better than the other slides. They appeared to have fewer bubbles after hydration and it was more difficult to separate the drop from the
slide with a beaver blade. Therefore, amino silane was used in the remainder of
experimentation.
2.4.2.2 Importance of High Input Impedance Measurement
The same wire electrodes that were used to test reference material were also used to test the sodium ionophore. The coated electrodes were air-dried at room temperature. Some literature about ISEs calls for the coatings to be dried in desiccators (6, 8).
However, not only was desiccation found to be unnecessary, it also tended to increase the necessary hydration time of the electrodes before they were ready to be used.
The first experimental data from the original sodium ISE formulation was
troubling. It was collected using a galvanostat and seemed to have a slope that was roughly what was expected. However, the time required for the voltage to stabilize for the first reading was about an hour and all subsequent readings stabilized within a couple minutes. These times were unsatisfactory and it was determined that the long drifting
behavior was due to the fact that some amount of current was being drawn from the electrodes. The combination of two different electrodes setting up two different
potentials separated by an electrolyte solution is a battery. When the two electrodes are
connected through external circuitry, current will want to flow from the higher potential to the lower one. Therefore, the process of measuring the voltage will actually affect it. To test this theory, a chloride electrode was tested in three different concentrations of
NaCl: 100 mMol, 144 mMol, and 200mMol. While the electrode remained in the salt
solution the measurement electronics were turned on and off. When the electronics were
turned on, one data point was taken immediately and two more were taken at 30 second
intervals (total of one minute on) before turning the electronics off. This process was
repeated starting at 1, 5, 10, and 20 minutes after the electrode was put into the salt
solution (figure 2.4.2.2).
Electrode Eolorization Drift
'p., 4
.7
/
A I I I I 0 5 10 time (min) 15 20 -+- 100 mMol -5- 144 mMol 200 mMolI 25Figure 2.4.2.2 Demonstration of the importance of high impedance measurement
It was discovered that each time the equipment was turned on; the initial point
would be in roughly the same spot. However, if it were left on, the potential would drift 85 80 75 70 E 65 60 55 50 I
highest impedance measurement equipment possible. As will be discussed in chapter 3, the electrode inputs will be the gates of mosfets for precisely that reason.. The remainder of data acquisition was done using a commercially available piece of equipment designed specifically for ion specific electrode measurement. The smartCHEM Ion3, made by
TPS, an Australian company, was chosen for data acquisition purposes because it claims
an input impedance of 3x 10¹² Q.
2.4.2.3 Design of Mixture Optimization
A series of Design-of-Mixture experiments was carried out to optimize the
performance of the sodium ionophore. The specific issues were sensitivity, ideally 59 mV/decade, and adhesion. Adhesion was quantified by measuring 'time-to-failure' with failure defined as having a negative slope. By entering the slope and time-to-failure data into a computer program designed specifically for the conduction of design of mixture experiments, a desirability matrix was returned (figure 2.4.2.3).
The ideal combination of matrix material was 20% techoflex, 16% PVC, and 64%
DOA. Using the new idealized matrix as well as amino-silane to promote ionophore
adhesion to the silver chloride achieved ideal results. Figure 2.4.2.4 shows data taken from a sodium ISE (blue) along with a line representing the ideal behavior of 60mV per decade (red) as predicted by the Nernst equation. Also in red are the limits of the normal human range. The accuracy requirement for medical purposes is +/- 4mMol, which is shown in green. The offset must be accounted for through calibration, however the slope of the data corresponds to that predicted by theory, and is well within the required
A: Techoflex 0.89 0.100 0.0100 X1 0200 X2 0.160 2 4 2 w 34 0.000
Desirability
0.990 C:DOA baseline coatingFigure 2.4.2.3: Desirability Matrix Resulting From Design-of-Mixture Experiment
Na Ion Specific Electrode
56
54 - DataPoints (NaISE)
52 Human Normal Range
(140 - 148 mMo >50 -- DesizedAccuracy (+/-4 nM o) 48 46Z 130 140 148 160 180 log Concentration NaCI Figure 2.4.2.4: Performance of the Sodium lonophore
0.900
2.5
Miniaturization of ISE Technology
The miniature ISE sensors are being fabricated on four inch silicon wafers using the processed described below. The fabrication has been contracted to Micralyne, a Canadian-based microelectromechanical (MEM) manufacturer.
The process requires three mask steps after sputtering
1000 A of chrome and then electroplating 1000 A of silver.
Figure 2.5.1 shows a one sensor section of the masks for the entire wafer.
The first mask step (red) protects all of the silver except the areas for the electrode heads. The silver is then oxidized to form 500 A of silver chloride on top of 500 A of silver. The second mask step (green) protects the areas of the electrode heads, traces, and bond pads. The silver and chrome are then etched away from the exposed area. The third mask step (black) uses photoimagable polyimide instead of
photoresist. The polyimide is removed from the electrode
Figure 2.5.1 Mask Set
heads and the bond pads and serves as an insulator over the (Single Seven-Electrode
Sensor)
rest of the chip.
The ionophores are deposited over the electrode heads and the wafer is then diced and wire bonded to a larger, easier to handle, connector. Figure 2.5.2 shows the cross section of a single chip.
The electrodes have 5 mil diameters. The traces are 2 mils wide with at least 2 mil spaces. The bond pads are 10 mils in diameter. The chip is 100 mils wide and 500 mils long. The chip can be made smaller if only two electrodes are included instead of seven.
Irounophfore Dielectric (Polylmide)
A\--Ag Seed Laytr (Cr)
Substrate (SI)
Figure 2.5.2: Cross Section of Micro-Fabricated Electrolyte Sensor
The same microfabrication process can be used to make a two-electrode chip. The result would be much smaller and therefore less expensive because there would be a higher yield per wafer. The new mask set should look like that in figure 2.5.3.
Figure 2.5.3 Mask Set (Single Two-Electrode Sensor)
The dimensions of the features are still the same but the overall chip is now only 75mils by 50mils. The larger chip is being fabricated for $600 per four inch wafer in small volumes. The dimensions dictate that about 250 chips can be fabricated per wafer. The smaller chip, however will yield about 3350 chips per wafer. In small volumes (one or two runs) each chip would cost about 18 cents. Larger volumes would lead to a lower cost.