DIGITAL TRANSPARENCY APPLIED TO INTERACTIVE MAPPING
by
Louis Weitzman
B.Arch. University of Minnesota 1974
Submitted in Partial Fulfillment of the Requirements for the
Degree of
Master of Architecture in Advanced Studies at the
MASSACHUSETTS INSTITUTE OF TECHNOLOGY May 1978
O
MIT 1978Signature of Author
if,
Department of Architecture May 12, 1978Ceritified by
Nicholas P. Negroponte, Thesis Supervisor Associate Professor of Computer Graphics Accepted by
K(J
Profe loif Architecture Julian Beinart, Chairman Departmental Committee for Graduate Students MASSACHUSETTS INSTITUTEOF TECHNOLOGYC
AUG 10 1978
LIBRARIES
MITL ibMries
Document Services
Room 14-0551 77 Massachusetts Avenue Cambridge, MA 02139 Ph: 617.253.2800 Email: [email protected] http://Iibraries.mit.edu/docsDISCLAIMER OF QUALITY
Due to the condition of the original material, there are unavoidable
flaws in this reproduction. We have made every effort possible to
provide you with the best copy available. If you are dissatisfied with
this product and find it unusable, please contact Document Services as
soon as possible.
Thank you.
The images contained in this document are of
the best quality available.
Grayscale images only. No color reproduction
available.
DIGITAL TRANSPARENCY APPLIED TO INTERACTIVE MAPPING
by
Louis Weitzman
Submitted to the Department of Architecture on May 12, 1978 in partial fulfillment of the Degree of Master of Architecture in Advanced Studies.
abstract
This report documents research in computer generated transparency at the Architecture Machine Group. As background material a brief description of the study of phenomenal
transparency is presented. Its implementa-tion on a raster scan display system is
described as are various applications in the context of mapping. These applications illustrate the use of transparency as a
technique to display information with reduced clutter and improved continuity. The
computer's computational power is also used to determine when transparency should be invoked as a response to the user's actions.
One result of this study is the beginning of a sketching system that can be used as a design tool. This latter application is similar to the medium of tracing paper and can aid in the generation of ideas through the gradual and cumulative process of design.
THESIS SUPERVISOR: Nicholas P. Negroponte
acknowledgements
I would like to take this opportunity to thank my thesis advisor, Associate Professor of Computer Graphics Nicholas Negroponte, for providing me with the opportunity to work with him and the Architecture Machine Group.
I would also like to acknowledge the students and staff of the Architecture Machine Group for their assistance with this project
-special thanks to Craig Reynolds, Larry Stead, and Guy Weinzapfel for their continuous
and helpful advice.
The work documented in this report has been sponsored by the Defense Advanced Research Projects Agency under contract number MDA90 3-78-C-00 39
Louis Weitzman
contents
1.0 INTRODUCTION 6
1.1 Traditional versus Interactive Mapping 7
1.2 Literal versus Phenomenal Transparency 11
1.3 The Study of Transparency 14
1.3.1 History 14
1.3.2 Techniques 16
1.3.3 Mosaic Method 17
1.3.4 Perceptual Scission 21
2.0 IMPLEMENTATION 26
2.1 Raster Scan Implementation 27
2.2 Digital Transparency 34 3.0 APPLICATIONS 36 3.1 Transparent Images 37 3.2 Fading 40 3.3 Transparent Gels 42 3.4 Cutaways 45 3.5 Logical Transparency 48 3.6 Computed Transparency 51 3.7 Transparent Sketching 53 4.0 APPENDIX 57
58
4.1 Hardware Environment 4.2 Programmer's Manual 61 5.0 BIBLIOGRAPHY 814
"How'd yuh know deh was such a place," I says, "if yuh neveh been deh befoeh?"
"Oh," he says, "I got a map."
"A map?" I says.
"Sure," he says, "I got a map dat tells me about all dese places. I take it wit me every time I come out heah," he says.
And Jesus' Wit dat, he pulls it out of his pocket, an' so help me, but he's got it--he's tellin' duh troot--a big map of duh whole f--- place with all duh different pahts mahked out. You know--Canarsie an' East Noo Yawk an' Flatbush, Bensonhoist,
Sout' Brooklyn, suh Heights, Bay Ridge, Greenpernt--duh whole goddam layout, he's got it right deh on duh map. ...
So den duh guy begins to ast me all kinds of nutty questions: how big was Brooklyn an' could I find my way aroun' in it, an' how long would it take a guy to know duh place.
"Listen'" I says, "You get dat idea outa yoeh head right now," I says., "You ain't neveh gonna get to know Brooklyn," I says, "an I don't even know all deh is to know about it, so how do you expect to know duh
town,"- I says, "when you don't even live heah?"
"Yes," he says, "but I got a map to help me find my way about."
"Map or no map," I says, "yuh ain't gonna get to know Brooklyn wit no map," I says.
Wolfe, Thomas, From Death to Morning, "Only the Dead Know Brooklyn," pp 93,95,
# r'- ftI r e #i
ON^
A**e M -aAna ta sA MW *# gd * Pae
#@ taaw 4 ny
as* ae#s e wn eewam
e -ranames mein
1.0 INTRODUCTION
6
1.1 traditional vs interactive mapping
Traditionally, maps have been used as aids to orientation and way finding. They have never been able to present a complete
description of an environment, forming a reliable image of that place. The creation
of this image has traditionally taken place
between the observer and his environment.
It is a two-way process in which the
environ-ment would suggest distinctions and relations while the observer would select, organize
2 and give meaning to what he sees.
Ultimately a map could have this same image
formation capability. Through the process
of creating this image with a map, one
could come to "know" a place without ever
having been to the environment.
The limitations of conventional maps that prohibit this from occurring are related to
the quantity of information that must be
communicated and the way in which that
infor-mation is now presented. Since legibility must be preserved, the amount of information
on a single map is small. Multiple diagrams
of the same area are necessary to adequately
1Kevin Lynch, The Image of the City (Cambridge: MIT Press, 1960), pp. 1-13.
2
Ibid. pp. 123-139.
convey all aspects of that place. Continuity
between the various maps then becomes a problem as one must relate information from one diagram to the next.
The only way in which to handle the large
amounts of data and its presentation is
through the use of an interactive computer based mapping system. Many of the problems with the volume of data can be resolved
merely through the use of the computers great speed and storage capacity. A data-base management system could utilize high
speed storage devices to provide quick access
to an almost limitless database. This data could include all types of information
necessary in the formation of a reliable
image of a place including: maps, photo-graphs, movies, written descriptions, sound,
1
etc.
1
Eric Teicholz and Julius Dorfman, Computer Cartography World-Wide Technology and Markets (Newton, Massachusetts: International Technology Marketing, 1976).
8
The method of data presentation is also a
very important characteristic of the system. One of the most critical features in this presentation is the capability for user interaction. In a highly interactive
through the interaction itself.1 Because of
the quality of this interaction, the
functions of map reader and map maker are no
longer distinct. The user creates a person-alized image of a place where the
cartogra-pher's schematic representation used to be.
Sophisticated display techniques can be
em-ployed by the system to further improve the
overall communication of information by
reducing the clutter and improving the
continuity of the data. This thesis explores
the use of transparency as one such
technique. In the following sections various applications of this technique are described. These applications include:
1) pure transparent images,
2) fading,
3)
cutaways-looking through one image to a
corresponding image below,
4) logical
transparency-objects having common attributes share similar transparent qualities
5) computed
transparency-the computational powers of transparency-the
computer are used to determine when
1Nicholas Negroponte, Christopher Herot, and Guy Weinzapfel, "One-Point Touch Input of Vector
Information for Computer Displays," (Cambridge, Massachusetts: 1977).
transparency should be displayed as a response to user actions, and 6) a sketching system in which
trans-parent sheets are simulated to produce independent overlays.
1.2 literal vs phenomenal transparency
To fully understand transparency one must realize that there are two different con-ditions under which transparency will be perceived. The first condition is called "literal" (physical) transparency.
1
Physically transparent objects are present in our everyday life - glass, plastics, etc. For one to perceive these objects as
transparent, however, it is necessary for one to see not only the surface behind the transparent medium but also the transparent
medium or object itself. Air and glass are
not perceptually transparent unless fog and
scratches or reflections make their respec-tive medium visible.
Physical transparency in itself does not
guarantee perceptual transparency.2 If a piece of transparent material is placed directly on top of a homogeneous
back-ground the material is no longer transparent and is seen as opaque. Women's nylon
stockings, though physically transparent,
are not seen as such because its color and
texture merge with those of the leg. When
the shape of a physically transparent
If one sees two or more figures partly overlapping one another, and each of them claims for itself the common overlapped part, then one is confronted with a contradiction of spatial
dimen-sions. To resolve this contradiction, one must assume the presence of a new optical quality. The figures are endowed with transparency.
Gyorgy Kepes, Language of Vision p. 77.
1
Colin Rowe with Robert Slutzky,
"Transparency: Literal and Phenomenal," in The Mathematics of the Ideal Villa and Other Essays,
(Cambridge:
MIT Press, 1976).2
Fabio Metelli, "The Perception of Transparency," Scientific American, April, 1974, p. 91.
FIG. 1.1
FIG. 1.2
1
Rudolf Arnheim, Art and Visual Perception (Los Angeles: University
of California Press, 1974), p. 253.
2
Rowe and Slutzky, "Transparency: Literal and Phenomenal."
3
Arnheim, Art and Visual Perception, p. 248.
surface coincides with the shape of the background, no transparency is perceived.1
It is possible, however, to perceive an object as being transparent when no physical trans-parency is present. This second condition is known as "phenomenal" transparency.2 A
basic law of perception states that any visual pattern will be spontaneously organized by the
mind in such a way that the simplest
interpre-tation will result. That is why an overlap-ping square and circle are seen as two instead
of three distinct elements. Also a pattern will appear three-dimensional when it can be seen as the projection of a three-dimensional situation that is structurally simpler than a two-dimensional one.3 This is the concept employed by artists limited to two dimensions to create the illusion of depth.
Because of the third dimension in architecture, physical transparency becomes a reality.
There is no need to rely totally on percep-tual transparency as in paintings. Therefore,
most discussion about transparency in
architecture is based exclusively on the
physical properties of materials themselves.
Perceptual transparency, on the other hand,
is a condition much more difficult to
achieve.
I>
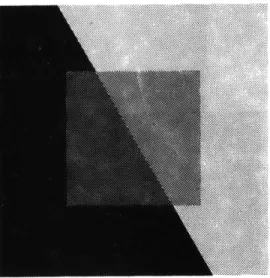
FIG. 1.3 OPAQUE MOSAICS PRODUCING PHENOMENAL TRANSPARENCY
1.3 the study of transparency
1.3.1 HISTORY
One of the first people to show that physical transparency was not necassary for perceptual
transparency was Wolfgang Metzger of Munster. He used opaque cardboard mosaics to give the illusion of transparency. By placing two sets of squares next to each other that do not
appear to have any transparent qualities, a perceptual transparency can be experienced.
In the 19th century, Hermann von Helmholtz wrote a treatise on physiological optics and
described the perception of transparency as 2
"seeing through". He used a device which superimposed two strips of paper of different colors by reflection and transparency. The two images were perceived one behind the
other much like the image experienced looking
through a window seeing both the reflected interior and exterior simultaneously.
1
Metelli, "The Perception of Transparency," p. 91. 2Ibd
14
Ewald Hering did not agree with Helmholtz.
He argued that when light reflected by two
region an intermediate or fusion color will
be perceived.
He observed that when looking
only at the region where two color images
overlapped, just one color, the fusion
color was perceived.
1In 1923 W. Fuchs, a German
psychologist,
solved the Helmholtz/Hering controversy.2
He showed that both colors are perceived
only when the transparent object and the
object seen through it are perceived as
independent. If
the region of overlap of
the two objects is isolated, then only the
fusion color is perceived.
Some other findings were made in the
follow-ing years.
3The fact that transparency on
a totally homogeneous ground is not possible
was discovered by Kurt Koffa and some of
his students at Smith College.
Another
finding revealed that not only is the region
of overlap of two figures important to the
perception of transparency, but also is the
region in which the background can be seen
Ibid.through the transparent
surface.
This was
2Ibid.
discovered in 1955 by Gaetano Kaniza at the
Ibid.University of Trieste.
The fact that this
FIG. 1.4 STATIONARY EPISCOTISTER
FIG. 1.5 ROTATING EPISCOTISTER
1
lIbid., p. 92.
2
Ibid.
16
had been neglected for so long indicates
that transparency on a figure is much more
evident than transparency on the background.
1.3.2 TECHNIQUES
Early investigations used filters or
transparent objects, but after it became
clear that physical transparency was not a
criteria for perceptual transparency the
use of physically transparent objects was
generally abandoned.
1One technique was through the use of
episcotisters, wheels with sectors cut out.2
When the wheel is rotated at a high speed
it would generate a
strong impression of
transparency.
This technique would enable
the investigator to independently vary the
size of the missing sectors, which affects
the degree of transparency, and the color
of the remaining sectors, which determines
the color of
the transparent layer.
Another approach was to use the mosaic
method that was developed by Metzger.
This
provided the experimenter with the most
flexibility. Using this method one could
independently vary the color, shape, and size
of each region of a configuration. With
this technique it is easy to demonstrate
that transparency depends on form as well as
color.
Because this technique can be applied
to raster scan display systems, it will
be described in more detail.
1.3.3
MOSAIC METHOD
The following examples of mosaic
transpar-ency are for relations of "pure" achromatic
conditions.1 They deal
with instances of
balanced transparency where the perceived
transparent layer is uniform in degree of
transparency and color.
Unbalanced
transparency, where the perceived
parent layer varies in degree of
trans-parency, and chromatic transparency are
also possible.
The
three main figural conditions for
per-ceiving transparency using the mosaic pp. 92-94.
method are:
FIG. 1.6 CONTINUITY OF TRANSPARENT LAYER
1) Continuity of the transparent layer,
2) Continuity of the boundary line, and
3) Adequate stratification.
CONTINUITY OF THE TRANSPARENT LAYER
Continuity of the transparent region
(figural
unity) must be preserved else the perception
of transparency is lost. However, changes
in the shape of the transparent layer do not
destroy the illusion of transparency as long
as there is continuity of that region.
Continuity of the transparent region alone is
not sufficient for the perception of
transpar-ency.
FIG. 1.7 LACK OF CONTINUITY
FIG. 1.8 CONTINUITY REGAINED
CONTINUITY OF THE BOUNDARY LINE
The line separating the background shapes
must be perceived as belonging to those
opaque regions. A break in the continuity of the boundary line where it intersects
the transparent layer can destroy the perceived transparency. Abrupt changes
in the boundary at points other than this intersection do not destroy the perception of transparency. This by itself is again
not sufficient to guarantee the perception of transparency.
FIG. 1.9 CONTINUITY OF BOUNDARY LINE
FIG. 1.10 LACK OF CONTINUITY
ADEQUATE STRATIFICATION
The perception of transparency has been
defined as seeing surfaces behind a
trans-parent medium or object.
This means the
layer having the condition necessary to
become transparent must be located on or
above the opaque object.
In order to create
FIG. 1.12 UNDERLYING REGIONS FAIL TO
this illusion the underlying opaque
MEET UNDER TRANSPARENT LAYER
regions must appear to meet under the whole
of the transparent layer.
Separately these three conditions are not
sufficient for the perception of transparency.
They must all be present for this phenomena
to occur.
FIG. 1.13 ADEQUATE STRATIFICATION
1. 3.4 PERCEPTUAL SCISSION
Perceptual scission is the phenomenon where
two different shades of gray give rise to the same shade of gray in a perceived trans-parent layer.1 With the perception of trans-parency the stimulus colors, the original shades of gray, split into two different
colors. These colors are called the scission colors. One of the scission is perceived
to be part of the transparent layer while the other is perceived to be part of the opaque layer below.
In 1933 Grace Moore Heider of Smith College formulated a hypothesis to show the simple
relation between stimulus and scission
2
colors. The hypothesis stated that when a pair of scission colors are mixed, they will
recreate the stimulus color. The law of
color fusion allows us to predict what
color will be perceived when two colors are mixed. Color scission is the reverse of this
process and allows us, as Heider
demonstra-ted, to describe the color scission that gives rise to transparency.
1
2bid., p. 93.
2
one
unique
fusion
color
infinite
variety
of
combinations
FIG. 1.14 COLOR WHEEL
22
The device used to study color fusion is
the
color wheel.
Two or more colors are placed
on the wheel which is
then rotated rapidly.
Depending on the proportions and colors
placed on the wheel, a fusion color is
per-ceived.
With achromatic colors the resulting
fusion color can easily be predicted. With
color scission, however, there is an infinite
number of ways in which the stimulus color
can split.
In the figure, color fusion with achromatic
colors is diagrammed.
With relative
reflec-tance levels represented by numbers, 100
being perfect white and 0 being perfect
black, an endless number of combinations
can be used to achieve the same shade of gray.
Transparency is perceived only when there
is a separation of the stimulus color to
both the transparent layer and the opaque
background. The transparency varies
dir-ectly with the proportion of color going to
the underlying layer.
If all the color goes
to the transparent layer it becomes opaque.
As more color goes to the underlying layer
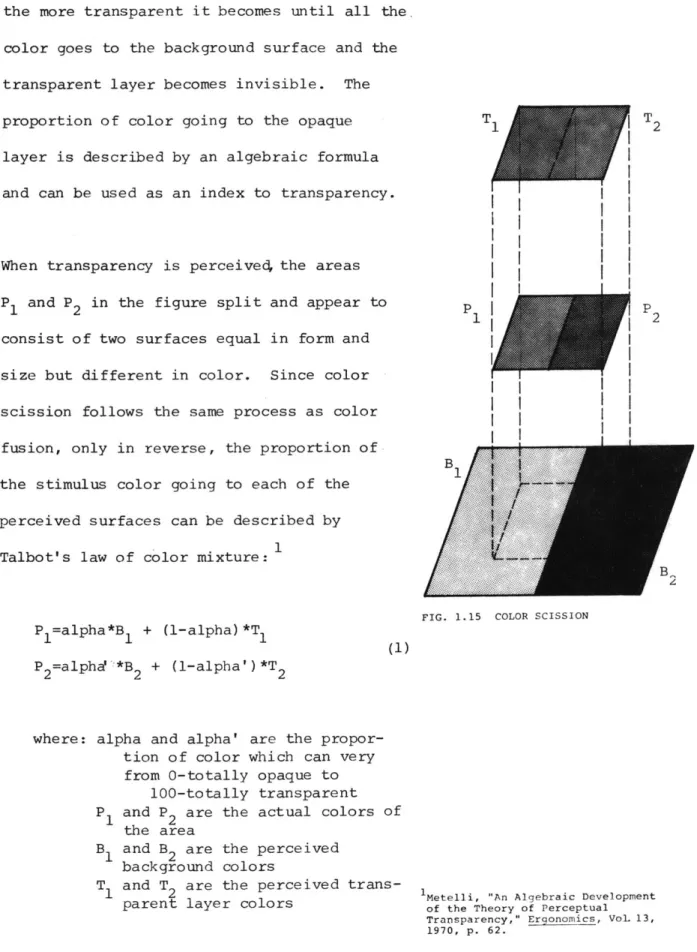
the more transparent it becomes until all the color goes to the background surface and the transparent layer becomes invisible. The proportion of color going to the opaque
layer is described by an algebraic formula and can be used as an index to transparency.
When transparency is perceived the areas
P1 and P2 in the figure split and appear to
consist of two surfaces equal in form and size but different in color. Since color scission follows the same process as color
fusion, only in reverse, the proportion of
the stimulus color going to each of the
perceived surfaces can be described by Talbot's law of color mixture:1
P 1=alpha*B1 + (1-alpha)*T
1
P2=alpha!'*B 2 + (1-alpha')*T2
where: alpha and alpha' are the propor-tion of color which can very
from 0-totally opaque to 100-totally transparent
P and P2 are the actual colors of
the area
B and B2 are the perceived background colors
T and T are the perceived trans-parent layer colors
1
FIG. 1.15 COLOR SCISSION
1Metelli, "An Algebraic Development of the Theory of Perceptual Transparency," Ergonomics, Vol. 13,
1970, p. 62.
T. | T2
The following are some other examples of
conditions necessary for the perception of
transparency.
The first
diagram is an
example of a readily transparent configuration.
Transparency increases when the difference
between the dark and light gray regions is
increased.
Transparency decreases when the gray regions
are similar.
FIG. 1.16
FIG. 1.17
FIG. 1.18
No transparency is perceived when the gray regions are identical.
Transparency is possible only when the darker gray square is on the darker under-lying surface and the lighter gray square is on the lighter underlying surface. In
this case there is no percevied transpar-ency.
The difference of reflectance of the colors
in the transparent layer must always be less than the difference of reflectance of the colors in the unerlying layers. In this case there is no perceived transpar-ency in the central region but the outer
zone takes on transparent qualities.
FIG. 1.19
FIG. 1.20
FIG. 1.21
z
0
1=
I-z
w
w
-J
0~
0
(%4
kg
I
I
t
I.
I
I
I
(N2.1 raster scan implementation
Raster scan display systems lend themselves
to the study of transparency because of the
ease in which colors and shapes can be
created and modified. To better understand
how the mapping techniques described in
this report work, an overview
of raster scan display systems in general, and the Ramtek RM-9300 in particular, is
included.
Tristimulus colorimetry is a system of
color analysis on which raster scan displays are based. All systems of tristimulus
colorimetry have two fundamental
principles in common. The first is that
color is a three dimensional property of
light: hue, saturation, and brightness.
The second principle is that the amounts
of the three color primaries to match an
unknown color may be used as numerical dimensions to specify the color. An additive color process of this sort can
not reproduce all possible colors but is
adequate for all colors of interest. The
primary colors selected for color display
1
G. Wyszecki and W. S. Stiles, Color
Science (New York: Wiley, 1967); T. N. Cornsweet, Visual Perception
1
Richard A. Bolt, Nicholas Negroponte, and Victor, "Color Transparency Effects from Mosaics of Opaque Color,"
(Cambridge, Massachusetts: 1977).
2.9
systems are highly saturated red, green, and blue. When separately controlled, these primaries can match the widest possible range
of colors. In the display system these three
primaries are generated by modulating the
light emittances from independent red, green, and blue phosphers. Stated as an equation1:
color = r*R + g*G + b*B (2) where: r, g, and b are integer numbers
ranging from 0 through 255
controlling the display for each picture element.
There are three basic approaches to raster scan computer graphics:
1) on-the-fly scan conversion 2) run-length lists, and
3) n-bit-per-point veridical memories but the latter is the most widely accepted.
For every dot on the screen, there are some number of bits of memory
(including zero) . In the simplest sense, one can consider a 525-line television screen as a two-dimensional array of single bits 700 wide,
because of the aspect ratio, and 525 high, so that, say, 1 is on/white and 0 is off/black.
Given that both the computer and the video display processor can provide access to this array, we effectively have a storage tube with local
erase. Elaborating slightly, we
can provide more than one bit per point to achieve gray-tone or color. Ultimately we can make the mappings of areas and tones
programmable and incredibly variable.
The image of the Ramtek display system is composed of an array of 640 x 480 indepen-dent picture elements, or "pixels". Each pixel has a numerical value associated with
it, and it is this value that determines the
pixel's color. This value is merely an index into a color matrix, or look up table. A separate color can be stored in the
matrix for each unique pixel value. The size of this matrix (the number of unique
addresses available) limits the effective pixel wordlength. In the Ramtek, there are
1024 color matrix addresses. This requires a pixel wordlength of 10 bits. As well as
the 10 bits of picture data, there are two
additional bits available per pixel.
These two bits do not affect the displayed image but are useful for storing other data. For example, they can be used as
flags independent of the image to distinguish
boundary conditions.
01001111011 041
pixel
value
red green blue
~
color
matrix
1023
FIG. 2.1 PIXEL (X,Y) SHOWN WITH ITS EFFECTIVE 10 BIT PIXEL VALUE
(0100110101) ADDRESSING A UNIQUE SLOT IN THE COLOR MATRIX
lNicholas Negroponte, "Raster Scan Approaches to Computer Graphics," (Cambridge, Massachusetts: 1977). 0 X 0 639 y
display
screen
479ILI
Images for the display system were digitzed with the Vidicon camera. Through this
digitization process,, the Ramtek would receive only eight bits from the camera, a range of
256 gray levels. Because the transparency
applications in this paper explore the
combinations of more than one image, a varia-tion of this process was used.
In order to store multiple images, one must compress the data from the Vidicon so as to create virtual layers. Any number of images
up to eight can be stored via compression of the Vidicon data, but it must be remembered that the more images one stores, the fewer
gray levels there are available per image. For example, if two images are digitized, one can split the eight bits into two four bit images both consisting of 16 gray levels
4
8
(2 ) instead of the normal 256 levels (2
)
I use this combination of two four bit images
often in the applications and will refer to
the image stored in the low bits (1-4) as the
low order image, and the one stored in the
high bits (5-8) as the high order image.
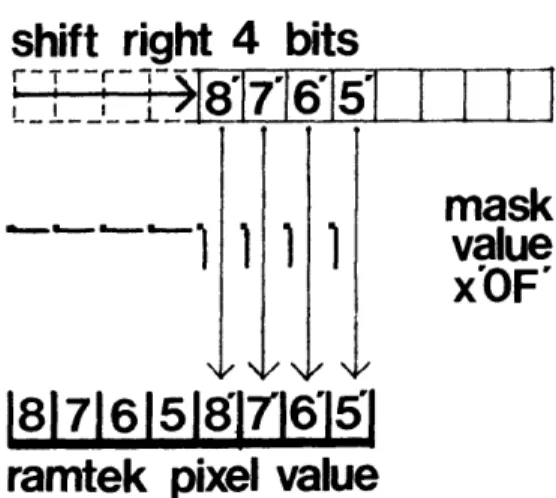
A useful feature of the Ramtek that is
employed when storing more than one image is the software feature called the "subchannel mask". This option allows the protection of certain bits of the pixel value that contain important data. For example, when only one image is digitized no mask is necessary. However, when the second image is digitized one must shift the eight bits from the camera
to the right in order that only the high
order bits of the second image are stored.
The mask must then be used in order that the bits containing the first image are not
modified.
The diagram graphically
illus-trates both the shift right by four bits and
the use of the subchannel mask. This is
just one example of how the subchannel mask can be used in protecting pixel data.
Normally with an eight bit image, one would
want a grayscale loaded in the matrix with black mappingto 0 and white mapping to 255. However, when you want to display just one of many images that are stored, the color
matrix must be loaded such that only those bits of the image to be displayed are
significant in referencing unique colors.
8 bit vidicon data
|8'|7'J6'|5'l4'3'J2'|1'|
shift right 4 bits
r
T--r--
- ,15 ,1
l
44
8|7|6|5817'16'151
mask
value
x'OF'
ramtek pixel value
FIG. 2.2 GRAPHIC REPRESENTATION OF
THE SHIFT AND MASK USED IN DIGITIZING IMAGES
I I I I
For any arbitrary image stored, it is
necessary to know:
1) the number of bits per pixel in the
image,
2) the number of bits higher than the highest bit in the image, and 3) the number of bits lower than the
lowest bit in the image.
In the example of two four bit images, these parameters for the low order image are:
number of bits/pixel numl=4 bits higher highl=4
bits lower lowl=O
These parameters are then used to control the loading of the color matrix. The 2 (numl)
or 16 colors are chosen and then loaded
into the matrix such that each color is
re-(lowl)
peated 2 or 1 time. This loading
sequence is then repeated 2(highl) or 16
times. The total number of entries loaded
into the matrix will then equal
2 (highl+numl+lowl) or 256.
This loading procedure is generalized so that
those bits lower than the lowest bit and higher
than the highest bit of the image will not
affect the color displayed at any one point.
The parameters for the high four bit image are:
num2=4
high2=0
low2=4
This means that each of the 16 colors for the
second image would be loaded 2(low2) or 16
times. However, the sequence is repeated
only 2 (high2) or 1 time so that the total
number of colors loaded is still 256.
2.2 digital transparency
One of the first objectives of this research
was to simultaneously display two separately stored images. With this effect one image is perceived as transparent, thus revealing the
second image below. One interesting
charac-teristic of transparency is that the form of
the data is independent of the technique.
Whether the data is two-dimensional, three-dimensional, schematic, photographic, static, or dynamic, information can be displayed sim-ultaneously without one "layer" obscuring the other. This section deals with the algorithm responsible for the generation of these images.
Conceptually digital transparency is easy to produce if one combines Talbot's law of color mixture (equation 1):
Pl=alpha*Bl
+
(1-alpha)*Tl
with the fact that raster scan display systems
uniquely specify a color by modulating the
light from three separate phosphors, red,
green, and blue (equation 2). For any one point, separate equations can be written for
the pixel colors of both the background and
transparent layers:
backgroundcolor=Br*R + Bg*G + Bb*B transparentcolor=Tr*R + Tg*G + Tb*B
Combining these equations results in three separate relationships, one for each of the
primaries:
Pr=alpha*Br + (1-alpha)*Tr Pg=alpha*Bg + (1-alpha)*Tg Pb=alpha*Bb + (1-alpha)*Tb
where: r,g,b represent components for red, green, and blue of the
final perceived color (P),
the color of the background
layer (B), and the color of the top layer (T).
The new perceived transparent color can now be described by combining the perceived red, green, and blue components:
perceived color=Pr*R + Pg*G + Pb*B
These equations are the same whether or not
the images are in color or black and white.
All subsequent routines that utilize the effect
3.0 APPLICATIONS
3.1 transparent images
The first application of transparency illus-trates the possibility for placing objects over an image such that the underlying image is not obscured. This technique, like
many of the subsequent applications, utilizes a database of Fulda Gap, Germany that has been stored on disk. This database includes
information on
1) land use,
2) soil types,
3) vegetation, and
4) elevation features.
It is stored in an 80 x 80 array and covers a 10 x 10 kilometer area. For more information on this data, on-line
documenta-tion exists in directory FULDA in the file DATA.doc.
Examples of simple transparency are shown in
the two photographs. In the first figure, a black and white map of Germany is used as an underlay on which colored land use symbols have been placed. The routine that creates these symbols (program: USE) also generates transparent colors for each symbol. The
1
William D. Gooch, "Clutter Control Through Use of Sound in Computerized Interactive Maps," (Bach. of Sci. in Computer Science and Engineering, 1978).
FIG. 3.1 TRANSPARENT SYMBOLS
FIG. 3.2 TRANSPARENT DATA SHEETS
user can determine the land use at any
loca-tion by touching that spot by means of a
tab-let.
The computer then accesses the database
to display the appropriate symbol. The scale
of the symbols change to correspond to the
scale of the digitized map. This application
can also be implemented with other display
techniques, ie digitized sound, to increase
the overall sensory input.
The second figure illustrates the possibility
for this data to be overlaid as multiple
sheets of transparent colors. Here a colored
layer of "urban" land use has been combined
with colored layers for different soil types.
The program
(program: OVERLAY) can combine
a total of six data types over a four bit
digitized map.
A problem occurs because the different
over-lays lie on the same grid pattern, and
there-fore do not follow the rules for perceptual
transparency in mosaics.
Transparency works
in some areas, but in others the overlays
lose their cohesiveness and new
colors are perceived.
Another example of straight transparency is illustrated on the dividers to the five major sections in this report. The
program that creates these transparencies (program: TRANSIT) assumes two four bit black and white images have previously been digitized. Then it generates a new
color matrix in order to see the combination. The only difference that exists between
these images is the percent of transparency. In this sequence the percentage changes from
0% to 100% in increments of 25%.
Because of the late implementation and
considerable effort in digitizing color images, transparency utilizing two separate color images was never illustrated. Once two color images are stored in the Ramtek,
however, it would be an easy task to si"
multaneously display both images since the same algorithms are employed.
FIG. 3.3 A SUMMER'S NIGHT, AUG., 1956
FIG. 3.4 COMBINATION OF FIG. 3.3 AND FIG. 3.5
FIG. 3.5 A WINTER'S DAY, JAN., 1963
40
3.2 fading
Transparency may also be used to provide
smooth changes between images through the process of fading. This allows one to change
from one data type to another keeping the continuity intact. The result of the
transition may be just to change the detail of information, or may be to change the scale,
of the diagram, or may even be to reveal a
completely new topic. In any case, the
smooth fade allows for a more subtle and
interesting transition.
The fading technique is achieved by creating a series of transparent images incrementing
the coefficient "alpha" in equation 1 from
0 to 1 (or vice versa). The greater number of steps in the fade, a slower yet smoother
fade will result. This technique also assumes
two images are stored in the Ramtek. In this routine (program: FADEIT) the user must
indicate the number of steps in the fade,
the number of bits per point for each image
and the direction of fade (from low bit image
to the high bit image or vice versa).
"The Changing Countryside" in which the dis-play fades from a summer's night in August
1956, to a winter's day in January 1963.
The middle step is 50% of both the starting and ending images.
3.3 transparent gels
A technique which demonstrates the flexibility
in creating multiple overlays is a program that generates transparent rectangular gels.
These gels also illustrate the possibility of highlighting areas by controlling the brightness of the overlay. Relating certain areas with one another is also possible using
transparent gels of similar hues.
One extension of this technique is provided
when the rectangular gels are given mobility. Interesting conditions then occur when two
or more rectangles overlap. In these
situa-tions multiple color combinasitua-tions are needed
to diplay a realistic illusion of physical transparency.
If the rectangles were moved by erasing and redrawing the entire shape, the resultant figure would be flickering constantly. The system cannot redraw the rectangle fast
enough without the eye detecting the subtle
changes. In order to avoid this undesirable effect, the technique of frame coherence is applied. This technique assumes the shape
is coherent throughout. Then by erasing and redrawing only what is necessary in any
movement, the major portion of the object
re-mains unchanged. This allows a smooth, flicker free movement of the rectangles across the screen.
There are two options for creating and moving these rectangles. One (program:
SQUARE) allows the user to create from one
through nine rectangles over a black and
white image. Each rectangle requires one
unique bit of the pixel value for storage.
Since there are a maximum of eight bits
needed for a digitized image, there are
immediately two bits free. For every
rectangle greater than two, however, a bit
must be taken from the image data. In order to do this, the image is shifted to
the right one bit. The low order bit is
thus discarded allowing a high order bit to be freed. This can occur until there remains only one bit (two colors) for the image and nine bits for nine separate rectangles.
FIG. 3.6 TRANSPARENT GELS
V
FIG. 3.7 TRANSPARENT GELS
FIG. 3.8 TRANSPARENT GELS
The second series of routines (program:
CSQUARE) allows one to create a maximum of
bit
colored image.
Both series of
routines requires the user to specify the
red, green, and blue components of the
transparent gels.
The percent of
trans-parency
is
also required before a new color
set can be generated.
3.4 cutaways
Another technique that utilizes two stored
images is a routine that allows one to look
through the "top" image to a different image
"below". This technique is useful in
correlating not only two-dimensional
infor-mation, like aerial photographs and schema-tic maps, but also three-dimensional infor-mation. The ability to look through a
building to see what's behind it is only
one such application. This example of
"x-ray" vision is most effective when there exists similar information on both images that can be aligned.
The technique becomes interactive when the
cutaway area is given mobility. The user can then move the window across the screen using frame coherence. Whenever the user points to an area, that portion of the
second image is revealed.
In order to create the "window" effect the
9th and 10th bits of the pixel value are
used to reference different quarters of the color matrix. The first quarter of the
FIG. 3.9 "UPPER" LAYER
FIG. 3.10 "LOWER" LAYER
FIG. 3.11 CUTAWAY LOOKING THROUGH UPPER LAYER
FIG. 3.12 MULTIPLE WINDOWS
-CLEAR
FIG. 3.13 MULTIPLE WINDOWS
-TRANSPARENT
46
matrix can be loaded with an appropriate
color set to display the first
image while
the second quarter can be loaded to display
the second image.
A clear window can then
be drawn if
the 9th bit of the pixels within
the window is
"on" (referencing the second
quarter of the matrix) while those pixels
outside the window are "off" (referencing
the first
quarter of the matrix).
There are many parameters to the basic
win-dowing program making it
a very flexible
routine (program: EWINDOW) .
The window
may reference any one of the four sections
of the color matrix.
It may remain visible
at all times or
just when the tablet is being
touched. It'
s size is variable and its path
can remain visible. If a small window whose
path is visible has been defined, one can
"erase" the top layer revealing the second
image below.
Applying the transparency
algorithm and loading the appropriate color
set into the matrix, the window can take on
any level of transparency desired.
The fading
technique can also be applied to the quarter
of the matrix that is referenced wihtin the
window allowing only the window to fade from
one image to the other. A final variation of this routine (program: PWINDOW) displays a window that dynamically varies its trans-parency. The various degrees of pen-tablet
pressure is utilized to determine the trans-parent quality of the window. A clear window
is displayed when maximum pressure is applied.
The window in this application bears no relation to any specific area of the screen.
Mobility is its greatest asset. This feature could be enhanced if the movement of the
window could be directed by information in a
database. Vector data (roads, railways, and
rivers) exists for Fulda Gap, Germany but
its use in connection with this technique
has not yet been explored.
FIG. 3.14 "ERASED" WINDOW
-CLEAR
FIG. 3.15 "ERASED" WINDOW
-TRANSPARENT
3.5 logical transparency
The concept for logical transparency is a
direct refinement of the windowing
technique of the previous section. The window
described in that section did not show any
relation to the image that was displayed. An arbitrarily sized window would be created sometimes eliminating important
image data or written descriptions. The
window would then have to be redefined to
include the appropriate information. Logical transparency is an effort to make the window somewhat "intelligent" in relation to the displayed image (at the expense of mobility) .
In order to do this,:a database must accompany the image. This data base is now generated on-the-fly for the set of digitized images.
Different groups of windows are defined and
linked together as are the individual windows
within groups and the points within each
window. Every set of windows can be of
arbitrary length while each individual window can be arbitrarily shaped.
Once the database has been defined, one can display individual windows or a set of similar windows by simply pointing to an object via the tablet. The display routine
will then search until the window pointed
to was located. It would then be displayed by flooding the irregularly shaped window. If a set of windows is to be displayed the routine starts with the one that is
pointed to and searches the list of related
windows until all of them are displayed. When there are many windows or they become very large, the speed of the flood routine
is extremely frustrating. The flood routine
takes many seconds to complete and the
responsiveness of the program is destroyed (program: UPSET) .
The three examples of logical transparency are illustrated with two images, an aerial
photograph and diagram, of Stockholm, Sweden. The database was created to display different building types. The first figure shows a single cutaway of one of the museums, the
National Museum. The second illustration
shows the entire set of museums in the
data-base. The final figure shows a completely
FIG. 3.16 ONE LOGICAL WINDOW
FIG. 3.17 MULTIPLE WINDOWS OF SIMILAR TYPE
FIG. 3.18 MULTIPLE WINDOWS OF DIFFERENT TYPE
separate set of building types, governmental.
Notice that every window not only includes
a diagrammatic sketch of the building but
also includes the building's name.
This routine utilizes the Ramtek's additional
llth and 12th bits to draw boundary lines for
the flood program. It uses these two bits
so that the image will not be altered when
the boundaries are allocated.
1
William Porter, "The Development of Discourse: A Language for Computer Assisted City Design," (Ph.d.
dissertation, MIT, August, 1969).
50
Instead of basing the "logic" for
trans-parency on a constructed database, there are
two other directions one could pursue. First,
the database for Fulda Gap,
Germany could
be further explored, using various
combin-ations of the different data types as
requirements for transparency.1 Another method
not yet investigated would use the pixel
values themselves as the database. Each
point with a similar characteristic would
have the same pixel value, pointing to the
same location in the color matrix.
Even-though some pixels may have the same color,
they could point to separate locations in
the matrix.
This difference could then be
used for invoking a new "logical" window.
3.6 computed
transparency
Up till now, the computational ability of
the computer has not been utilized to
deter-mine when transparency should be invoked.
This technique explores the use of that
power.
One application in which the computer can
use this ability is in the computation of
sightlines. Using the previously described
database for Fulda Gap, Germany,this tech-nique displays land use data as transparent overlays if that point can can be seen from a given starting point. Input for this
routine (program: SEEK) in addition to the
starting point includes the viewers height
above ground (in meters) and a maximum
range of visibility.
As one follows a radial path from the
starting point, the maximum height to
distance ratio is stored. For each new
point a new ratio is calculated. If this
new ratio is greater than the old ratio, then the new point can be seen. The new
ratio is then saved as the maximum and the
FIG. 3.19 SECTION OF A RADIAL SIGHTLINE
land use data at that point is displayed.
FIG. 3.20 GRAPHICAL REPRESENTATION OF FULDA GAP ELEVATION DATA
FIG. 3.21 DIRECTED VIEWING AREA
The first
figure is a graphic representation
of the elevation data for Fulda Gap. The
white areas represent high points while the
black areas reprsent valleys.
The second
figure shows just a segment of the total
sweep of a field of vision. The viewpoint
is 200 meters above ground and the land is
relatively flat.
That is why most of the
land use data is being displayed.
In the
third figure the coihplete circular viewing
pattern is shown. The viewpoint is only 40
meters above ground
and sightlines are
limited.
The cursor's position indicates the
viewpoint in both illustrations.
Many variations of computed transparency are
possible now that the database for Germany is
available.
Also a simple refinement of this
program would display information on those
areas that are hidden from ones view.
FIG. 3.22 360* VIEWING AREA
3.7 transparent sketching
Computer based sketching systems provide
artists with a wide range of drawing
tech-niques beyond traditional methods.
Trans-formations of color and size can be made
with simple indications to the computer.
Areas can be .flooded with a particular color
or even by a self-defined "texture".
One
technique usually omitted from these systems,
however, is the ability to draw on separate
layers. With the ability to generate
transparent images, a sketching system
could provide a working environment similar
to the designer's world of tracing paper.
The beginnings of such a system were
inves-tigated as another application of techniques
in transparency. Although constraints did
not allow for a full implementation, a
skeletal system is operational.
It
demon-strates the ability to define "levels" or
"sheets" on which to work. There are eight
bits available for level definition so a
range from one 8bit layer to a maximum of
eight 1 bit layers is possible. The user
can define the transparent quality of 'each
PAINT, Computer Program developed at the Architecture Machine Group at MIT.
FIG. 3.23 ONE LAYER (8 BITS)
FIG. 3.24 SECOND LAYER ADDED (4 BITS)
FIG. 3.25 TRANSPARENT IMAGE OF LAYERS 1 AND 2
layer and indicate which layers are to be
displayed at any given time.
Flipping
through the layers individually is also
possible.
At all times the number of levels
activated are displayed while only those "on"
or writable are lit
up.
In this sketching system there are three
major areas of manipulation. They appear in
menu format and are color coded.
From. left
to right they are:
DATA INPUT/OUTPUT (red)
1) Digitzing an image
2) Disk I/O
3) Tablet input
DATA MANIPULATION
4) Copying picture data from
one level to another
5) Moving picture data on a level
LEVEL MANIPULATION
6) Adding or deleting levels
7) Flipping through the levels
displaying any one level
individually
8) Defining the transparency of
each level
The first series of figures illustrates the addition of layers using digitized images. Initially an eight bit image is stored on
level one. When a new layer is added, the
maximum number of bits per point is cut
in half. The next figure shows a four bit
image on the second level. The third
figure illustrates the transparent image of
the two layers. A third layer is added in
the next sequence and each figure displays an increasing number of levels. The final
illustration of this system shows a detail in which an area has been copied (twice) onto another level and then moved on that level. This technique allows one to move
image data without destroying other data on separate levels. With a transparent image, one can see both levels simultan-eously permitting accurate placement of the
copied area to occur.
Some interesting refinements of this system
would permit logical transparency and
logi-cal copying to occur between levels. Layers
could be made for "read only" mode. This
would enable important drawings or maps to be used as underlays without being modified.
FIG. 3.26 1st LAYER (2 BITS)
FIG. 3.27 1st & 2nd LAYERS
DISPLAYED SIMULTANEOUSLY
FIG. 3.28 1st, 2nd, & 3rd LAYERS DISPLAYED SIMULTANEOUSLY
Writable sheets could then be added on which personalized or temporary data could be marked.
FIG. 3.29 SEMI-CIRCULAR AREA COPIED TWICE ONTO ANOTHER LAYER
4.0 APPENDIX
57
7,tNkliR,
4.1 hardware
environment
When dealing with computer generated
trans-parency, it is necessary to have the ability
to vary colors and shapes easily. To
provide this flexibility the hardware that
was used in this project was the Ramtek
RM-9300 image display system. It is a full
color raster scan display system which is
microprocessor controlled. The system
stores its image in 4k random access memory
refresh in binary.
All of the programs
described in this report are written in terms
of this display system.
Image data was
digitized into the system using the Sierra
Scientific Corporation's standard high
resolution video CCTV camera.
For a more
detailed description of this hardware
configuration and its
relation to the
software techniques see section 2.1
Raster Scan
Implementation.
The
Ramtek display and Vidicon camera are
linked to the Architecture Machine Group's
MAGIC system via an Interdata Model 7/32
192 k-byte mini-computer. This processor
is linked to a common shared bus which is
controlled by another Interdata Model 7/32 mini-computer.
For the duration of this research, all disk access has been through the common shared bus. For this reason images were not stored
on disk. Instead, new images were digitized
from the Vidicon camera for each working
session. Recently a 2314 m-byte disk has been connected directly to the processor
controlling the Ramtek. Images can now
easily be stored providing greater flexibility to the entire system.
1
Richard A. Bolt, "Touch Sensitive Displays," (Cambridge: 1976).
2
Negroponte,Herot,Weinzapfel, "One-Point Touch Input of Vector
Information for Computer Displays," (Cambridge: 1977).
3
Nicholas Negroponte, "Large Format Displays," (Cambridge: 1977).
59
The Architecture Machine Group is a unique
environment for man-machine interaction.
Although the techniques described in this report have not yet been implemented on some
of the labs more sophisticated hardware,
1
2
touch sensitive, pressure sensitive, and large scale "media room" display systems.3 Current research is now working in this area
to allow the user to physically become more a part of the mapping process.
The machines used in this report can be seen in relation to the total AMG's hardware
envi-I
eb
00ED00
0
O
COLOR XEROX COLOR V. T. R. B&W -1000 LINE T.V . COLOR MONITORS LIGHT VALVE>
]
TO M.I.T. CABLE T.V.FIG. 4.1 HARDWARE ENVIRONMENT
60
4.2 programmer's
manual
This section is an alphabetical list of those routines used to illustrate the various applications described in this report. Each routine is accompanied by:
1) a brief description of the program,
2) a list of those programs that
call the routine,
3) a list of those programs it calls, 4) the correct format for using the
routine ( the declare and call statements
),
and5) the name of the main routine in
which it is utilized.
A more detailed explanation exists for
each routine in its PL/l file.
ACCENT
This routine displays the Fulda Gap eleva-tion data. It reads in the data from the FULDA directory and displays high points
(the highest being 800 meters) as white and low points (the lowest being 300 meters) as black.
called by: none
calls:
none
application: GENERAL
ADD
This routine changes the value of NLEVEL, either adding or deleting levels to be used. FMASK is called to determine the new mask value.
called by: BUM
calls:
dcl add entry; call add; CLEVEL, FCOLOR, FMASK, GETPT, LCOLORapplication: TRANSPARENT SKETCHING
AGEE
This routine displays the symbol for "other agriculture". The structure INFO includes
the display start point plus a scale factor allowing the symbol to correspond to the size of the underlying map.
called by: USE
calls:
none
dcl agee entry(
); dcl 1 info, 2 x fix, 2 y fix, 2 scale fix; call agee (info);application: TRANSPARENT IMAGES
BUM
This routine initializes the Ramtek for the transparent sketching technique. The color matrix is loaded and then a loop is entered which calls the various subroutines.
called by: none