HAL Id: hal-00297385
https://hal.archives-ouvertes.fr/hal-00297385
Submitted on 20 Feb 2006
HAL is a multi-disciplinary open access
archive for the deposit and dissemination of
sci-entific research documents, whether they are
pub-lished or not. The documents may come from
teaching and research institutions in France or
abroad, or from public or private research centers.
L’archive ouverte pluridisciplinaire HAL, est
destinée au dépôt et à la diffusion de documents
scientifiques de niveau recherche, publiés ou non,
émanant des établissements d’enseignement et de
recherche français ou étrangers, des laboratoires
publics ou privés.
A mesoscale convective system trapped along the
Spanish Mediterranean Coast
J. M. Sánchez-Laulhé
To cite this version:
J. M. Sánchez-Laulhé. A mesoscale convective system trapped along the Spanish Mediterranean Coast.
Advances in Geosciences, European Geosciences Union, 2006, 7, pp.153-156. �hal-00297385�
Mediterranean Coast
J. M. S´anchez-Laulh´e
Instituto Nacional de Meteorolog´ıa, Centro Meteorol´ogico Territorial en Andaluc´ıa Oriental, M´alaga, Spain
Received: 7 October 2005 – Revised: 14 December 2005 – Accepted: 10 January 2006 – Published: 20 February 2006
Abstract. This paper describes the evolution of a mesoscale
convective system (MCS) developed over the Alboran Sea on 7 February 2005, using surface, upper-air stations, radar and satellite observations, and also data from an operational numerical model.
The system developed during the night as a small convec-tive storm line in an environment with slight convecconvec-tive in-stability, low precipitable water and strong low-level vertical wind shear near coast. The linear MCS moved northwards reaching the Spanish coast. Then it remained trapped along the coast for more than twelve hours, following the coast more than five hundred kilometres.
The MCS here described had a fundamental orographic character due to: (1) the generation of a low-level storm in-flow parallel to the coast, formed by blocking of the onshore flow by coastal mountains and (2) the orientation of both the mesoscale ascent from the sea towards the coastal mountains and the midlevel rear inflow from the coastal mountains to the sea.
The main motivation of this work was to obtain a better understanding of the mechanisms relevant to the formation of heavy rainfall episodes occurring at Spanish Mediterranean coast associated with this kind of stationary or slowly moving MCSs.
1 Introduction
A mesoscale convective system forms when clouds occurring in response to convective instability amalgamate and orga-nize into a single cloud system with a relatively large upper cirriform cloud structure and produce a contiguous precipi-tation area ∼100 km or more in horizontal scale in at least one direction (Houze, 1993). It is frequent that small MCSs develop over the Alboran Sea during the cold season and mainly at night (Fig. 1). Then they move towards the
Span-Correspondence to: J. M. S´anchez-Laulh´e
ish Mediterranean coast, staying for a long time close to the coast line. Heavy rainfalls episodes occur often in associa-tion with these MCS when they move slowly within an am-bient environment with high precipitable water.
The evolution of a small, low precipitating MCS propagat-ing along the coast for more than fifteen hours, and travellpropagat-ing more than five hundred kilometres on 7 February 2005 is de-scribed by using surface, upper-air , radar and satellite obser-vations and also data from an operational numerical model.
2 Generation and evolution of the MCS
The evolution of the MCS is shown in the Meteosat-8 in-frared images (Fig. 2). The 00:00 UTC ECMWF analy-sis maps (Figs. 3 and 4) depicts the stationary synoptic frame. The MCS developed over the Alboran Sea at about 00:00 UTC from a small convective storm line in the warm sector (850, 700 hPa) southeastern of a cut-off low centred over Portugal, in an area mainly characterized by: (i) weak absolute geostrophic vorticity at 500 hPa (Fig. 3a); (ii) con-vergence at low levels and dicon-vergence at upper levels (Fig. 4); (iii) environment slightly conditionally unstable (Fig. 5); (iv) low temperature at low levels (Figs. 3c and d); (v) low precip-itable water (17.2 mm from the 00:00 UTC Gibraltar sound-ing, Fig. 5a); (vi) high humidity (>90%) at 700 hPa (Fig. 3b) and at lower levels; (vii) strong low level vertical wind shear near the Spanish coast line; and (viii) moderates winds at upper levels (Fig. 5). Then the MCS moved slowly north-eastward, reaching the coast at east of Almer´ıa bight at 07:00 UTC and producing intense showers (maximum pre-cipitation 60 mm) with hail. Later the MCS remained prop-agating along the coast following northeast direction within an environment of lower precipitable water (13.6 mm from the 12:00 UTC Murcia sounding, Fig. 5b).
It is noteworthy to mention that along the trajectory the anvil of the storm is always directed perpendicularly to the coast (Fig. 2). This also indicates the direction of the layer ascent maintaining the MCS.
154 J. M. S´anchez-Laulh´e: A mesoscale convective system trapped along the Spanish Mediterranean Coast
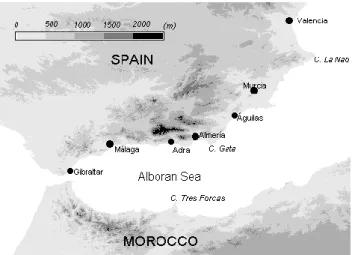
Fig. 1. Map of the extreme western Mediterranean region, showing
topographic features and names of location mentioned in the text.
Fig. 2. Meteosat-8 IR channel 10 (12.0 µm) images showing the
evolution of the convective system along the Spanish Mediterranean Coast at 00:00, 03:00, 06:00, 09:00, 12:00, 15:00 and 18:00 UTC.
3 Observations at surface
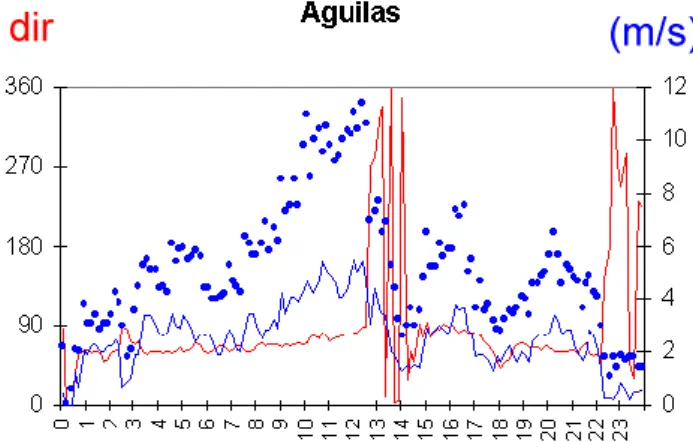
The arrival of the MCS was preceded along all its trajec-tory by strengthened winds parallel to the coast, flowing into the MCS from the east as it can be seen, marked by red circles, from the surface observations maps at 09:00 and 12:00 UTC (Fig. 6), and from the Aguilas station wind record (Fig. 7).These winds were likely generated by blocking of the onshore flow due to coastal orography. The Murcia sound-ing at 12:00 UTC, ahead of precipitation region, showed a relative maximum wind of 16 m/s from 190◦at 638 hPa and another of 12.4 m/s from 90oat 944 hPa (Fig. 5b).
4 Radar images
At its first stage, the MCS exhibited a leading stratiform (LS) region (Fig. 8). Environmental winds were in agreement with the archetype LS by Parker and Johnson (2000) shown in Fig. 10a. Later the stratiform region was stretched transver-sally to the coast, as it can be readily seen in both the PPI reflectivity image from Murcia Radar (Fig. 9) and the storm
Fig. 3. Meteorological situation on 7 February 2005 at 00:00 UTC
ECMWF analysis. (a) 500 hPa: Isohypses (blue) (m), isotherms (red) (◦C), geostrophic absolute vorticity (green) (s−2×10⁵); (b) 700 hPa.: Isohypses (blue) (m), equivalent potential temperature (red) (◦C), Relative humidity (green); (c) 850 hPa.: Isohypses (blue) (m), temperature equivalent potential (red) (◦C); (d) Sea level pres-sure (blue) (hPa), 2 m temperature (◦C).
Fig. 4. Divergence at 400 hPa 7 February 2005 at 00:00 UTC; ECMWF analysis.
anvil in the IR Meteosat images (Fig. 2). At this stage of de-velopment, the stratiform precipitation region moves parallel to the convective line and to the left of the line motion vec-tor. The MCS can, therefore, be classified as Parallel strati-form (PS). The schematic vertical profile storm relative pre-MCS winds for linear PS pre-MCS by Parker and Johnson (2000) (Fig. 10b) requires a strong line-parallel storm-relative upper flow.
Figure 11 shows a scheme of the low level currents in-volved in the MCS, at the moment of heaviest precipitation, when the convective line was crossing the coast line. The
Fig. 5. (a) Radiosounding from Gibraltar on 7 February 2005 at 00:00 UTC; (b) Radiosounding from Murcia on 7 February 2005 at
12:00 UTC.
Fig. 6. Sea level pressure analyses and winds at 09:00 and 12:00 UTC.
ascending stream is promoted by the convergence between the eastern low level storm inflow, parallel to the coast, and the cold pool-rear inflow current (blue).
5 Interpretation
The MCS here described arrived near coast as a leading strat-iform system. A mesoscale vortex (MCV) that formed in the LS stage and become larger than the MCS itself could ex-plain the generation of the low level storm inflow parallel to the coast. Often a MCV tends to form in middle levels at the base of the stratiform cloud deck of the MCS. The MCV can grow upscale and became somewhat larger and much longer lived than the parent MCS (Fritsch et al., 1994). The addition of the basic state flow to the midtropospheric vortex associ-ated with the MCS would yield a forward flanking midlevel wind maximum pointing to the coast. This mesoscale wind maximum would be blocked at lower levels by the orography and a subcloud eastern stream flowing along the coast would be formed.
The convergence between the coastal stream and the cool pool head triggers the convection. The primary air source of the cold pool is the rear inflow. The latent heating and cool-ing in the convective region develop mesoscale circulations. Schmidt and Cotton (1990), Pandya and Durran (1996) and
Fig. 7. Wind record at Aguilas. Dots represent maximum gusts at
10 min intervals.
Fovell (2002) interpret the layer inflow and ascent in terms of gravity wave response to the heating by the MCS. The upward motion takes the form of a deep-layer ascent drawn into the MCS . The gravity wave response leads to a 3 to 6 km layer of inflow air entering the convective region, rising and exiting as the middle to upper level front-to-rear flow. A middle level layer of inflow enters the stratiform region of the MCS from a direction determined by the large-scale flow and descends in response to diabatic cooling at middle-to-low levels.
In this case satellite and radar images indicate that the presence of the cold air on mountains juxtaposed to the air heated in the convective region generate thermally driven cir-culations that determine the orientation toward the mountains of the mesoscale ascent. The middle level inflow is observed in Doppler wind radar images in the rear of the system. Al-though the proximate cause of middle level inflow is likely dynamic, and microphysical feedbacks can strengthen and force it to descend, it’s likely that the downslope flows of the thermal circulations also strengthen and force the middle level inflow to descend.
Figure 12 illustrates an schematic conceptual model of the MCS trapped in the coast.
156 J. M. S´anchez-Laulh´e: A mesoscale convective system trapped along the Spanish Mediterranean Coast
Fig. 8. Maximum reflectivities of Almer´ıa radar at 02:40 UTC.
Fig. 9. Reflectivity at 13:50 UTC. PPI Murcia Radar.
Fig. 10. Vertical profile of layer-mean storm relative pre-MCS
winds for (a) Leading stratiform linear MCS; (b) Parallel stratiform linear MCS (Parker and Johnson, 2000).
Fig. 11. PPI images of Almeria radar at 08:30 UTC; (a) Doppler
winds with inferred streams outlined; (b) reflectivity.
Fig. 12. Conceptual model of MCS trapped along the coast.
Edited by: V. Kotroni and K. Lagouvardos Reviewed by: anonymous referee
References
Fovell, R. G.: Upstream influence of numerically simulated squall line storms, Q. J. R. Meteorol. Soc., 128, 893–912, 2002. Fritsch, J. M., Murphy J. D., and Kain J. S.: Warm core vortex
amplification over land, J. Atmos. Sci., 51, 1781–1806, 1994 Houze Jr., R. A.: Cloud Dynamics, Academic, San Diego,
Califor-nia, 1993.
Pandya, R. and Durran D.: The influence of convectively generated thermal forcing on the mesoscale circulation around squall lines, J. Atmos. Sci., 53, 2924–2951, 1996.
Parker, M. D. and Johnson, R. H.: Organizational modes of midlati-tude mesoscale convective systems, Mon. Wea. Rev., 128, 3413– 3436, 2000.
Schmidt, J. M. and Cotton W. R.: Interactions between upper and lower tropospheric gravity waves on squall line structure and maintenance, J. Atmos. Sci., 47, 1205–1222, 1990