HAL Id: hal-00316579
https://hal.archives-ouvertes.fr/hal-00316579
Submitted on 1 Jan 2000
HAL is a multi-disciplinary open access
archive for the deposit and dissemination of sci-entific research documents, whether they are pub-lished or not. The documents may come from teaching and research institutions in France or abroad, or from public or private research centers.
L’archive ouverte pluridisciplinaire HAL, est destinée au dépôt et à la diffusion de documents scientifiques de niveau recherche, publiés ou non, émanant des établissements d’enseignement et de recherche français ou étrangers, des laboratoires publics ou privés.
Letter to the editor: Are the North Atlantic Oscillation
and the Southern Oscillation related in any time-scale?
R. Garcia, P. Ribera, L. Gimenoo, E. Hernández
To cite this version:
R. Garcia, P. Ribera, L. Gimenoo, E. Hernández. Letter to the editor: Are the North Atlantic Oscillation and the Southern Oscillation related in any time-scale?. Annales Geophysicae, European Geosciences Union, 2000, 18 (2), pp.247-251. �hal-00316579�
Letter to the editor
Are the North Atlantic Oscillation and the Southern Oscillation
related in any time-scale?
R. GarcõÂa1, P. Ribera1, L. Gimenoo2, E. HernaÂndez1
1Depto. FõÂsica de la Tierra II; Fac. CC. FõÂsicas; Univ. Complutense de Madrid; Madrid 28040 2Fac. Ciencias; Univ. Vigo; Ourense
Received: 2 July 1999 / Accepted: 7 September 1999
Abstract. The North Atlantic Oscillation (NAO) and the Southern Oscillation (SO) are compared from the standpoint of a possible common temporal scale of oscillation. To do this a cross-spectrum of the temporal series of NAO and SO indices was determined, ®nding a signi®cant common oscillation of 6±8 years. To assure this ®nding, both series were decomposed in their main oscillations using singular spectrum analysis (SSA). Resulting reconstructed series of 6±8 years' oscillation were then cross-correlated without and with pre-whit-ened, the latter being signi®cant. The main conclusion is a possible relationship between a common oscillation of 6±8 years that represents about 20% of the SO variance and about 25% of the NAO variance.
Key words: Meteorology and atmospheric dynamics (climatology; ocean-atmosphere interactions)
1 Introduction
The North Atlantic Oscillation (NAO) and the Southern Oscillation (SO) are two large-scale alternations in atmospheric mass discovered by Sir Gilbert Walker in the 1920s and that are responsible for a good amount of climate variability over the world.
For the NAO the alteration of atmospheric mass is between the North Atlantic regions of subtropical, high, surface-pressure and subpolar, low, surface-pressure. This alteration of mass can be characterized by two extremes: ``high NAO'' with anomalously low subpolar pressure and ``low NAO'' characterized by the opposite surface pressure anomalies. This alternation of mass, much more evident in winter, results in changes in circulation patterns that necessarily have an eect on
regional patterns of wind, temperature and precipitation. It is well established (Hurrell, 1995) that during high NAO winters westerlies onto Europe are stronger than during low NAO winters; temperature is lower in western Greenland and higher over the rest of Europe than during low NAO winters, and precipitations are higher over Scandinavia and lower over southern Europe and northern Africa than during low NAO winters.
The Southern Oscillation (SO) is the opposition in pressure occurring between the eastern South Paci®c and the Indonesia region. One of the SO extremes (high pressure over the Indonesia area and low pressure over the eastern South Paci®c) is closely related to the El NinÄo phenomenon and the connexion results in weak trades on the Paci®c, anomalously dry conditions over the Indonesia area and anomalously wet conditions over the eastern South Paci®c area. The other extreme (high pressure over the eastern South Paci®c and low pressure over the Indonesia area) is closely related to La NinÄa phenomenon and produces strong trades on the Paci®c, drought on the American Paci®c area and wet condi-tions over the Indonesia area. This feature of the SO is an oversimpli®cation not only of its eect on the Paci®c area but also over other regions, because although the SO main centers of actions are in the tropics the SO has eects globally. Among the great amount of papers published about SO and among the good reviews about the topic, the paper by Trenberth (1991) is a good reference.
The objective of this paper is to examine if there is any common oscillation that links these two large-scale alterations in atmospheric mass.
2 Previous studies
Considering the importance of NAO and SO on the climate there are not many studies that address the possibility of some association between the NAO and the SO. The reason could be that Walker (Walker and Bliss, 1932) considered NAO and SO as two indepen-dent oscillations. Berlage and de Boer (1960) found that
Correspondence to: R. GarcõÂa e-mail: rgarcia@6000aire.®s.ucm.es
LET
NAO dominated world weather-¯uctuations from 1949 to 1957 and SO dominated from 1949 to 1957 without any strong inter-relationship. Berlage (1966) pointed out a signi®cant correlation between Djakarta pressure and Greenland pressure, ®nding that high pressure over the Indonesia area tends to be preceded by a year's cold winter in northwest Europe. Chen (1982) found that the circulation over the Atlantic only varies when there is high pressure over the eastern South Paci®c. Van Loon and Madden (1981) considered that at the times when SO in¯uences the North Atlantic many other eects can also be involved. Rogers (1984) did not ®nd any simultaneous occurrence of particular modes of one oscillation with those of the other. Barnett (1985) showed orthogonality of the NAO and SO, and Yasumari and Seki (1992) found that NAO plays a crucial role in the timing of the occurrence of the ENSO event. These eight references do not constitute a complete bibliography on the SO±NAO relationship but they show that this relationship, if it exists, must be limited to a temporal scale that does not represent much variance of any of the two oscillations.
3 Indices of the NAO and the SO used in this study To study the relationship between NAO and SO, data were collected from the Climatic Research Unit at the University of East Anglia (UK). Two indices were used. The index of the NAO was the dierence between normalized mean winter (DJF) pressure anomalies at Gibraltar and Reykjavik, Iceland (Jones et al., 1997). The period covered was 1866±1997 and the time series is shown in Fig. 1. Positive numerical values are called ``high NAO'' and are associated to strong zonal ¯ow, whereas negative values (``low NAO'') are associated to weak zonal ¯ow. The index of the SO that we used was the dierence between normalized annual sea level pressure anomalies be-tween Tahiti and Darwing according to the method given by Ropelewski and Jones (1987). Negative values represent SO extremes more related to the El NinÄo phenomenon while positive values represent SO
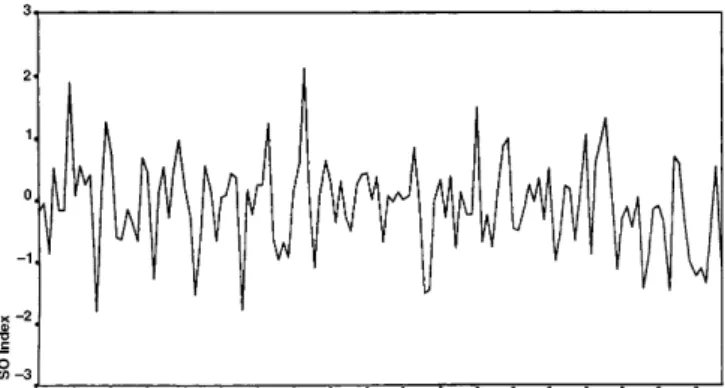
extremes more related to La NinÄa phenomenon. The covered period was the same that for NAO index and the time series is shown in Fig. 2.
4 Method and results
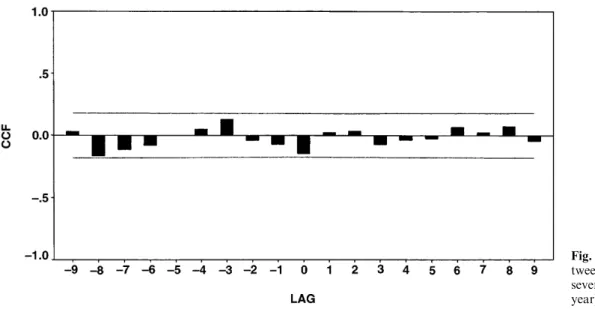
4.1 Cross-correlation between NAO and SO indices The correlations between NAO and SO indices at dierent time lags were examined to determine the association between NAO and SO (Fig. 3). The sign-i®cativity of the cross-correlation was established from the Barlett test (1955). In concordance with other studies (Rogers, 1984) correlations were poor, none of them being signi®cant. This seems to suggest that SO index prior to winter is not signi®cantly associated to the winter NAO index. This is the starting point of our work: to ®nd any temporal scale when both indices are related.
4.2 Cross-spectrum of the temporal series of NAO and SO The cross-spectra (squared coherency (K12) and phase
spectrum) between the NAO and SO series, with and without pre-whitening, are shown in Fig. 4. To com-pute these values a Tukey window (5) was used. To evaluate the signi®cativity of the spectral peaks two dierent procedures were followed: (1) the Jenkins and Watts procedure (1968) was used, applying the Snede-cor's transformation to K12, y = arctgh(K12).
There-fore, the new variable ®ts a normal distribution, from which 95% signi®cativity level was calculated (Fig. 4); (2) a Montecarlo test was used. Therefore, 100 aleatory series with the same characteristics as the original series were built. For each pair of the series the K12 values
were calculated. For every frequency, the average and variance of the 100 squared coherency were computed and the 95% signi®cance level was established (Fig. 4). As can be seen from this ®gure, results suggest common signi®cant oscillation in the time domain of 6±8 years.
Fig. 1. Winter index of the North Atlantic Oscillation (1866±1997) based on the mean normalized pressure dierence between Gibraltar and Reykjavik
Fig. 2. Annual index of the Southern Oscillation (1866±1997) based on the mean normalized sea pressure dierence between Tahiti and Darwing
248 R. GarcõÂa et al.: Are the North Atlantic Oscillation and the Southern Oscillation related in any time-scale?
LET
4.3 Decomposition of the temporal series in their main periodic components
To do this we have combined two methods. Singular spectrum analysis (SSA) is designed to extract as much information as possible from short, noisy time series without prior knowledge of the dynamics underlying the series (Broomhead and King, 1986; Vautard and Ghil, 1989). The method is a form of principal component (PC) analysis applied to lag-correlation structures of time series. SSA is particularly successful in isolating periodic components and trends. It decom-poses time series into oscillatory, trending and noise components and provides reconstructed components (RCs). To analyze the periods of the RCs a method of spectral analysis has to be used. In this article maximum entropy method (MEM) is used (Burg, 1967). MEM diers from other spectral methods by its representation of noisy oscillatory signals as auto-regressive processes, rather than as a sum of sinusoids. The advantage being that is very ecient for detecting frequency lines of stationary time series. The disad-vantage is that for a high number of autoregressive terms the MEM often includes spurious peaks. Due to the fact that we analyze RCs (with low noise) this is not a big problem. A comprehensive description of both methods, SSA and MEM, can be found in the review by Yiou et al. (1996).
From a single view of the original series of SO and NAO indices (Figs. 1 and 2) we cannot infer any clear oscillation. That is why we use SSA to investigate the oscillatory component. SSA considers M-lagged copies of a central time series sampled at equal intervals and calculates the eigenvalues and eigenvectors of their covariance matrix. By analogy with nomenclature from other climatic analysis the eigenvectors are usually called empirical orthogonal functions (EOFs) and the coecients involved in the expansion of each lagged copy of the temporal series, principal components (PC). It is important to notice that an oscillatory phenomenon
could be sometimes represented by one eigenvalue but sometimes by pairs of eigenvalues (Vautard and Ghil, 1989). In this last case both EOFs and PCs are in quadrature with each other.
The ®rst three eigenvalues from higher to lower variance for NAO are related to the 6±8 years' oscilla-tion and account for 24.9% of the total variance. The ®rst two eigenvalues for SO account for 20.7% of the total variance and they are also related to the 6±8 years' oscillation.
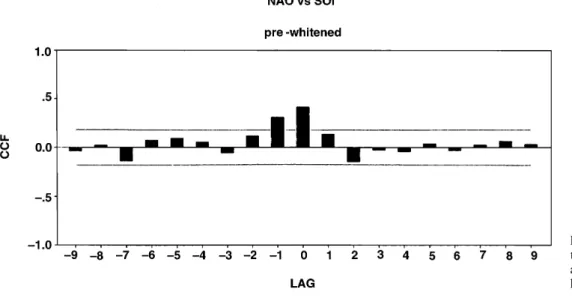
4.4 Cross-correlations between the 6±8 years' RCs of NAO and SO
The correlations between the 6±8 years' RCs of NAO and SO indices at dierent time lags were examined (Fig. 5). Two interesting correlations were found when the whitened RCs were used. This happened for the lag 0 (annual SO vs. winter NAO starting that year) and for the lag-1 (annual SO vs. winter NAO ®nishing that year). However it is important to notice that it is problematic to estimate the signi®cativity of the corre-lations when RCs are used. One way is to argue that the RCs' ®lters eectively link points in the two series that are 2M points apart (M = window size on both series). The decorrelation time could be estimated as 2M, and the number of dofs as N/2M (about six in our study). However this way of calculating signi®cativity is prob-ably overly conservative. The values of the correlations become signi®cant over the 90% con®dence level, even for this over-conservative estimation.
5 Conclusion
Although NAO and SO are almost orthogonal there is a temporal scale (6±8 years) when both alternations of atmospheric mass seem to be related. According to the variance reproduced by these (6±8 years' oscillations it
Fig. 3. Cross-correlations be-tween NAO and SO indices for several time lags (one lag = one year)
LET
Fig. 4. Cross-spectrum (phase spectrum and squared coherency of NAO vs. SOl with and without pre-whitening. In the squared coherency spectrum two signi®cance levels are shown (95%), the lower computed from Jenkins-Watts and the higher from a Montecarlo test (see details in text)
Fig. 5. Cross-correlations be-tween the 6±8 years RCS of SO and NAO for several lags (one lag = one year)
250 R. GarcõÂa et al.: Are the North Atlantic Oscillation and the Southern Oscillation related in any time-scale?
LET
can be concluded that about 20% of the annual SO are related to about 25% of NAO in the winters starting and ®nishing that year. The in¯uence is in the sense that SO extreme values associated to E1 NinÄo phenomenon seem to be related to low NAO (weak zonal ¯ow in the Atlantic and over most of Europe temperature lower than normal and precipitation higher than normal).
Acknowledgement. Topical Editor F. Vial thanks F. Lott for his help in evaluating this paper.
References
Barlett, P. S., Stochastic processes, Cambridge, UK, Cambridge University Press, 1995.
Barnett, T. P., Variations in near-global sea level pressure, J. Atmos. Sci., 42, 178±501, 1985.
Berlage, H. P., The Southern Oscillation and world weather, Med. Verhaudl., 88, 1±152, 1966.
Berlage, H. P., and H. J. de Boer, On the Southern Oscillation, its way of operation and how it aects pressure patterns in the higher latitudes, Geofys. Pura Appl., 46, 329±351, 1960. Broomhead, D. S., and G. P. King, Extracting qualitative dynamics
from experimental data, Physica, D20, 217±236, 1986. Burg, J. P., Maximum entropy spectral analysis. In: 37th Ann.
Intern. Meeting, Soc. Explor. Geophys., Oklahoma City, OK, 1967.
Chen, W. Y., Fluctuations in northern hemisphere 700 mb. height ®eld associated with the Sothern Oscillation, Mon. Wea. Rev., 110, 808±823, 1982.
Hurrell, J. W., Decadal trends in the North Atlantic Oscillation: regional temperature and precipitations, Science, 269, 676±679, 1995.
Jenkins G. M., and D. G. Watts, Spectral analysis and its applications. Holden Day, San Francisco. 1968
Jones, P. D., T. Johnsson, and D. Wheeler, Extension to the North Atlantic Oscillation using early instrumental pressure observa-tions from Gibraltar and South-West Iceland, Int. J. Climatol-ogy, 17, 1433±1450, 1997.
Rogers, J. C., The association between the North Oscillation and the Southern Oscillation in the northern hemisphere, Mon. Wea. Rev., 112, 1999±2015, 1984.
Ropelewski, C. F., and P. D. Jones, An extension of the Tahiti-Darwin Southern Oscillation Index, Mon. Wea. Rev., 115, 2161±2165, 1987.
Trenberth, K. E., General characteristics of EI NinÄo- Southern Oscillation. In: teleconnections linking worldwide climate anom-alies, Cambridge University Press, Cambridge, 1991.
Van Loon, H., and R. A. Madden, The Southern Oscillation. Part I: global associations with pressure and temperature in northern winter, Mon. Wea. Rev., 109, 1150±1162, 1981.
Vautard, R., and M. Ghil, Singular spectrum analysis in nonlinear dynamics with application to paleoclimatic time series, Physica, D35, 395±424, 1989.
Walker, G. T., and W. Bliss, World weather, V. Mem. Roy. Meteor. Soc., 4, 53±84, 1932.
Yasumari, T., and Y. Seki, Role of the Asian Monsson on the interannual variability of the Global Climate System, J. Jap. Met. Soc., 10, 47±58, 1992.
Yiou, P., E. Baert, and M. E. Loutre, Spectral analysis of climate data, Surv. Geophys., 17, 619±663, 1996.
LET