HAL Id: insu-01323350
https://hal-insu.archives-ouvertes.fr/insu-01323350
Submitted on 30 May 2016HAL is a multi-disciplinary open access archive for the deposit and dissemination of sci-entific research documents, whether they are pub-lished or not. The documents may come from teaching and research institutions in France or abroad, or from public or private research centers.
L’archive ouverte pluridisciplinaire HAL, est destinée au dépôt et à la diffusion de documents scientifiques de niveau recherche, publiés ou non, émanant des établissements d’enseignement et de recherche français ou étrangers, des laboratoires publics ou privés.
Distributed under a Creative Commons Attribution - NonCommercial - NoDerivatives| 4.0 International License
INTRUSION OF RECENT AIR IN POLAR
STRATOSPHERE DURING SUMMER 2009
REVEALED BY BALLOON-BORNE IN SITU CO
MEASUREMENTS
Gisèle Krysztofiak, Rémi Thiéblemont, Valéry Catoire, Nathalie Huret,
Sébastien Payen, Fabrice Jegou, Marc-Antoine Drouin, C Robert
To cite this version:
Gisèle Krysztofiak, Rémi Thiéblemont, Valéry Catoire, Nathalie Huret, Sébastien Payen, et al.. IN-TRUSION OF RECENT AIR IN POLAR STRATOSPHERE DURING SUMMER 2009 REVEALED BY BALLOON-BORNE IN SITU CO MEASUREMENTS. 20th ESA Symposium on European Rocket and Balloon Programmes and Related Research, May 2011, Hyères, France. pp.91-98. �insu-01323350�
INTRUSION OF RECENT AIR IN POLAR STRATOSPHERE DURING SUMMER
2009 REVEALED BY BALLOON-BORNE IN SITU CO MEASUREMENTS
Gisèle Krysztofiak (1), Rémi Thiéblemont (1), Valéry Catoire (1), Nathalie Huret (1), Sébastien Payan (2),
Fabrice Jegou (1), Marc Antoine Drouin (1), Claude Robert (1).
1 LPC2E-OSUC, UMR 6115 CNRS-Université d’Orléans, 3A Avenue de la Recherche Scientifique, 45071
Orléans Cedex 2, France, Email: gisele.krysztofiak@cnrs-orleans.fr
2 LPMAA, UMR 7092 CNRS-Université Pierre et Marie Curie, 3 rue Galilée 94200 Ivry sur Seine, France.
ABSTRACT
The SPIRALE (Spectroscopie Infa-Rouge par Absorption de Lasers Embarqués) balloon-borne instrument has been launched twice within 17 days in the polar region (Kiruna, Sweden, 67.9°N - 21.1°E) during summer, at the beginning and at the end of August 2009. In situ measurements of several trace gases have been performed including
CO and O3 between 10 and 34 km height, with very
high vertical resolution (~5 m). The both flight results are compared and the CO stratospheric profile of the first flight presents specific structures associated with mid-latitude intrusion in the lowest stratospheric levels. Their interpretation is made with the help of results from several modeling tools (MIMOSA and FLEXTRA) and available satellite data (IASI). We also used the O3 profile correlated with CO to calculate the proportion of recent air in the polar stratosphere. The results indicate the impact of East Asia urban pollution on the chemistry of polar stratosphere in summer.
1. INTRODUCTION
Arctic atmosphere has been believed to be very clean for long time. Nowadays the polar atmosphere become more and more polluted due to the increase of the pollutant emissions and the long scale transport [1, 2]. Carbon monoxide (CO) is one of these pollutants with a long chemical lifetime (2 months in the troposphere), allowing for a long scale study. Industrial processes, incomplete combustion, biomass burning and methane oxidation are the principal sources of CO in the troposphere and reaction with OH is the main sink. CO plays an important role in the tropospheric oxidation capacity and in the production of
tropospheric ozone, depending on the NOx
quantities. Depending on the latitudes, the typical tropospheric CO mixing ratio can vary from 40 to 200 ppbv [3] with higher values in the northern hemisphere than in the southern hemisphere. Most of the previous studies on the transport of CO across the Pacific Ocean and into the polar
atmosphere used satellite measurements or airborne data [4, 5]. In situ measurements from SPIRALE balloon-borne instrument were used in this study on 7 August and 24 August 2009 near Kiruna (67.9°N-21.1°E) in Sweden. SPIRALE flights were part of the balloon campaign conducted by CNES within the frame of the StraPolÉté project funded by the French agencies ANR, CNES and IPEV, contributing to the International Polar Year. In this paper, the method used to perform this study is summarized in Section 2, Section 3 shows the CO observations made during the two SPIRALE flights, and their intercomparisons with model and satellite data.
2. DATA AND METHODOLOGY 2.1 SPIRALE instrument
SPIRALE (Spectroscopie InfraRouge par Absorption de Lasers Embarqués) is a tunable diode laser spectrometer for in situ measurements of trace gas species from the upper troposphere to the middle stratosphere (~34 km height). A detailed description of the instrument can be found in a previous paper [6]. In brief, the absorption of six lasers takes place between two mirrors distant of 3.5 m in a multipass optical Herriott cell located at the extremities of a deployable mast below the gondola, leading to 434 m of pathlength. SPIRALE has a rapid measurement acquisition (1.1 s), a very good accuracy (3% to 30%, depending on the abundance of the species) and a low detection limit (sub-ppbv levels).
The SPIRALE balloon-borne instrument has flown on 7 August and during the night of 24 to 25 August 2009. During both flights, several species, such as O3, N2O, CH4, HCl, NO2, HNO3 and CO were measured from 10-16 km (depending on the chemical abundances) to 34 km height.
2.2 IASI and TERRA/MODIS satellites
In order to detect the sources of carbon monoxide, we used measurements from IASI (Interféromètre Atmosphérique de Sondage Infrarouge) and
_________________________________________________
Proc. ‘20th ESA Symposium on European Rocket and Balloon Programmes and Related Research’ Hyère, France, 22–26 May 2011 (ESA SP-700, October 2011)
MODIS (Moderate Resolution Imaging Spectroradiometer) instruments onboard METOP and TERRA/AQUA satellites, respectively.
The polar-orbiting MetOp-A, launched on 19 October 2006, is the first of three successive MetOp satellites. The IASI instrument is a nadir-looking high resolution Fourier Transform Spectrometer (FTS). IASI is designed to provide atmospheric temperature and water vapour profiles for operational meteorology. Atmospheric concentrations for several key species important to climate forcing and atmospheric chemistry monitoring can be derived from IASI radiance measurements [7]. In addition, IASI offers an excellent horizontal coverage due to its across track swath width of 2200 km, allowing global coverage twice a day, with a field of view sampled by 2×2 circular pixels each with a 12 km footprint diameter. IASI measures carbon monoxide (CO) on a global scale, twice a day. CO total columns and vertical profiles are retrieved in near real time from the nadir radiance spectra measured by the instrument in the thermal infrared (TIR) spectral range [8].
MODIS [9] detects a wide spectral range of electromagnetic energy at three spatial resolutions every day. We use the fire and thermal anomalies from climate modeling grid fire products at 0.5° resolution. Fire detection is performed using a contextual algorithm [9] that exploits the strong emission of mid-infrared radiation from fires.
2.3 Models
Three models, namely FLEXTRA, REPROBUS and MIMOSA, have been used to calculate air masses trajectories, stratospheric chemistry, and potential vorticity advection, respectively. FLEXTRA [10] is a Lagrangian atmospheric trajectory model, developed at the Institute of Meteorology and Geophysics University of Vienna to compute trajectories from meteorological fields of the European Centre of Medium-Range Weather Forecasts (ECMWF). We used the ERA-interim model fields with horizontal resolutions of 1°x 1°, 60 vertical levels, and with a frequency of 3 hours. Clusters of three-dimensional backward trajectories (which means the three wind components are used) uniformly distributed in a volume of size 0.5°x0.5° along latitude and longitude and 500 m height are used.
Potential vorticity (PV) maps are calculated using the “Modèle Isentrope de transport Méso-échelle de l’Ozone Stratosphérique par Advection” (MIMOSA) contour advection model [11]. This model performs high resolution advection calculations based on the ERA-Interim reanalysis [12] of wind, pressure and temperature fields. MIMOSA initially computes the PV field at a resolution of 1.125° in latitude and longitude (T106) vertically interpolated on an isentropic
surface. This field is then interpolated on an x-y grid centered on the North Pole with a horizontal resolution of 37×37 km (three grid points / degree) and advected with a time step of one hour. To preserve the homogeneity of the field, a regridding of the PV field on the original grid is done every 6 hours. The information on diabatic changes in the PV field at large scales can be extracted from the ERA-Interim fields. In MIMOSA model this is done by applying to the advected field a relaxation towards the ERA-Interim PV field calculations with a time constant of 10 days. This technique allows MIMOSA to run continuously over periods of several months in order to follow the evolution of dynamical barriers and fine scale structures such as vortex remnants and tropical intrusions [13, 14, 15]. REPROBUS 3D chemistry-transport model [16, 17] contains a detailed description of Ox, NOx, HOx, ClOx, BrOx and CHOx chemistry. It calculates the chemical evolution of 55 species using 160 gas-phase reactions and 6 heterogeneous reactions. Reaction rates coefficients are taken from the recommendations of Sander et al. [18]. The photolysis rates are calculated at every time step using a look-up table from the Tropospheric and Ultraviolet visible (TUV) model [19]. REPROBUS model extends from the ground up to 10 hPa, with a vertical resolution varying from less than 1 km near the tropopause level to 2.2 km in the upper part of the stratosphere. The horizontal resolution used for this study is 2° latitude × 2° longitude. Zonally symmetric initial tracer fields were taken from the two-dimensional model described by Bekki et al. [20]. Winds and temperatures (ERA-INTERIM) by the ECMWF were used during the simulation to drive the transport of the stratospheric species and to compute their loss and production rates, respectively.
3. POLAR STRATOSPHERIC CO IN AUGUST 2009 BELOW 380 K ISENTROPIC SURFACE 3.1 Observations
The vertical profiles of carbon monoxide (CO) derived from SPIRALE measurements for both flights are displayed in Fig. 1. The cold point tropopauses were located at 11.78 and 11.34 km height on 7 and 24 August, respectively.
10 11 12 13 14 15 16 17 18 0 10 20 30 40 50 60 70 80 90 CO (ppbv) Alt itu de (k m ) 07 August 2009 Tropopause on 7 August 2009 REPROBUS on 7 August 2009 24 August 2009 Tropopause on 24 August 2009 REPROBUS on 24 August 2009
Figure 1. SPIRALE measurements of CO mixing ratios (in ppbv) with error bars over Kiruna (Sweden) on 7 August (green) and 24 August 2009 (orange) coupled with REPROBUS simulation. The
dashed verticals lines represent the tropopause height for the two flights. The squares represent the
altitudes of the clusters for the backward trajectories.
Although both flights were performed in August 2009 near Kiruna at 17 days interval, the vertical profiles of CO show a very strong difference below 14 km. CO mixing ratios are larger by ~50 ppbv at 11.6 km on 7 August than on 24 August 2009. On 7 August, the profile is mainly characterized by two layers, between 12.6 and 14 km with ~50 ppbv CO and below 12.4 km with ~80 ppbv CO. These ranges of concentrations are characteristic of mid-latitude concentration of CO. On the contrary, the vertical profile of the 24 August appears undisturbed with low values of CO (from 30 ppbv near the tropopause to 20 ppbv near 18 km) typical from polar latitudes
The chemistry-transport model REPROBUS simulates also the different between the two flights. However the comparisons between each vertical profile and the associated simulation reveal strong discrepancies. The layer between 11 and 12.4 km (7 August) is not correctly resolved by the model which underestimates the value of CO. The underestimation of CO is also seen in general on 24 August profile and on the top of the profile on 7 August. Finally, below 11.2 km, the simulation overestimates the CO by 20 ppbv approximately.
This later bias could be improved by correcting the CO emission rate in the model.
The transport model MIMOSA reveals the presence of recent air from mid-latitude nearby Kiruna on 7 August 2009. Fig. 2 shows the intrusion of mid-latitude air, depicted by a low PV values tongue, toward polar latitudes at 340 K and 380 K isentropic surface levels, i.e. ~12 and ~14 km altitudes, respectively. In contrast, the 24 August PV maps point out typical polar air. The intrusion of lower latitude air masses on 7 August partly explains the high anomaly of CO in the vertical profile between 11 and 14 km. This is the reason why the origin of the air masses has to be investigated.
Figure 2. Potential vorticity from MIMOSA on the
340 K and the 380 K levels on 7 August 2009 at 00 UTC (A) and on 25 August 2009 at 00 UTC (B). The white cross shows the location of the flights. 3.2 Origin of air masses
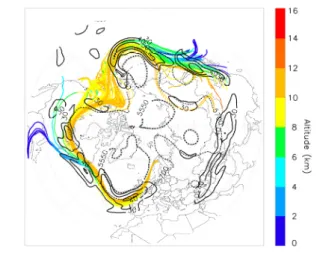
The FLEXTRA model allows us to know the origin of air masses. Ten day 3D backward trajectories are performed (shown in Fig. 3 below) for both flights of SPIRALE for the four clusters shown in Fig. 1. The backward trajectories reveal differences in the origin of air masses between both flights. For the flight on 25 August 2009, air comes exclusively from polar latitudes. For the flight on 7 August 2009, air masses originate from mid-latitudes and in particular from West Pacific ocean and East Asia. Fig. 3 also shows the altitude of the trajectories (using a color code) and reveals that, for the first flight, most of them come from low altitudes (< 6 km), which consequently suggests the presence of a convective area over the Pacific.
Figure 3. Ten day backward trajectories on 7 August 2009 (top) and 25 August 2009 (bottom) for clusters centred at A: 11130 m, B: 11630 m, C: 13130 m and D: 14130 m.
Further analyses of transport are discussed in Section 3.4. We are first investigating the origins of the pollution in the region.
3.3 Anthropogenic and natural sources of CO in Asia:
According to the backward trajectories, the air masses originate from the North East of Asia. So, we investigated the impact of emissions from boreal fires in North-East Russia and the anthropogenic sources from North-East China in the polar air in Kiruna on 7 August 2009.
Figure 4. Carbon monoxide total column from IASI satellite from 27 July 2009 to 2 August 2009. Map
is a polar stereographic projection with the Greenwich meridian at left.
IASI satellite measures the total column of CO
(shown in Fig. 4 in molecule cm-2 from 27 July
2009 to 2 August 2009 (10 to 5 days before the
flight). IASI reveals two areas of strong concentration of CO over North East China and over North East of Russia. Moreover, according to Jiang et al. [21] the CO concentration in the upper troposphere is more important in summer due to strong convection and surface emission. Jin et al. [5] indicated the maximum of CO is located between the equator and 40°N in boreal spring and between 30°N and 50°N in July - August. The migration of the CO belt from spring to summer is due to the northward movement of the subtropical westerly jet. Unfortunately, IASI does not allow to identify the origin of the pollution (anthropogenic and/or fires). So, we decided to use the results of MODIS instrument on the AQUA and TERRA satellites to look for fires as possible causes of CO high levels in the lower polar stratosphere. Fig. 5 shows the detected fires. MODIS detected very strong fires in North East of Russia.
So, two areas with two different pollutions are detected, the first over North-East China and Korea with mostly anthropogenic sources from megalopolises and the second over North-East Russia with strong forest fires sources. According to Jin et al. [5] Asian fossil fuel is the biggest source of upper tropospheric CO over the north Pacific up to 27-30% in the NH summer and biomass burning contribute only for less than 10% to the total CO in the upper troposphere. These source regions of CO pollution are qualitatively consistent with the origin of the backward trajectories for the 7 August 2009 with most of the backward trajectories coming from the megalopolises.
Figure 5. Fire detection by MODIS over East Asia from 27 July 2009 to 2 August 2009 (each red point
symbolizes a fire location).
3.4 Transport of mid-latitude air into the polar stratosphere
Fig. 6 shows the horizontal wind at 200 hPa and the geopotential at 500 hPa on 29 July 2009 coupled with the ten day backward trajectories on 7 August 2009. The strong horizontal wind reveals the presence of the jet stream and the geopotential height reveals the presence of depression and anticyclone areas. The altitude of the backward trajectories reveals that some of the air masses undergo fast vertical transport from western Pacific before entering in the atmospheric circulation via the jet stream. Moreover, the long transport of pollutants from Asia across the Pacific is stronger in boreal spring and summer [5, 21]. Near Europe, the air masses undergo an isentropic transport across the subtropical barrier.
To summarize, after emission at ground by anthropogenic sources and/or fires, air masses containing CO undergo fast vertical transport to the upper troposphere, then cross the Pacific Ocean and the North America along the jet stream and finish by entering the polar stratosphere by isentropic transport.
It is well known [22] that this region, where isentropic surfaces intersect the tropopause, is favorable to the horizontal mixing of stratospheric and tropospheric air. Tracer-tracer correlations are a powerful diagnosis for stratospheric transport and mixing. In particular, we are interested in the O3 -CO correlation in the upper troposphere - lower stratosphere (UTLS) that has also been used in recent studies for transport diagnoses [23, 24].
Figure 6. Ten day backward trajectories for a cluster centred at 11130 m on 7 August 2009 coupled with the ERA-Interim horizontal wind
module (m/s) (solid line) at 200 hPa and geopotential height (m) (dashed-dotted line) at 500
hPa on 29 July 2009.
Fig. 7 shows an example of O3-CO correlations for
two different latitudes. The first one is obtained from a previous balloon flight in June 2005 with the same instrument in a non polar region (Brazil, 5.1°S-42.9°W) and the second one is obtained from the polar flight measurements studied in the present paper. 0 200 400 600 800 1000 1200 1400 1600 1800 2000 0 10 20 30 40 50 60 70 80 90 100 CO (ppbv) O 3 ( p pbv ) 420 K 405 K 390 K 380 K non polar reference correlation
polar reference correlation
mixing lines on the isentropic surfances:
polar stratospheric branch
Figure 7. O3-CO correlation derived from
SPIRALE measurements on 7 June 2005 at Teresina (grey line) and on 24 August 2009 at
Kiruna (black line), the vertical dashed line represents the polar stratospheric branch and the color lines are examples of mixing lines at 420K,
405K, 390K and 380K.
CO is mainly produced or emitted in the troposphere and smoothly decreases with altitude.
Unlike CO, O3 is produced in the stratosphere and
in low concentration in the troposphere. Consequently, without mixing between the stratosphere and the troposphere, the correlation
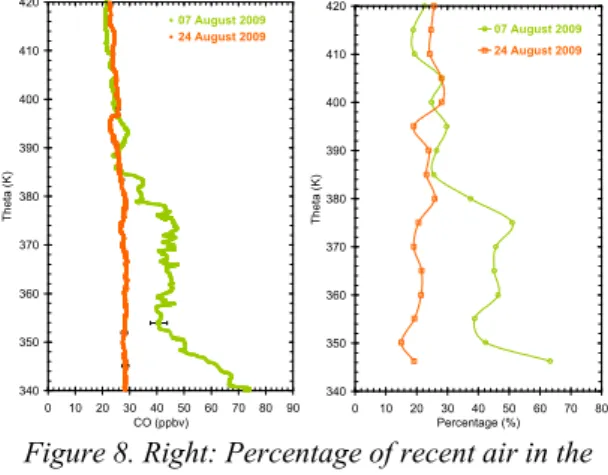
line is called stratospheric branch and the horizontal branch is called tropospheric branch. According to Fisher et al. [25], the mixing between tropospheric mid-latitude air and stratospheric air is represented by mixing lines between the tropospheric and the stratospheric branch. In our case, the transport between the non polar troposphere and the polar stratosphere occurs via the isentropic surfaces and the mixing lines connect the polar stratospheric branch, the polar correlation and the mid-latitude reference correlation at the same isentropic surface level (theta). Fig. 7 shows an example of the mixing line of the isentropic surfaces at 420 K, 405 K, 390 K and 380 K. Then, we can calculate the percentage of tropospheric mid-latitude air that is present in the polar stratosphere for both flights of SPIRALE. For each mixing line at an isentropic surface level (theta) fixed, we made the ratio between the distance polar stratospheric branch polar correlation and the distance polar stratospheric branch and non polar reference correlation. The results are shown in the Fig. 8 as a function of theta and compared with the vertical profile of CO for both flights. The shapes of the profiles are consistent with the proportion of non polar air: more than 40% between 380 K (~14 km) and 345 K (~12 km) for the 7 August 2009 flight compared to ~20% on 24-25 August 2009. 340 350 360 370 380 390 400 410 420 0 10 20 30 40 50 60 70 80 90 CO (ppbv) T het a (K ) 07 August 2009 24 August 2009 340 350 360 370 380 390 400 410 420 0 10 20 30 40 50 60 70 80 Percentage (%) T het a (K ) 07 August 2009 24 August 2009
Figure 8. Right: Percentage of recent air in the mixed parcels sampled by SPIRALE on 7August and on 24 August 2009 over Kiruna (Sweden) as a function of potential temperature, compared to the
corresponding vertical profiles (Left).
4. CONCLUSION AND PERSPECTIVES
SPIRALE balloon-borne instrument observations over North Sweden during the summer 2009 showed a layer of air with very high carbon monoxide concentrations (mixing ratio near 80 ppbv) that is directly coupled with poleward intrusions from the mid-latitude on 7 August 2009. The layer extends over the potential temperature range 380 – 328 K (14 km – 10 km), with the maximum of CO at 330 K (11.5 km) These CO data are consistent with the MIMOSA model showing a region of low PV in the range 340-380 K. The CO
mixing ratio in the range 50 – 80 ppbv is typical of mid-latitude concentration. Backward trajectories at 11130 m and 11630 m from Kiruna revealed that the air had originated 10 days previously from North-East China and North-East Russia. The transport was also analyzed and revealed the important role of the long scale trans-Pacific transport and in particular the role of the jet stream. In this study, only one case was described. However, during the August 2009, there were three other similar phenomena simulated by MIMOSA model, on 21 August, on 26 August and on 28 August 2009. Therefore, the intrusion on 7 August 2009 seems not to be a particular case. The climatology of the intrusions during several summers should be established as well as the impact of Asia pollution on the Arctic regions. Studies have already started, led by several authors, such as Harrigan et al. [4]. They studied the impact of 3 regions of the world, Europe, USA and East China to Arctic by using trajectories model.
Acknowledgements
The authors thank the LPC2E technical team (L. Pomathiod, B. Gaubicher, G. Chalumeau, B. Coûtè, T. Vincent and F. Savoie, ) for the SPIRALE instrument preparation, the CNES balloon launching team for successful operations and the Swedish Space Corporation at Esrange. The ETHER database (Pôle thématique du CNES-INSU-CNRS) and the "CNES sous-direction Ballon" are partners of the project. The Strapolété project was funded by the French "Agence Nationale de la Recherche (ANR-BLAN08-1_31627), the "Centre National d'Etudes Spatiales (CNES), and the "Institut Polaire Paul-Emile Victor" (IPEV). Thanks to Cathy Clerbeaux and her colleagues from Université Paris 6, LATMOS/IPSL, CNRS/INSU, Paris, France for providing the CO total column from IASI instrument.
5. REFERENCES
1. Raatz, W. E. and Shaw, G. E. (1984). Long-range tropospheric transport of pollution aerosols in the Alaskan Arctic. J. Clim.
Appl. Meteorol., 23, 1052–1064.
2. Rinke, A., Dethloff, K., and Fortmann, M. (2004): Regional climate effects of Arctic haze. Geophys. Res. Lett., 31, L16202. 3. Seinfeld, J.H, Pandis., S.N (1998). Atmospheric
chemistry and physics. Wiley-interscience
publication, 1998.
4. Harrigan, D. L, Fuelberg, H. E., Simpson, I. J., Blake, D. R., Carmichael, G. R. and Diskin, G. S. (2001). Transport of anthropogenic emissions during ARCTAS-A: a climatology
and regional case studies. Atmos. Chem.
Phys. Discuss., 11, 5435–5491.
5. Jin, J. J., Livesey, N. J., Jiang, J. H., Lupu, A., Kaminski, J. W. and McConnell, J. C. (2011). Seasonal variation of trans-Pacific transport of carbon monoxide (CO) in the upper troposphere: MLS observations and GEOS-Chem and GEM-AQ simulations.
Atmos. Chem. Phys. Discuss., 11, 3219 3250.
6. Moreau, G., Robert, C., Catoire, V., Chartier, M., Camy-Peret, C., Huret, N., Pirre, M., Pomathiod, L., Chalumeau, G. (2005). A multispecies in situ balloon-borne experiment with six tunable diode laser spectrometers. Appl. Opt., 44(28), 5972-5989, 2005.
7. Clerbaux, C., Boynard, A., Clarisse, L., George, M., Hadji-Lazaro, J., Hurtmans, D., Herbin, H., Pommier, M., Razavi, A., Turquety, S., Wespes, C., and Coheur, P.-F. (2009). Monitoring of atmospheric composition using the thermal infrared IASI/METOP sounder. Atmos. Chem. Phys., 9, 6041– 6054.
8. George, M., Clerbaux, C., Hurtmans, D., Turquety, S., Coheur, P.-F., Pommier, M., Hadji-Lazaro, J., Edwards, D. P., Worden, H., Luo, M., Rinsland, C., and McMillan, W. (2009). Carbon monoxide distributions from the IASI/METOP mission: evaluation with other space-borne remote sensors. Atmos. Chem. Phys., 9, 8317-8330, doi:10.5194/acp-9-8317-2009.
9. Giglio, L., Descloitres, J., Justice, C. O., and Kaufman, Y. J. (2003). An enhanced contextual firedetection algorithm for MODIS. Remote Sensing of Environment,
87, 273–282, and http://modis-fire.umd.edu
10. Stohl, A., G. Wotawa, P. Seibert, and H. Kromp-Kolb (1995): Interpolation errors in wind fields as a function of spatial and temporal resolution and their impact on different types of kinematic trajectories. J.
Appl. Meteor. 34, 2149-2165.
11. Hauchecorne, A., Godin, S., Marchand, M., Heese, B., and Souprayen, C. (2002). Quantification of the transport of chemical constituents from the polar vortex to midlatitudes in the lower stratosphere using the high-resolution advection model MIMOSA and effective diffusivity. J.
Geophys. Res., Vol. 107, No. D20, 8289, doi :10.1029/2001JD000491.
12. Dee, D. P., Uppala, S. M., Simmons, A. J., P. Berrisford, Poli, P., Kobayashi, S., Andrae, U., Balmaseda, M. A., Balsamo, G., Bauer, P., Bechtold, P., M. Beljaars, A. C., van de
Berg, L., Bidlot, J., Bormann, N., Delsol, C., Dragani, R., Fuentes, M., Geer, A. J., Haimberger, L., Healy, S. B., Hersbach, H., Holm, E. V., Isaksen, L., Kallberg, P., Kohler, M., Matricardi, M., McNally, A. P., Monge-Sanz , B. M., Morcrette, J.-J., Park, B.-K., Peubey, C., de Rosnay, P., Tavolato, C., Thepaut, J.-N. and Vitart, F. (2011): The ERA-Interim reanalysis: configuration and performance of the data assimilation system.
Q. J. R. Meteorol. Soc. 137: 553–597.
13. Orsolini, Y.J. (2001): Long-lived tracer patterns in the summer polar stratosphere. Geo. Res.
Let., 28, No. 20, 3855-3858
14. Marchand, M., Godin, S., Hauchecorne, A., F. Lefèvre, Bekki, S., and Chipperfield, M. (2003). Influence of polar ozone loss on northern midlatitude regions estimated by a high-resolution chemistry transport model during winter 1999/2000. J. Geophys. Res,
108(D5), 8326, doi:10.1029/2001JD000906.
15. Huret, N., Pirre, M., Hauchecorne, A., Robert, C. and Catoire, V. (2006). On the vertical structure of the stratosphere at midlatitudes during the first stage of the polar vortex formation and in the polar region in the
presence of a large mesospheric
descent. J. Geophys. Res., 111(D06111),
doi:10.1029/2005JD006102
16. Lefèvre, F., Brasseur, G. P., Folkins, I., Smith, A. K. and Simon P. (1994). Chemistry of the 1991–1992 stratospheric winter: Three-dimensional model simulations. J. Geophys.
Res., 99(D4), 8183–8195.
17. Jourdain, L., Bekki , S., Lott , F. and. Lefevre, F. (2008). The coupled chemistry-climate model LMDz-REPROBUS: description and evaluation of a transient simulation of the period 1980-1999. Ann. Geophys., 26,
1391-1413.
18. Sander, S. P., Ravishankara, A. R., Golden, D. M., Kolb, C. E., Kurylo, M. J., Molina, M. J., Moortgat, G. K., Finlayson-Pitts, B. J., Wine, P. H., Huie, R. E. (2006). Chemical
Kinetics and Photochemical Data for Use in Atmospheric Studies Evaluation Number 15. JPL Publication 06-2.
19. Madronich, S. and Flocke, S. (1999).The role of solar radiation in atmospheric chemistry.
Handbook of Environmental Chemistry (P. Boule, ed.), Springer-Verlag, Heidelberg, 1-26.
20. Bekki, S., and Pyle, J. A. (1993). Potential impact of combined NOx and SOx emissions from future high speed civil transport aircraft on stratospheric aerosols
and ozone. Geophys. Res. Lett., 20(8),
723-726.
21. Jiang, J.H., Livesey, N.J., Su, H., Neary, L., McConnell, J. C., and Richards, N.A.D. (2007). Connecting surface emissions, convective uplifting, and long-range transport of carbon monoxide in the upper troposphere: New observations from the Aura Microwave Limb Sounder. Geo. Res.
Let., 34, doi:10.1029/2007GL030638.
22. Hoskins, B.J. (1991). Towards a PV-θ view of the general circulation. Tellus, 43AB, 27-35. 23. Hoor P., Fischer, H., Lange, L., Lelieveld J.,
and Brunner, D. (2002). Seasonal variation of a mixing layer in the lowermost stratosphere as identified by the CO-O3 correlation from in situ measurements. J.
Geophys. Res., 107.
24. Pirre, M., Pisso, I., Marecal, V., Catoire, V., Mebarki, Y. and Robert, C. (2008). Intrusion of recent air in midlatitude stratosphere revealed by in situ tracer measurements and trajectory calculations. J. Geophys. Res.,
113, D11302, doi: 10.1029/2007JD009188.
25. Fischer H., Wienhold, G., Hoor, P., Bujok, O., Schiller, C., Siegmund, P., Ambaum, M., Scheeren, H.A. and Lelieveld, J. (2000). Tracer correlations in the northern high latitude lowermost stratosphere: Influence of cross tropopause masse exchange. Geophys.