HAL Id: hal-02965033
https://hal.archives-ouvertes.fr/hal-02965033
Submitted on 12 Oct 2020HAL is a multi-disciplinary open access archive for the deposit and dissemination of sci-entific research documents, whether they are pub-lished or not. The documents may come from teaching and research institutions in France or abroad, or from public or private research centers.
L’archive ouverte pluridisciplinaire HAL, est destinée au dépôt et à la diffusion de documents scientifiques de niveau recherche, publiés ou non, émanant des établissements d’enseignement et de recherche français ou étrangers, des laboratoires publics ou privés.
3D morphology and timing of the giant fossil pockmark
of Beauvoisin, SE Basin of France
Aurélien Gay, Michel Lopez, Jean-Luc Potdevin, Valérie Vidal, German Varas,
Alexiane Favier, Nicolas Tribovillard
To cite this version:
Aurélien Gay, Michel Lopez, Jean-Luc Potdevin, Valérie Vidal, German Varas, et al.. 3D morphology and timing of the giant fossil pockmark of Beauvoisin, SE Basin of France. Journal of the Geological Society, Geological Society of London, 2018, 176 (1), pp.61-77. �10.1144/jgs2018-064�. �hal-02965033�
3D morphology and timing of the giant fossil pockmark of Beauvoisin, SE Basin of
1France
2Aurélien Gay1, Michel Lopez1, Jean-Luc Potdevin2, Valérie Vidal3, German Varas4, Alexiane Favier1,5, Nicolas 3
Tribovillard2 4
1 Géosciences Montpellier, UMR CNRS 5243, Université de Montpellier, F-34095 Montpellier, France 5
2 Laboratoire d’Océanologie & Géosciences, UMR CNRS 8187, Université de Lille 1, F-59655 Villeneuve 6
d’Ascq, France 7
3 Laboratoire de Physique, ENS de Lyon, CNRS, Université de Lyon, F-69342 Lyon, France 8
4 Instituto de Física, Pontificia Universidad Católica de Valparaíso, Av. Universidad 330, Valparaíso, Chile 9
5 Géoazur Nice, UMR CNRS 7329, Université de Nice-Sophia Antipolis, F-06560 Valbonne, France 10
* Corresponding author: Aurélien Gay, Géosciences Montpellier, Université de Montpellier, Case 060, Place 11
Eugène Bataillon, 34095 Montpellier Cedex 5, FRANCE. Tel: +33 (0) 4 67144598, E-mail address: 12
aurelien.gay@umontpellier.fr 13
14
Number of words of text: (without abstract, bibliography and figure caption): 8584 15
Number of references: 91 16
Number of figures: 13 17
Abbreviated title: Morphology and timing of a fossil giant pockmark 18
1. Abstract
19The resolution of data acquired over modern seafloors does not allow imaging of the inner features of a 20
fluid seep structure, particularly in the shallow subsurface. In the South-East Basin of France (Drôme), fossil 21
cold seep structures comprising fossil-rich carbonate lenses were identified about 30 years ago within the 22
Oxfordian (Late Jurassic) Terres Noires Formation. These structures were first interpreted as pseudo-23
bioherms related to hydrothermal activity, but comparison with active seep sites on modern margins, 24
together with isotopic analyses led to a re-interpretation involving cold fluids instead. To date, all seep sites 25
have generally been studied individually without considering any link to neighboring or more distant sites. 26
Based on 23 high-resolution stratigraphic logs within the structure coupled to mosaicked aerial 27
photographs from a drone survey, the 19 fluid seep events were correlated in the area, including two new 28
sites exposed due to weathering. We have shown that each identified sub-site is composed of sub-vertically 29
stacked fossil-rich carbonate lenses interbedded with marls, which developed in smooth, 4 to 6 m deep 30
depressions beneath the local seabed. The nodules present within the depressions are of primary 31
importance as they mark the area of active seeping. This general organization is very similar to the modern 32
Regab giant pockmark in the Lower Congo Basin where only a few sub-sites are active at the same time. A 33
spatio-temporal 3D reconstruction of the position of these sub-sites shows that the carbonate lenses are 34
organized into clusters comprising up to 7 sub-sites grouped together in the same stratigraphic interval and 35
the same geographic zone. A sandbox experiment where gas is injected at constant flow rate at the base of 36
a box filled with a matrix of water-saturated grains displays a pattern consisting of disturbed sediments 37
inside a parabolic-shaped area. This parabolic shape was also identified on a seismic profile across the 38
Regab giant pockmark, suggesting that the processes are similar for the Beauvoisin and Regab seep areas. 39
The laboratory experiments also show that the seeping conduit is stable during a given period of time and 40
suddenly shifts laterally. It is mainly due to the collapse of the conduit, the lateral migration and the 41
reopening at a new position. The general log obtained in the Beauvoisin seep area suggests a similar 42
pattern with periods of seeping alternating with periods of quiescence, each of which is approximately 200 43
ka. Even if a pockmark seems to have been inactive for a long period of time, it could be due to the lateral 44
shift of the feeder conduit meaning that the sub-seafloor is still charged in gas. This is of primary 45
importance for risk assessment, hydrocarbon exploration and general understanding of geobiology at 46
seafloor seeps. 47
200 words short abstract: 48
In the SE Basin of France (Drôme), fossil cold seep structures made of fossil-rich carbonate lenses were 49
identified in the Oxfordian (Late Jurassic) Terres Noires Formation about 30 years ago. To date, all seep 50
sites have generally been studied individually without consideration of any link to neighboring or more 51
distant sites. Based on a detailed fieldwork in the Beauvoisin area and comparison with the modern, active 52
giant Regab pockmark and sandbox experiments, we suggest that this site can now be considered as a 800 53
m wide fossil analogue of a giant pockmark. It comprises several 4-6 m deep, 80-120 m wide coalesced sub-54
seep sites. A spatio-temporal 3D reconstruction of the position of these sub-sites shows that the carbonate 55
lenses are organized in clusters with only one cluster active at a given period. Two periods of seep activity 56
are separated by a period of quiescence due to the lateral shift of the feeder conduit beneath the 57
structure. This suggests that even if a seafloor pockmark appears to be inactive, this could be due to the 58
lateral shift of the feeder conduit meaning that the sub-seafloor is still charged in gas. 59
2. Introduction
60Hydrogen sulfide and methane that sustain highly specialized chemosynthetic-based ecosystems in cold 61
seep environments have been recognized in many modern basins worldwide (Campbell, 2006; Amano et
62
al., 2010; Teichert and Van de Schrootbrugge, 2013) and in the fossil record in the early Cenozoic - 63
onwards (Campbell et al., 1995b; Kiel and Little, 2006; Kiel, 2010; Vrijenhoek, 2013). Sulfide and methane 64
release results in carbonate precipitation forming lenses encased in surrounding limestones or marlstones 65
(Campbell et al., 2002). These fossil organism-rich, authigenic, carbonate rocks developed at the seafloor 66
where oil and/or gas migrated from an underlying network of focused fluid flow in sedimentary basins 67
(Bohrmann et al., 1998; Aloisi et al., 2000; Aloisi et al., 2002). The fossils dominated by lucinid bivalves 68
generally show larger dimensions than at other sites as they rely on chemotrophic symbionts for nutrition 69
(Paull et al., 1992). This biogeochemical process mainly relies on anaerobic oxidation of methane (AOM) 70
(Boetius et al., 2000), where the symbiotic consortia of sulfate-reducing bacteria and methanotrophic 71
archaea use both sulfate and methane for their metabolism and biomass synthesis, thus supplying energy 72
and nutriments to their hosts (Knittel and Boetius, 2009; Deusner et al., 2014). However, fossil-rich 73
carbonate assemblages have always been considered as individual seep sites without comparing their 74
distribution to the geometrical organization of modern clusters of seep sites. This lack of connection 75
between isolated seep sites can be due 1) to poor outcrop conditions or stratigraphic uncertainty 76
(Natalicchio et al., 2015), or 2) to the large size of modern pockmarks that are several hundred meters in 77
diameter and a few meters only in depth (typically 500-800 m wide and 5-80 m deep) leading to difficult or 78
incorrect correlations in the field (Gay, 2002; Stewart, 2015). To date, a fossil giant pockmark has never 79
been identified nor characterized at outcrop, although some microbial assemblages have been 80
reinterpreted in the light of examination of modern hot vents at mid-ocean ridges and cold seeps at 81
continental margins (Whiticar, 1999; Gay et al., 2006). This is the case for the fossil seep sites in the 82
Jurassic limestones of Beauvoisin in the SE Basin of France, which were first interpreted as hydrothermal 83
vents (Rolin, 1987; Gaillard et al., 1996) and then reinterpreted as cold seeps (Peckmann et al., 1999; Kiel,
84
2013). The Beauvoisin seep site is of high importance as it is one of the few worldwide examples that is 85
equivalent to Cenozoic chemosymbiotic-related fossil sites (Campbell et al., 1995a; Louis-Schmid et al.,
86
2007). All seep sites have been generally studied individually without consideration of any link to 87
neighboring sites even those situated in more distant locations (Louis-Schmid et al., 2007). Furthermore, in 88
the fossil record isolated carbonate lenses or -groups of small-scale carbonate lenses, about 10 m wide and 89
5 m high, have often been considered as individual pockmarks or as a field of pockmarks respectively 90
(Agirrezabala et al., 2013). 91
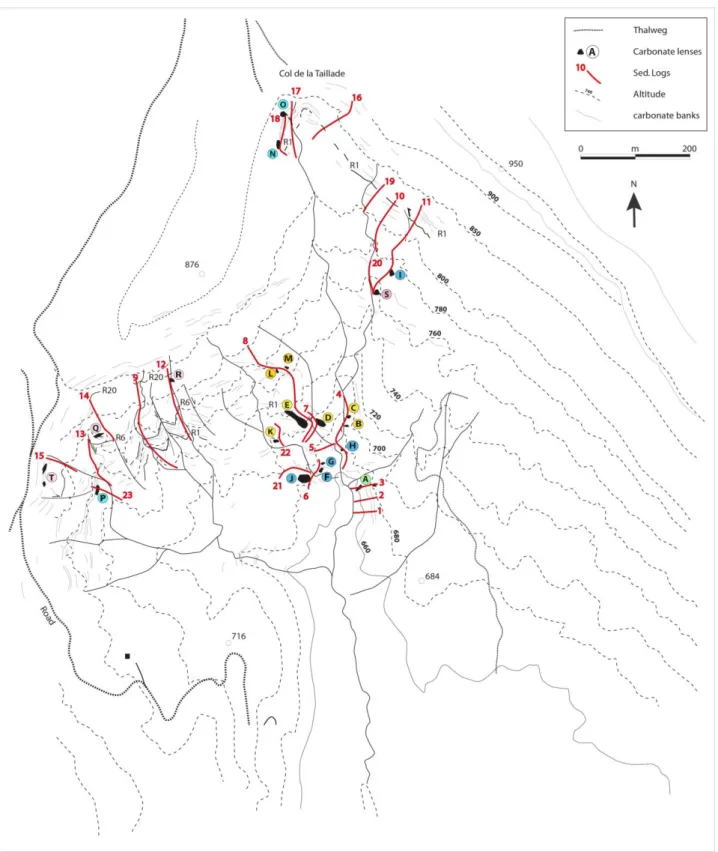
The aim of this paper is to characterize the 3D architecture of a 800 m-wide cluster of fossil seep sites at 92
Beauvoisin in the SE Basin of France, in the vicinity of Buis les Baronnies and Propiac (Drôme) (Fig. 1), based 93
on the correlation of detailed sedimentological logs, sampling of key seep features such as carbonate 94
lenses, marls, nodules and related petrographical and geochemical analyzes. The Beauvoisin architecture is 95
then compared to that of the Regab giant pockmark in the Lower Congo Basin and to sandbox and 96
numerical models simulating fluid injection at the base of a box filled with a matrix of water-saturated 97
grains. 98
3. Methods and data
99Since the first studies of the Beauvoisin site conducted in the 80's (Gaillard et al., 1985; Rolin, 1987, Rolin
100
et al., 1990), recent erosion has exposed new sites and to date, 19 embedded carbonate masses (sub-sites 101
A to T, see Fig. 2 for location) have been identified at various positions in the stratigraphic record, using the 102
initial nomenclature of Rolin (1987). This suggests that all sites are not cropping out due to vegetal cover 103
and agricultural fields and some sub-sites are probably still to be found. In order to define precisely the 104
stratigraphical relationship between the encasing fine-grained marls and the fossil-rich carbonate units, 105
twenty-three stratigraphical logs were obtained through the entire area using a Jacob's stick, between 2002 106
and 2016. The precision is about 2 cm for each log. Field analysis of the Beauvoisin unit comprises 107
identification of major stratigraphic and sedimentological features. The general correlation is related to the 108
Tethyan sequences (Gradstein et al., 2012) and some key layers were easily identified (Fig. 3), such as the 109
few cm-thick bentonite layers documented by Pellenard, (2003), or the sub-continuous 10 cm to 1 m thick 110
layers of massive carbonate layers R1 to R20 of the Argovian sequence identified by Gaillard et al. (1992). 111
This study is then based on the analysis of the macroscopic fabric of carbonate lenses related to the 112
reference layers in the surrounding marls of the "Terres Noires" Formation. Sampling for petrographical, 113
mineralogical and geochemical analyses of the carbonate deposits was carried out on steep slopes in marls. 114
Where thalwegs were not accessible for sampling or mapping, a drone was used for high-resolution 115
photography. The obtained mosaics were coupled to aerial photographs and then georeferenced to 116
topographic maps (IGN map #3140ET) in order to establish the areal distribution of outcrop (Fig. 2). 117
Analyses were conducted at the University of Barcelona for C and O isotopes. Forty-eight microsamples 118
were prepared after the petrographic study to determine the carbon and oxygen stable isotope ratio of the 119
different cements using the standard technique of Craig and Gordon (1965) and Claypool et al., (1980). The 120
CO2 was extracted from 60±10 µg of powdered carbonate samples which were reacted with 103% 121
phosphoric acid for 2 min at 70° C for calcites. The CO2 was analyzed using an automated Kiel Carbonate 122
Device attached to a Thermal Ionization Mass Spectrometer Thermo Electron (Finnigan) MAT-252. The 123
results are precise to ±0.02‰ for δ13C and ±0.04‰ for δ18O. 124
The general organization of the fossil seep sites of Beauvoisin was then compared to the modern and active 125
Regab pockmark in the Lower Congo Basin (Ondreas et al., 2005; Gay, 2002; Gay et al., 2006; Marcon et
126
al., 2014). Bathymetry and imaging data were acquired during various surveys between 1999 (ZAIANGO) 127
and 2011 (WACS) using IFREMER's remotely operated vehicle (ROV) Victor 6000. The first survey was 128
conducted during a site exploration and mosaicking at about 2 m above the sea-bottom. The main survey 129
was then conducted from 30 m above the seafloor using a Reson Seabat 7125 multibeam echosounder 130
(MBES) running at 400 kHz. 131
The sandbox model consists of a Plexiglas cylindrical tank (24 cm diameter) for the 3D and a vertical Hele-132
Shaw cell (glass plates 40 × 30 cm, separated by a 2 mm gap) for the 2D laboratory experiments. Both 133
systems are filled with particles immersed in water and a constant flow of air, 𝚽, is injected from a single 134
inlet centered at the base of the cell. The particles are polydispersed, spherical glass beads (Sovitech glass 135
spheres), sieved to obtain four batches with particle diameters d = 218 ± 17, 318 ± 44, 631 ± 37, and 802 ± 136
68 μm. The grain size distribution for the different batches is measured by means of a microscope (Optika 137
B-163) and roughly displays a Gaussian shape (Ramos et al., 2015). In the 2D experiment the grain
138
dynamics are tracked by analyzing the absolute difference in the intensity of two consecutive images, 139
which gives access to regions where motion occurred in the immersed granular layer, due to the ascending 140
gas flow. In order to quantify the generation of the fluidized zone, which corresponds to a cumulative 141
process due to the continuous gas emission, we define the normalized flow density, computed as the 142
cumulation of successive image differences (Ramos et al., 2015; Varas et al., 2015; Poryles et al., 2016). 143
This variable makes it possible to quantify the regions where motion occurred (disturbed particles). 144
4. Geological setting
145The Beauvoisin seep site is located in the northern part of the South East Basin of France (Fig. 1) which is 146
related to the Jurassic opening of the Liguro-tethyian Ocean (Lemoine 1985). From the Hettangian to the 147
Bathonian the basin was a shallow-water carbonate platform with frequent subaerial exposure or erosion 148
indicating a stable margin with a low rate of subsidence. From the Bathonian, sedimentation compensated 149
for the moderate subsidence of the southern platform and environments remained shallow, whereas along 150
the northern platform cherts and organic-rich marls indicate a general deepening of at least 600 m 151
(Dardeau, 1988). From the Oxfordian, general subsidence affected the entire platform, moderate in the 152
southern part (reefal facies and confined environments) and increasing in the northern part (deep marl 153
facies and submarine slides). 154
In the Beauvoisin area the identified seep sites occur in the deepest, central part of the basin where the 155
subsidence was at a maximum from the Bathonian to the Oxfordian (Gaillard et al. 1985). This led to 156
deposition of up to 2000-2500 m of organic-rich marls called the "Terres Noires" Formation, limited to the 157
North by the Jura high, to the West by the Cevennes domain and to the East by the Briançonnais domain of 158
the Western Alps (Fig. 1). The "Terres Noires" Formation has also been identified in boreholes in the south 159
in Camargue and Provence (Dardeau, 1988). Subsidence was mostly due to basement faults with 160
kinematics controlled by salt withdrawal in the extensional domain of the margin (Mascle et al, 1988). The 161
fluid seep sites are bounded to the west by major salt-rooted faults which facilitated growth of the main 162
salt diapirs into the marls, as at Propiac and Condorcet (Fig. 1). 163
The "Terres Noires" Formation is divided into three main intervals corresponding to the three major 164
geodynamical episodes that affected the margin (Gaillard et al., 1985; Gaillard et al., 1988; Rolin, 1987;
165
Rolin et al., 1990). The Bathonian sequence is characterized by marls alternating with thin mudstone 166
layers. The Callovian to Middle Oxfordian sequence is dominated in the lower part by cm to pluri-cm thick 167
dolomudstones and in the middle and upper part by marls containing isolated red to grey nodules 168
("Nodules Chocolat" by Artru, 1972). The upper Oxfordian is composed of marls alternating with pluri-cm 169
to m thick dolomudstones layers in a general thickening upward sequence. The transition to the 170
Kimmeridgian is marked by the Argovian sequence composed of thick amber dolomudstone layers 171
alternating with light brown marls. 172
To date the origin of focused fluids has never been clearly elucidated. They were hypothetically related to 173
crustal faults (Lemoine, 1988), to halokinesis (Mascle et al, 1988) or to biogenic origin derived from the 174
decomposition of organic matter contained in the "Terres Noires" Formation (Gaillard et al., 1996). 175
Fluorescence conducted on fluid inclusions coupled to stable carbon isotope analyses have shown the 176
presence of oil containing n-alkanes generated from thermal maturation of organic matter from the 177
sedimentary pile (Peckman et al., 1999). The latter is consistent with the total thickness of the "Terres 178
Noires" Formation which has clearly reached a burial depth through the oil window in the lower part. 179
5. Log correlations
180The fossil-rich carbonate suite of Beauvoisin crops out within the thick succession of well-stratified Jurassic 181
marls of the "Terres Noires" Formation in the Lower to Upper Oxfordian interval (Gaillard et al. 1985). 182
Between 2002 and 2016, 23 stratigraphical logs were collected allowing a detailed correlation of the 19 183
sites (A to T) related to the general stratigraphy of the Oxfordian marls (Fig. 2). All sites are concentrated 184
west of Beauvoisin and south of the "Col de la Taillade" (Fig. 2) where they are exposed in very steep 185
valleys between 660 m and 870 m altitude. This work is based on the initial nomenclature established by 186
Gaillard et al. (1985) and Rolin (1987). They grouped together carbonate lenses in sites from A to R (Rolin
187
et al., 1990). The intense weathering in spring and fall in the region for the last 30 years allowed 2 new sites 188
to be exposed in the Terres Noires Formation. The sites S and T were integrated into the general 189
stratigraphy of Beauvoisin in Logs 11 and 15, respectively (Fig. 2). 190
The 23 stratigraphical logs were constrained using key layers, R1 to R20 following the nomenclature of 191
Gaillard et al. (1985) and Rolin (1987). However, additional layers (not displayed in this study) were also 192
used following Gaidon (1988), Pellenard et al. (1999) and Pellenard et al. (2003). This included the 193
identification of a bentonite layer, located at about 220 m above the bottom of Log 1 (Fig. 3), which is the 194
reference for all measurements in this study. Some cm-thick ochre and gypsum-rich layers were also 195
recognized in the area. They can be correlated over all the basin and mark some regional events (Pellenard
196
et al., 1999). The correlation is centered and flattened on the R1 level corresponding to the base of the 197
Argovian sequence ending on top with the R6 level. It is characteristic of the upper part of the Oxfordian in 198
the SE Basin of France and it is composed of dm to m, yellowish to light brown, limestones alternating with 199
light grey marls and claystones. 200
It is worth noting that the thicknesses of the Argovian sequence varies by a factor of 3 to 4 over a distance 201
of 700 m which is the longest distance between two logs in the area. For instance, this is the case for the 202
R2-R6 interval which is about 110 m thick in log 16 (North), 60 m thick in log 8 (centre of the area), 30 m 203
thick in log 9 (West) and 90 m thick in log 13 (South West) (see Fig. 2 for location). In particular, log 9 204
shows evidence of intense deformations due to slumps at 260 m and 275 m (Fig. 3). The thickness 205
variations in the Argovian sequence could be due to syn-to-post depositional erosion or slump processes 206
which increase towards the centre of the area. 207
Based on the log correlation it is then possible to generate a composite log taking into account the eroded 208
missing sequences, slump deposits and faults (Fig. 4). When varying laterally, the thickest part of a 209
sequence was kept in order to correspond to the 360 m total thickness of the studied Oxfordian interval. 210
On this composite log, the oldest site A is located within the Cordatum Zone (Lower Oxfordian) whereas the 211
youngest site T is in the Bifurcatis Zone (Upper Oxfordian). Given the uncertainty of absolute dating in the 212
Jurassic, the Tethysian sequences and age model from Gradstein et al. (2012) are reported on the right side 213
as an indication only. It shows that only two sites (A and S) developed in the Cordatum Zone corresponding 214
to the Lower Oxfordian whereas most sites developed in the Plicatilis Zone (B, C, D, E, F, G, H, I, J, K) and in 215
the Transversarium Zone (L, M, N, O, P, Q, R, T) that are Middle Oxfordian in age and only 2 sites (R and T) 216
developed in the Bifurcatis Zone corresponding to the Upper Oxfordian (Fig. 4). Given an average rate of 217
sedimentation and a constant compaction rate within the interval, 310 m were deposited in 3.1 Ma 218
between 157,4 and 160,5 Ma. The base of site A1 at 15 m and the top of site T at 359 m can be estimated 219
at 157.14 Ma and 160.58 Ma respectively as a first approximation. Despite 15 years of fieldwork in the 220
area, no more sites have been discovered beneath site A or above site T. However, it does not mean that 221
they do not exist as they may have not been exposed yet, like the newly discovered sites S and T. To date, 222
the sites A to T can be estimated for a total of 3.44 My in duration with an average rate of 10 cm per 1000 223
years of sedimentation. 224
6. Vertical organization of seep facies
225The 19 sites A to T correspond to carbonate lenses encased in marls or claystones and forming local 226
unconformities in the Terres Noires Formation. Each site taken individually is organized as sub-vertically 227
stacked, 2-15 m wide, lenses that are in contact (i.e., the top of an underlying lens is in sharp contact with 228
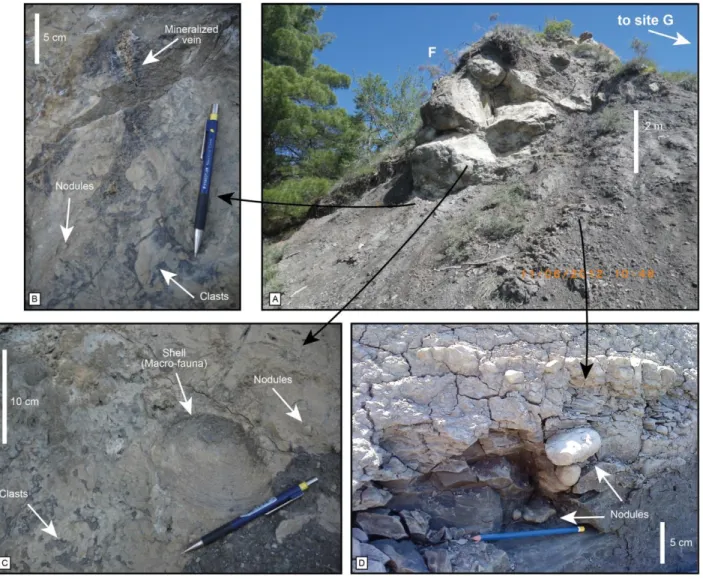
the bottom of the overlying lens) or interbedded with marls. As for sub-site F (Fig. 5A), the three basal 229
carbonate lenses, 1 to 1.5 m thick and 5 m wide, are in contact with each other and the two top carbonate 230
lenses, 0.5 to 1 m thick and 3 m wide, are interlayered with a 0.8 to 1 m thick interval of nodule-rich marls. 231
Sub-site F forms a 7 m high edifice composed of sub-vertically stacked carbonate lenses, lenticular in shape. 232
The two first basal lenses are brecciated showing various-size, cemented, sub-angular clasts (Fig. 5B). In 233
detail, two major types of breccia were identified: 234
> A matrix-supported cemented macro-breccia made up of cm to dm sub-angular and microsparite clasts 235
within a yellowish or light brown microbial carbonate matrix. 236
> A dark brown cement-supported micro-breccia made up of mm to pluri-mm clasts within a slightly oil (or 237
bitumen) impregnated matrix. 238
This brecciated facies is in close association with sub-vertical mineralized veins (Fig. 5B). The veins are filled 239
by several generations of carbonate cement. The first generation is an iron-rich drusy calcite, 20-300 mm 240
thick followed by bladed, high Mg-calcite or aragonite and then by 550 mm of botryoidal aragonite forming 241
the final cement generation (Peckman et al., 1999). The matrix-supported cemented macro-breccia 242
comprises clasts, the shape of which is concordant with the massive matrix of the carbonate lenses 243
suggesting a puzzle-like structure (Fig. 5B&C). The dark brown cement-supported micro-breccia is more 244
concentrated towards the veins and at some places surrounding the mineralization. 245
The carbonate lenses are dominated by mollusk macrofossils mostly represented by lucinid bivalves 246
Beauvoisina carinata (Gaillard et al. 1985, Rolin et al., 1990; Gaillard et al., 1992), gastropods including 247
Paskentana umbilicata, Hokkaidoconcha novacula (Kiel, 2013) and cephalopods such as ammonites (Rolin
248
et al., 1990). Lucinids are usually restricted to carbonate lenses and they are not found in surrounding 249
marls suggesting that they were endofauna. They can form dense groups with some lucinid specimens 250
reaching 18 cm in diameter (Rolin, 1987). The shells provide average positive δ13C values as high as +5 ‰ 251
PDB (Peckman et al., 1999), probably due to symbiosis with chemosynthetic bacteria (Rolin et al. 1990;
252
Gaillard et al. 1992). However, the δ13C values range between -26.5 ‰ to +13 ‰ PDB in carbonate lenses 253
(Peckman et al., 1999), which is consistent with the more recent values measured at site F by Tribovillard
254
et al. (2013) (-18.8 ‰< δ13C<+12.7 ‰ PDB). In the basal lenses of site F, some lucinid specimen, 12 to 15 255
cm wide, were observed very close to the brecciated facies and mineralized veins (Fig. 5C). Some other 256
species have been identified, such as crustacean exoskeletons, fragments and coprolites, belonging to the 257
form-genus Favreina and attributed to the anomuran superfamilies Thalassinoidea and Galatheoidea, as 258
well as fish teeth (reflecting the presence of additional predators or scavengers), sponge spicules and the 259
irregular echinoid Tithonia oxfordiana (Gaillard et al., 1985; Gaillard et al., 1992; Senowbari-Daryan et al., 260
2007; Kiel et al., 2010; Gaillard et al., 2011). Probable deposit feeders, such as holothuroids (Sclerites), and 261
suspension feeders, such as crinoids (ossicles), are found in minor abundance (Gaillard et al., 2011). 262
Benthic foraminifers (such as Spirillinidae, Nodosariidae, Textulariidae and Ophthalmidium), ostracods, 263
planktonic foraminifers (proto-globigerinids), radiolarians and dinoflagellates are present but less 264
numerous. Sponges are also frequent, mainly Lyssacid hexactinellids, accompanied by Lithistid 265
demosponges, unidentified demosponges and lychniscid hexactinellids (Gaillard et al., 2011). These biota 266
are common in the Jurassic seafloor in the area suggesting a bathyal environment estimated around 600 m 267
water depth (Tribovillard et al, 2013). Ovoid to irregularly shaped fecal pellet concentrations locally 268
scattered in the micrite indicate benthic activity (Gaillard et al., 1985, Gaillard et al., 1992; Gaillard et al., 269
2011). 270
The Oxfordian seep carbonates are very rich in micritic nodules, mm to 15 cm in diameter depending on 271
their position relative to carbonate lenses (Fig. 5D). These concretions formed around body fossils, such as 272
ammonites, bivalves, spicules and any biodetritus or burrows (Gaillard et al, 1985; Rolin, 1987). Nodules 273
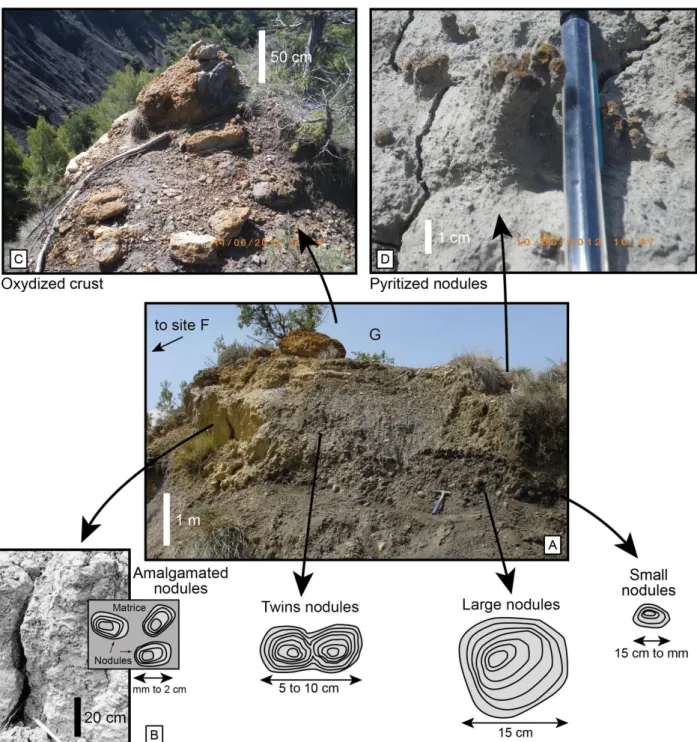
are darker than the micritic matrix and are densely packed within the basal carbonate lenses where they 274
form mm to 2 cm aggregates encased in a dark micrite (Fig. 6A). They contain framboidal pyrite, 40 to 250 275
mm in diameter, and are often lined by an outer rim of pyrite (Peckman et al., 1999; Gay, 2002). The δ13C 276
values in nodules range between -26.5 ‰ and -22.8 ‰ PDB (Peckman et al., 1999), with minimum values 277
similar to the encasing carbonate lenses. They become scattered towards the margins and they can form 5 278
to 10 cm-long twin nodules where the carbonate lenses thin (Fig. 6B). Twin nodules are separated from 279
each other over a distance between a few dm to about 1 m. These nodules appear at the same 280
stratigraphical level as 15 cm-large nodules separated from each other by a few dm to a few meters (Fig. 281
6B). Other small nodules, 15 cm to mm in diameter can be found at the same stratigraphical level over a 282
distance of 30 to 60 m from the centre of the carbonate lens (Fig. 6B). However, their diameter decreases 283
as the distance to each other increases with distance from the carbonate lens. Beyond 60 m from the 284
carbonate lens, they fully disappear. Bitumen is frequent within the nodules encased in marls and not in 285
nodules encased in carbonate lenses. Other types of concretions related to sponge taphonomy and 286
burrowing were locally described by Gaillard et al. (2011). 287
The carbonate lenses are composed of a micritic matrix rich in Mg-calcite, aragonite and dolomite, which 288
are the common authigenic minerals at cold seeps (Roberts et al. 1993). Previous analyses conducted on 289
marls show δ13C values ranging between -19 ‰ to -17.7 ‰ far from the carbonate lenses (Peckman et al.,
290
1999). These values increase close to the carbonate lenses (-0.7 ‰<δ13C<+1.1 ‰), which was also reported 291
by Tribovillard et al. (2013). In addition, different types of carbonate cements were identified, such as 292
splayed calcite, yellow calcite and botryoidal aragonite and calcite (Beauchamp and Savard 1992). In 293
particular, the botryoidal fabric is presumed to be of bacterial origin (Roberts et al. 1993), with values of 294
δ13C between -14.8 ‰ to -12 ‰ (Peckman et al., 1999) reinforcing the role of microbial mediation in the 295
building of carbonate lenses. 296
The top of the upper lens of many sub-sites is affected by pervasive corrosion creating vugs and irregular 297
surfaces. Such as on top of sub-site G (see Fig. 2 for location), the corrosion formed a pluri-cm thick Mn- 298
and Fe-rich crust (Fig. 6C), which is often associated with pyrite. Remnant pyrite-encrusted micrite nodules 299
can be found in overlying marls for a few cm to a few dm above the oxidized crust (Fig. 6D). 300
7. Seeping sub-sites
301The sub-site A is one of the more recognizable sub-seep sites of the Beauvoisin area (See Fig. 2 for 302
location). It was first described as a columnar structure, different from other sub-sites B to T considered as 303
lenticular (Gaillard et al, 1985; Rolin, 1987). However, the outcrop conditions with steep flanks of the 304
Terres Noires did not give access to sub-site A until we used climbing ropes and harnesses. Sub-site A is 305
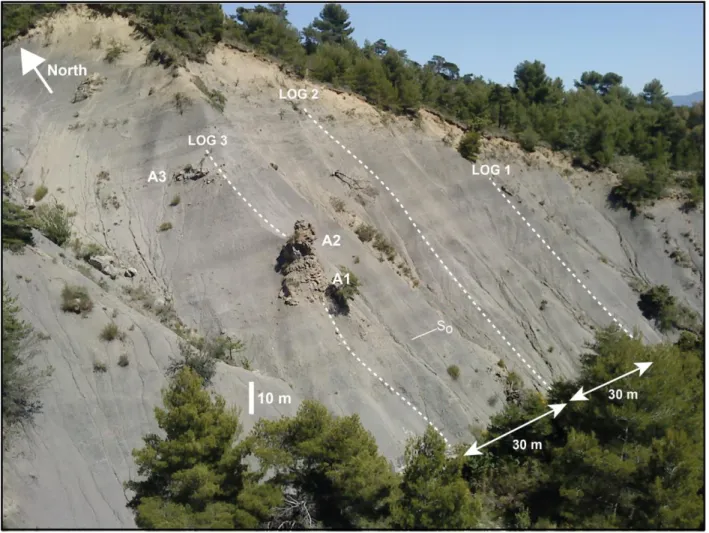
composed of lenticular carbonate lenses that are currently intensively eroded by present-day weathering 306
(Fig. 7). All carbonate lenses that are in sharp contact with each others are considered as one unit. In 307
consequence, 3 main units can be defined, forming sub-sites A1, A2 and A3, respectively from base to top. 308
In terms of stratigraphic position, sub-sites A1 to A3 are Lower Oxfordian in age (See Fig. 3 for the log 309
correlation), belonging to the Cordatum Zone at about 160.5 Ma (See Fig. 4 for age estimation). Three 310
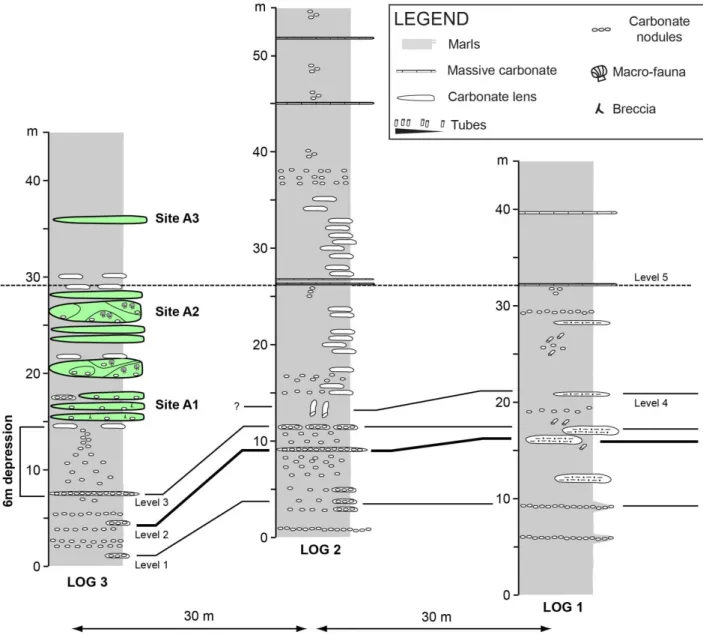
high-resolution stratigraphic sections were obtained in the area. Logs 1 and 2 are located respectively 60 m 311
and 30 m south-east of the sub-sites A1 to A3, whereas log 3 follows the crest descending through the 3 312
sub-sites A1 to A3 (Fig. 7). At this scale, relevant levels 1 to 5 can be visually correlated from log to log 313
following the general stratigraphy (S0). Levels 1 to 4 correspond to aligned nodules following the general 314
stratigraphy whereas level 5 is a pluri-cm thick layer of mudstone. All sections were flattened on level 5 315
located on top of sub-site A2 in log 3 (Fig. 8). The first remarkable feature is that all levels are at the same 316
topographic level in logs 1 and 2, but levels 1 to 3 are located 4 to 6 m beneath the general stratigraphy at 317
the base of log 3. Despite our efforts, level 4 cannot be identified in log 3 directly beneath sub-site A1. All 318
levels, including the flat level 5, are marked by a decrease in nodule concentrations from log 3 to log 1. The 319
number of nodules per volume of marls is markedly reduced beyond log 1 (i.e., beyond 60 m) and the 320
nodules almost fully disappear beyond 70-80 m, e.g. at Site G (see Fig. 6). 321
8. Comparison with an active seep site
322Sub-seeps were previously identified at the bottom of the Regab giant pockmark in the Lower Congo Basin 323
(LCB) where a 800 m wide and 15 m deep depression at about 3150 m water depth has been documented 324
(Gay, 2002; Ondreas et al., 2005). The average slope is about 2 to 3° compared to the surrounding seafloor. 325
The detailed microbathymetry was obtained onboard the ROV-Victor 6000 during the ZAIROV 2 and 326
BIOZAIRE cruises in 1999-2000. The first observations show that the giant pockmark is composed of several 327
depressions, each about 100 m wide and 6 m deep (Ondreas et al., 2005). In detail the small-scale 328
depressions are not homogeneously distributed at the bottom of the pockmarks (Fig. 9A). The deepest two 329
depressions are located near the centre of the Regab pockmark field. They are marked by steep flanks with 330
an angle of about 5° compared to the horizontal plane, locally reaching 7° if compared to the regional slope 331
whereas other small-scale depressions have smoother slopes with an angle of about 1 to 2° (Fig. 9B). They 332
all have a flat bottom, meaning that they look more like a plate than a bowl structure. This is consistent 333
with the spider structures identified at shallower depths in the Lower Congo Basin (Casenave et al., 2017). 334
However, only a few concretionary carbonates have been recovered in gravity cores from the Regab giant 335
pockmark field (Gay et al., 2006). This apparent lack of nodules or concretions may be due to the inability 336
of modern coring techniques to adequately sample such carbonates (Loyd et al., 2015). 337
The studies conducted in the Regab pockmark field have shown that the highest concentrations of methane 338
(up to 150 μl/l) in bottom waters was measured near the centre of the main depression, suggesting that 339
this area is the actual and active methane seepage point (Gay et al., 2006). More precisely, a recent study 340
showed that only two zones are actually harboring tubeworms, mussels and clams at the same time, all 341
living in close association with 4 m high carbonate build-ups (see Fig. 2B in Marcon et al., 2014), also a 342
common feature of other giant structures such as in the Hydrate Ridge (Teichert et al., 2005) and in the 343
Mediterranean Sea (Ingrassia et al., 2015). These two zones are annotated with green arrows on Fig. 9B 344
and they correspond to the two deepest small-scale depressions identified on the dip map of the Regab 345
pockmark field. In addition, sea-bottom pictures and videos taken within the other small-scale depressions 346
displayed only relict features such as carbonate pavement oxidized on top and surrounding dead fauna or 347
fields of clams on reduced black sediments (red arrows on Fig 9B). This may indicate a "fossil" site as 348
remnant methane seepage (<20 μl/l) in bottom waters coupled to dead or dying fauna and oxidized crusts 349
suggesting that fluid fluxes may have operated at higher rates in the past (Gay et al. 2006), as observed in 350
other active and modern seep sites (Greinert et al., 2001, Han et al., 2004, Haas et al., 2010). This also 351
suggests that only one or two points of focused fluid emission can act in a pockmark field, such as for the 352
Hydrate Hole further North in the Lower Congo Basin (Wenau et al., 2017) and in other giant pockmark 353
fields such as in the Zannnone area (Ingrassia et al., 2015). This is probably due to the pressure gradient 354
allowing only one path at a time to be open as in any plumbing system (Gay et al., 2007). 355
9. Clustering of fluid venting
356Predicting the pattern of gas invasion and rise in liquid-saturated sediments is still a challenge. From a 357
theoretical point of view, the relative importance of the dominant forces in the system, i.e., buoyancy and 358
capillary forces, have to be taken into account. The Bond (or Eötvös) number, defined as the ratio between 359
gravity over capillarity forces, is traditionally used to characterize multiphase flow in porous media. However, this 360
number does not account for the different spatial scales which govern the dominant forces. Indeed, the 361
largest capillary overpressure is controlled by the narrowest space between grains (“pore neck”) while the largest 362
buoyancy force i s c o n t r o l l e d b y t h e wider pore space (“pore body”). In order to take into account 363
this so-called porous media aspect ratio, a modified Bond number has been introduced by Brooks et al. 364
(1999). This dimensionless parameter allows a physical classification of the flow patterns which strongly 365
depend on the porous media aspect ratio (Selker et al., 2007). This latter, however, is difficult to estimate, 366
in particular in geological settings where porosity, permeability and grain distribution may drastically 367
change over short distances. 368
Laboratory experiments were therefore developed to investigate gas invasion into liquid-saturated grains in 369
polydispersed systems. They bring the advantage of being closer to field situations, while still allowing a 370
precise control of the imposed parameters (geometry, grain size distribution, injected gas flow-rate, and so 371
on). These sandbox models have been used to illustrate different regimes of gas invasion in the liquid-filled 372
granular medium (see for instance Selker et al., 2007, Varas et al., 2015 and references therein): formation 373
of gas channels, dendritic invasion, fracturing, etc. Sandbox experiments were recently conducted to 374
investigate the temporal variations of gas emission due to gas invasion into liquid-saturated grains (Vidal et 375
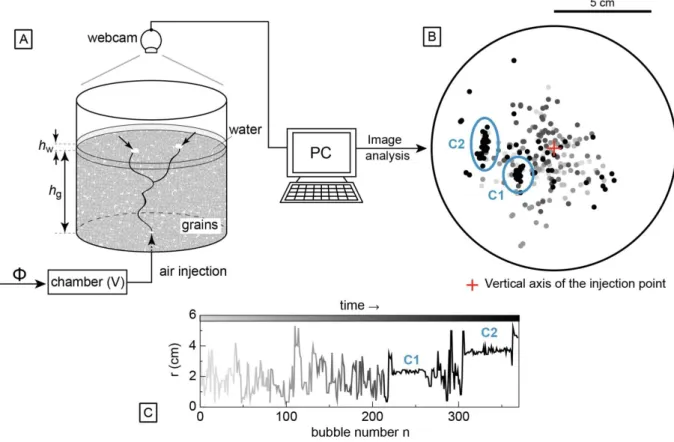
al., 2010; Varas et al., 2011; Varas et al., 2015). In a 3D experiment (Fig. 10a), a constant air flow-rate (Q) is 376
injected at the bottom of a layer of grains immersed in water. The gas is injected via a dry chamber (volume 377
V), through a nozzle of inner diameter 1mm, localized at the bottom centre of the cell (Fig. 10a). The 378
pressure variations in the chamber are monitored with a pressure sensor. Surface imaging makes it possible 379
to quantify the gas emission location and dynamics. The analysis of the position of bubble emissions shows 380
that they can migrate laterally through time (Fig. 10b). Indeed, the distance from the centre (i.e. vertical 381
axis of the injection point, red cross in Fig.10b) varies from 0 to a few cm in any direction of the cell, for an 382
initial grain height hg=14cm. No specific pattern appeared at this stage, probably because grain supply 383
simulating sedimentation has not been implemented yet in the experiment. However, two stable states of 384
gas emission were reported during the experiment. For a significant period of time, bubbles were expelled 385
at roughly the same position, with a minor lateral migration, defining the clusters C1 and C2 at a distance of 386
about 2.5 and 4 cm from the centre, respectively (Fig. 10b and 10c). This study points out that, due to the 387
strong vertical pressure gradient, gas channels cannot co-exist at the same time. In other words, only one 388
gas channel can be active and expel gas at the surface at a given time. 389
10. Discussion
390a) Seep site identification
391
The carbonate lenses of Beauvoisin were initially considered as pseudobioherms in the 80's due to their 392
bioherm-like structure and composition (Gaillard et al. 1985). Although they contain reef-building 393
organisms it is now considered that they did not form any significant relief on the seafloor (Gaillard et al,
394
1985; Rolin, 1987; Peckman et al., 1999; Gay, 2002) even if some examples on modern sites show that 395
they can form a positive relief above the seabed (Teichert et al., 2005; Himmler, et al., 2015). It has been 396
shown that carbonate pavements formed in situ into the sediments (Bayon et al., 2009). The presence of 397
autochthonous biological communities, together with a high density of one or very few taxa of 398
chemotrophic megafauna, and lateral faunal gradients, are recognizable features of seep sites (Kauffman
399
et al., 1996; Barbieri et al., 2005). Moreover, the relation of fossil-rich carbonate lenses within the general 400
stratigraphy and structural framework, their mineralogy and geochemical features, including the biomarker 401
signatures, are indicative of chemosynthetic organism activity (Campbell et al., 2002). Lucinid bivalves are 402
the most prominent biota associated with the Oxfordian carbonate lenses, with some giant specimens, up 403
to 15-20 cm in diameter, suggesting that they fed on abundant food and nutrients (Rolin, 1987; Gay, 2002). 404
Detailed paleoecology studies indicate that the communities are similar to those of recent/present 405
hydrothermal vents and cold seeps (Rolin et al. 1990; Gaillard et al. 1992) and to other fossil seep sites 406
(Taviani, 1994; Clari et al., 1994; Taylor et al., 2009). More recently, geochemical analyses conducted on 407
several Beauvoisin sub-sites have led to the conclusion that they were dependent on chemosynthesis 408
(Peckman et al., 1999; Tribovillard et al., 2013). The microbial oxidation of methane under anoxic 409
conditions, referred to as sulfate-dependent anaerobic oxidation of methane (AOM), is a major biochemical 410
process occurring at cold seeps. At sites where AOM is active, methane concentration varies strongly 411
depending on spatial and temporal availability of methane supply and microbial turnover rates (Knittel and
412
Boetius, 2009; Deusner et al., 2014). Sulfate depletion is driven by methane oxidation in sediment pore-413
waters through bacterially-mediated reactions, inducing a change in redox conditions (Feng et al., 2011) 414
and favoring carbonate precipitation (Bayon et al., 2007; Ge et al; 2010; Vanneste et al., 2012, and
415
references therein). At the Beauvoisin sub-sites the activity of sulfate-reducing bacteria is firstly indicated 416
by the dispersively-distributed framboidal pyrite within the nodules and by an outer rim of pyrite on the 417
nodules (Gaillard et al. 1992; Gay, 2002). Then, biomarkers of archaea were identified in Middle Oxfordian 418
carbonate lenses, where methanogens produced heavy CO2 leading to 13C-enriched carbonate precipitation 419
in the methanogenic zone with δ13C values as high as +13 ‰ and 12,7 ‰ PDB (Peckmann et al., 1999;
420
Tribovillard et al., 2013). The stable isotopic composition of carbonate lenses and nodules coupled with 421
taxonomic endofauna show that all sub-sites A to T located in the Beauvoisin anticline structure can be 422
considered as cold seeps that developed within the sediment, near to the sediment water interface in a 423
similar fashion to modern seep sites (Sibuet and Olu 1998, Bayon et al., 2006; Campbell et al., 2006). This 424
conclusion is also supported by specific enrichments in Mo, As and Sb in carbonate lenses, echoing the 425
bacterially-mediated formation of authigenic carbonate crusts through AOM (Tribovillard et al., 2013) as 426
previously shown in the modern mud-volcano of the Malta Plateau (Cangemi et al., 2010). 427
b) Spatial organization
428
To better understand the spatial organization of a sub-site, the centerpiece is the nodule distribution and 429
concentration. The size, shape and spatial organization of nodules at sub-sites A1 to A3 is quite consistent 430
with the observations made at sub-site F and G (Fig. 6 and 8), suggesting they have been formed through 431
similar processes. These observations can be extended to almost all sub-sites, in spite of different outcrop 432
conditions and forest cover. Only a few sub-sites seem not to be nodule-dependent, such as sub-sites L and 433
M. These very close sub-sites (See Fig. 2 for location) mostly contain the irregular echinoid Tithonia 434
oxfordiana (Gaillard et al., 1985; Gaillard et al., 1992; Senowbari-Daryan et al., 2007; Kiel et al., 2010; 435
Gaillard et al., 2011) and may represent some kind of exception as they do not contain a large macrofauna 436
either. 437
The general organization of a single sub-site can be summarized as a set of vertically stacked carbonate 438
lenses located in the centre of a concentric area of nodules. The basal lens is composed of a breccia made 439
of mineralized veins, clasts-rich conduits crosscutting limestones and embedded nodules. This facies is 440
similar to the "brecciated limestone" from Italy (Ladanza et al., 2013), meaning that it may be due to an 441
intense overpressured fluid flow impacting microbial carbonate and related macro-fauna in the sub-442
surface, such as what is observed in the injectite system of the Panoche Hills (Blouet et al., 2016). The 443
carbonate lenses are interbedded with marls or claystones corresponding to varying fluxes of fluids such as 444
in modern sites (Feng et al., 2010). The area affected by nodules is about 120 m wide forming a depression 445
4 to 6 m deep at a maximum compared to the regional stratigraphy as shown for sub-site A1 and A2 (Fig. 8 446
and 11). The average calculated slope is about 6°, which is visually almost undetectable in the field. Only 447
high resolution logs and the identification of marker horizons allow the identification of such low gradients. 448
c) Teachings from modern systems and sandbox modelling
449
Based on previous studies conducted on modern seep sites, particularly on the Regab pockmark in the LCB, 450
we have shown that the centre of an active pockmark is not the main area for focused fluid seepage and 451
the main point of emission may migrate laterally through time forming new active sub-depressions at the 452
seafloor. Consequently, a giant pockmark is the result of the coalescence of successive seepage sub-areas 453
forming a wide depression through time. This behavior is confirmed in sandbox models in which the walls 454
of a feeding channel must collapse prior to the development of a new point of emission (Varas et al., 2015 455
and references therein). The main consequence is an intermittent fluid seep, although the fluid supply from 456
deeper levels remains constant. This has also been documented in the Norway basin, through the Giant 457
Gjallar Vent (Gay et al., 2012; Dumke et al., 2012). In the light of observations made on the modern giant 458
Regab pockmark and sandbox models, an intermittent fluid seep can also be interpreted in the Beauvoisin 459
area. With respect to the stratigraphy some sub-sites can be grouped together as clusters (Fig. 12A). Seven 460
clusters C1 to C7 were defined in the Beauvoisin area. Except for clusters C3 and C5 containing 2 sub-sites 461
occurring at different positions at the same time, all other clusters are grouped in 200 m wide areas. It 462
means that the point of fluid emission on the seabed has remained at almost the same geographical 463
position for a significant period of time. A 3D view of the 7 clusters shows that the system shifts in time 464
from one cluster to the other (Fig. 12B). It also means that the occurrence of each cluster is separated from 465
the next one by a period of relative quiescence during which no fluids (or only relict fluids) were expelled at 466
the seabed. The durations of fluid seepage and fluid quiescence steps are variable. Given an estimated 467
burial of 2000-2500 m for the Terres Noires Formation in the area (Gaillard et al., 1985; Rolin, 1987), the 468
compaction rate at the base and bottom of the composite log can be considered equivalent. In a first 469
approximation, 7 periods of active seafloor fluid seepage and 8 periods of fluid quiescence alternated for 470
3.44 My, corresponding to periods of 200 ky each on average. However, at this stage the driving forces for 471
focused fluid migration remain unclear. Major deep-rooted faults structuring the margin during the 472
Oxfordian in the vicinity of the Beauvoisin area (in particular the Propiac fault related to halokinesis, see 473
Fig. 1 for location) may have played an efficient driving role for a long period of time, as suggested for 474
other fossil seep sites (Aiello, 2005). Finally, the Beauvoisin seep area can be considered as the result of 475
clustered fluid seep sub-sites. This has led to the formation of a 800 m-wide area of fluid seepage active for 476
over 3.44 My. In the light of this work, the Beauvoisin area can now be considered as a giant pockmark 477
field. 478
d) Evolution model
479
Based on the comparison of fossil outcrop, modern and active pockmark, and sandbox models data, we 480
propose here a new model for the internal evolution of a fluid seep area. Previous work conducted on 481
sandbox models and numerical simulations have pointed out that, independently of the initial air invasion 482
regime (percolation or fracture), similar systems develop a fluidized zone of parabolic shape characterized 483
by a central air-channel (Varas et al., 2011; Ramos et al., 2015; Varas et al., 2015, Poryles et al., 2016). 484
These authors show that particles are intensively reworked within the parabolic area whereas particles do 485
not have any movement outside of the parabolic area (Fig. 13A&B). This behavior has been previously 486
studied for hydraulic fractures showing that they can occur without tectonic stresses (Mourgues et al.,
487
2011), which is compatible with shallow unconsolidated and fluidized sediments. During the vertical growth 488
of the hydraulic fracture, representing the fluid-channelling conduit, a cone of vertical upward 489
displacements can be observed just above the tip of the fracture and the cone is limited by two large shear 490
bands, indicating that the fracture opened exclusively in pure tension mode (Mourgues et al., 2012). This 491
kind of cone deformation was observed in sedimentary basins, such as in the Norway basin (Gay et al.,
492
2012) or in the Northern Mediteranean Sea (Gay et al., 2017) where the cone structure is accompanied by 493
an uplift of the seabed suggesting that this doming is the initial phase of fluid emission preceding a general 494
collapse of the structure after which a pockmark forms. However, in the light of recent studies conducted 495
on fluid flow through a water-saturated matrix of grains, such cone structures are most probably of 496
parabolic shape (Poryles et al., 2016). A 2D seismic profile across the studied Regab giant pockmark field 497
shows that reflections are very chaotic below the seabed (Fig. 13C). The disturbed zone is in fact parabolic 498
in shape and is characterized by high amplitude reflections that were interpreted as carbonate structures 499
and/or gas-charged sediments (Gay, 2002; Ondreas et al., 2005; Gay et al., 2006, Marcon et al., 2014). The 500
base of the parabolic area is clearly located on top of a vertically fractured zone that is usually interpreted 501
as a seismic pipe (Gay et al., 2006; Ho et al., 2012; Løseth et al., 2011), very similar to the structure found 502
further North in the Lower Congo Basin at the Hydrate Hole where the deformed zone in the subsurface is 503
located right above an underlying fault clearly visible on seismic sections (Wenau et al., 2017). Previous 504
studies conducted in the Norway Basin have also documented V-shaped anomalies beneath pockmarks 505
corresponding to the transition from focused to distributed fluid flow (Betzler et al., 2011; Gay et al.,
506
2012). This seismic facies appears as a "flower" structure with a vertical narrow zone considered as the 507
stem (i.e. the pipe) feeding a wide area considered as the corolla (i.e. the disturbed sediments) (Gay et al.,
508
2012). It can be interpreted as deformation of cohesionless, unlithified sediments caused by fluid injection 509
(Gay et al., 2017). 510
We propose here a simple model of a giant fossil pockmark considered as an outcrop analogue to modern 511
giant pockmarks (Fig. 13D). Based on previous studies the V-shaped anomaly (Gay et al., 2012), or the 512
cone-in-cone structure (Mourgues et al., 2012), is more probably parabolic in shape. However, to date in 513
the fossil pockmark of Beauvoisin, neither the point of injection (i.e., the base of the parabolic area) nor the 514
fluid pipes were clearly identified (Fig. 13D). This is probably due to outcrop conditions, the Beauvoisin area 515
being located in the heart of an eroded E-W anticline structure with intense forest cover. The measured 516
values of δ13C and the presence of n-alkanes in the hydrocarbon fraction of veins and nodules thus 517
correspond to a contribution of different sources of carbon including a methane thermogenic origin coming 518
from thermal maturation of organic matter at the base of the Terres Noires Formation or below it 519
(Peckmann and Thiel, 2004). This observation coupled with fluid migration being active for at least 3.4 My 520
suggests that a significant amount of fluids migrated during this period. However, it does not mean that the 521
fluid flow in the sub-surface is constant over time. On modern sites varying fluid flows were documented in 522
the sub-surface, producing authigenic high Mg-Calcite or aragonite depending on the CH4 flux rate and 523
forming pavements or concretions (Nöthen et al, 2011). If the flux rate is not high enough, only 524
disseminated concretions precipitated. At a specific point of emission, the fluid flux in the shallow sub-525
surface is not high enough to sustain massive carbonate precipitation, but it does not mean that the fluid 526
flux is also reduced at depth. In the disturbed zone, carbonate lenses are organized in clusters that laterally 527
migrate through time. At time t0 the first cluster is fed by an irregular conduit (green line on Fig. 13D). Time 528
t1 corresponds to the time necessary for the conduit to collapse, then to laterally shift and then to open at 529
a different location. The time t2 corresponds to the birth of a new cluster of carbonate lenses. Based on the 530
detailed stratigraphy we showed that the times t0, t1 and t2 are relatively equivalent in terms of duration, 531
about 200 ky each. It means that even if a pockmark seems dead and inactive, it could be at stage t1 532
corresponding to a shift of the feeding conduit in the disturbed zone. As observed in both modern and 533
fossil fluid seep areas, a long lasting fluid migration is channelized through focused structures (Ho et al.,
534
2012; Løseth et al., 2011) that could constantly feed the disturbed zone. The next challenge in the area will 535
be to identify such underlying pipe structures, as the bitumen infilling of veins and nodules may correspond 536
to a later stage of heavier fluid migration as shown for the "Brecciated Limestone" in Italy (i.e., secondary 537
migration in the petroleum system; Ladanza et al., 2015). In the case of the Beauvoisin seep site, it would 538
mean that the feeding pipes remained open for a long period of time. 539
11. Conclusion
540For over 30 years, a fluid seep system has been known in the Beauvoisin area, located on the Jurassic 541
passive margin of the SE Basin of France (Gaillard et al., 1985). Modern marine investigations coupled with 542
sandbox models permitted comparison of the architecture of the Beauvoisin seep site with an active fluid 543
seep area on the modern passive margin of the Lower Congo Basin. The main conclusion is that they have 544
very similar features even if they do not occur at the same geological time. In the same way, the sandbox 545
models of fluid injection structures have shown that the involved processes have led to a similar 546
organization in 3D, in particular: 547
> Stratigraphy: based on 23 sedimentological sections in the Beauvoisin area, 19 sub-sites A to T have been 548
reported in a composite log, representing a total thickness of about 370 m. Due to weathering and erosion 549
since the site discovery, two new sub-sites S and T were identified and integrated in the general log, based 550
on the initial nomenclature established by Rolin (1987). 551
> Sub-Site shape and organization: Each identified sub-site is composed of sub-vertically stacked carbonate 552
lenses. Detailed logs at various distances from the vertical axis of carbonate lenses have shown that the 553
sub-sites developed in smooth depressions, 4 to 6 m deeper than the surrounding seabed. Nodules are 554
present within the depression only. They are encased in the carbonate lenses in the centre whereas their 555
size varies depending on the distance from the centre. Coupled with the varying δ13C values, this indicates 556
that nodules can be considered as markers of a sub-site, even if outcrop conditions do not allow 557
identifcation of carbonate lenses buried in marls. 558
> General organization: The carbonate lenses are organized in clusters up to 7 sub-sites grouped together 559
in the same stratigraphic interval and the same geographic zone within the seeping area. Only a few sub-560
sites seem active at the same time in a given cluster. The coalescence of all clusters leads to the formation 561
of a wide depression. This general organization is very similar to that of the modern Regab giant pockmark 562
field in the Lower Congo Basin. The seep site of Beauvoisin can be clearly considered as a fossil giant 563
pockmark field, analogue to pockmarks in modern basins. 564
> Timing: A detailed stratigraphic correlation coupled with extensive mapping of fluid seep sub-sites in the 565
Beauvoisin area has led to a spatio-temporal 3D reconstruction of the position of these sub-sites. It shows 566
that periods of fluid seeping alternated with periods of apparent quiescence, about 200 ky each. 567
A pockmark is a seafloor depression hosting seep sites, both active and inactive. The study of the modern 568
Regab pockmark shows that it is formed by the coalescence of smaller depressions, each about 100 m 569
wide. However, submersible dives and gravity cores provide only the partial vision of the seafloor without 570
integrating the sub-seafloor and the connection with fluid pipes at depth. A way to access the pockmark 571
underground is studying outcrop analogues, such as the Beauvoisin giant pockmark. The study of this site 572
provided a real breakthrough in the understanding of fluid activity in the disturbed zone below the 573
seafloor. The main result is that a pockmark could seem inactive for a long period of time due to the lateral 574
shift of the feeder conduit, meaning that the sub-seafloor remains charged in gas. This observation will be 575
of great importance in the geobiology of fluid seeps (Peckmann, 2005; Judd et al., 2007), in risk assessment 576
for anthropic activities at the sea-bottom (Gay et al., 2017) and for hydrocarbon exploration (Capozzi et al.,
577
2017). 578
12. Acknowledgements
579The authors would like to gratefully thank all Masters students involved in this project, Stanislas Delivet, 580
Maëva Evesque, Laure Matiakh, Aloïse Chabbert-Gondart, Elie Boidin, Yolaine Rubert, Amandine Castillo, 581
Charly Poitevin, Audrey Laplanche, Alexandra Gueguen and Morgane Bizeray, who helped significantly in 582
getting stratigraphical logs. They thank Anna Travé who did all geochemical analyses at the University of 583
Barcelona. The authors acknowledge all colleagues who participated in discussion in the field and greatly 584
improved our understanding of the area. 585
13. Fundind
586The field project was funded by the French coordination program Action Marge (AM). A sub-theme was 587
dedicated to “Fluids - Organic Matter - Mineral Matter” (FO3M) and the challenge was to define fluid flow 588
as the centerpiece of a cycle starting from the organic matter preservation at seabed, its transformation 589
during burial forming fluids, the upward fluid migration through fine grained sediments, the temporarily 590
fluid storage into reservoirs such as sedimentary bodies or gas hydrates, the fluid expulsion at seafloor, to 591
its implications on seabed stability or climate change. German Varas acknowledges financial support from 592
FONDECYT Project No. 11121300. V.V. and G.V. were supported by Programa de Cooperación Científica 593
ECOS/CONICYT C14E07 and the Laboratoire International Associé “Matière : Structure et Dynamique” (LIA-594
MSD, France-Chile). 595
14. References
596Agirrezabala, L.M., Kiel, S., Blumenberg, M., Schäfer, N., Reitner, J. (20113). Outcrop analogues of 597
pockmarks and associated methane-seep carbonates: A case study from the Lower Cretaceous (Albian) of 598
the Basque-Cantabrian Basin, western Pyrenees. Palaeogeography, Palaeoclimatology, Palaeoecology vol. 599
390, p. 94-115. 600
Aiello, I.W. (2005). Fossil seep structures of the Monterey Bay region and tectonic/structural controls on 601
fluid flow in an active transform margin. Palaeogeography, Palaeoclimatology, Palaeoecology vol. 227, p. 602
124-142. 603
Aloisi, G., BOULOUBASSI I., HEIJS S.K., PANCOST R.D., PIERRE C., DAMSTE J.S.S., ... & ROUCHY J.M. (2002). - 604
CH 4-consuming microorganisms and the formation of carbonate crusts at cold seeps. - Earth and Planetary 605
Science Letters, 203, 1, 195-203.
606
Aloisi, G., PIERRE C., ROUCHY J.M., FOUCHER J.P. & WOODSIDE J. (2000). - Methane-related authigenic 607
carbonates of eastern Mediterranean Sea mud volcanoes and their possible relation to gas hydrate 608
destabilisation. - Earth and Planetary Science Letters, 184, 1, 321-338. 609
Amano, K., Jenkins, R.G., Aikawa, M., Nobuhara, T. (2010). A Miocene chemosynthetic community from the 610
Ogaya Formation in Joetsu: Evidence for depth-related ecologic control among fossil seep communities in 611
the Japan Sea back-arc basin. Palaeogeography, Palaeoclimatology, Palaeoecology vol. 286, p. 164-170. 612
Artru, P., 1972. Les Terres Noires du bassin rhodanien (Bajocien supérieur à Oxfordien moyen). 613
Startigraphie - Sédimentologie - Géochimie. Thèse d'Etat, Lyon, Lyon, 173 p. 614