HAL Id: hal-02394964
https://hal.archives-ouvertes.fr/hal-02394964
Submitted on 11 Dec 2019
HAL is a multi-disciplinary open access
L’archive ouverte pluridisciplinaire HAL, est
CROSS-SHORE SANDBARS RESPONSE TO AN
ARTIFICIAL REEF: AN INTERSITE COMPARISON
C Bouvier, B. Castelle, Y Balouin, K Splinter, M Blacka, B Dubarbier
To cite this version:
C Bouvier, B. Castelle, Y Balouin, K Splinter, M Blacka, et al.. CROSS-SHORE SANDBARS
RE-SPONSE TO AN ARTIFICIAL REEF: AN INTERSITE COMPARISON. Coastal Sediments’19, May
2019, Tampa, United States. �10.1142/9789811204487_0137�. �hal-02394964�
CROSS-SHORE SANDBARS RESPONSE TO AN ARTIFICIAL
REEF: AN INTERSITE COMPARISON
C. Bouvier12, B. Castelle2, Y. Balouin1, K. D. Splinter3, M. Blacka3 and B. Dubarbier2 1 BRGM, Occitanie-Pyrénées-Méditerranée (SGR/LRO), 1039 Rue de Pinville, 34000
Montpellier, France. [email protected], [email protected].
2 CNRS, UMR EPOC, Univ. Bordeaux, Allée Geoffroy Saint-Hilaire, CS 50023, 33615 Pessac, France. [email protected], [email protected].
3 Water Research Laboratory, School of Civil and Environmental Engineering, UNSW Sydney, NSW, 2052, Australia. [email protected], [email protected].
Abstract: While a clear improvement concerning aesthetic considerations using soft submerged breakwater is undeniable, their design has often focused on wave energy decrease in their lee, overlooking their impact on the dynamics of the nearby nearshore sandbar(s). At the beach of Sète (southeast France), the submerged structure clearly affects the natural net offshore migration cycle (NOM) of the former double barred beach. On the contrary, at Narrowneck (Queensland, Australia), the deployment of a multi-functional submerged structure does not affect the cross-shore sandbar processes. These contrasting behaviors are addressed using high frequency video monitoring. After discussing observations at both field sites, a process-based morphodynamic model provides insight into the morphological sandbars response to artificial reefs.
Introduction
Coastal management practices nowadays no longer rely solely on hard coastal defense techniques to reduce erosion, with other options like beach nourishments or soft submerged structure (SBW) being increasingly preferred. However, like many coastal engineering offshore SBWs aimed at shoreline protections, SBWs have often been designed with considering only wave transmission processes across the crest of the structure (Wamsley et al., 2002), and often disregarding complex wave-driven circulation (Fig. 1), and resulting sediment transport and morphodynamic feedbacks.
The substantial amount of failing SBWs driving enhanced shoreline erosion (Ranasinghe and Turner, 2006) confirms the importance of understanding the complex interactions between the structure, nearshore hydrodynamic and sediment transport. Traditionally, the study of the SBWs behavior in terms of transmission, reflection, wave overtopping has been done in flume experiments or by using one-line numerical models in which only the longshore transport component is taken into account. In contrast, 2DH process-based models are capable of reproducing two-dimensional complex nearshore circulation making them suitable to study the shoreline and nearshore morphodynamic response to SBWs.
Fig. 1. Nearshore circulation pattern obtained by physical model study (Dean et al., 1997)
2DH numerical modeling exercises or 2D laboratory experiments, allow the investigation into the influence of SBWs on the hydrodynamic and shoreline response (Ranasinghe et al., 2010, 2006). In a synthetic case (alongshore-uniform morphology), shoreline response appeared to be driven by several SBW characteristics (depth from the crest to the surface, width, and position) and wave conditions (Ranasinghe et al., 2010). Nevertheless, the literature on submerged structures systematically overlooks their impact on the dynamics of the nearby nearshore sandbar(s).
Beside their fundamental scientific interest, sandbars play a key role in coastal protection during storms, dissipating wave energy before they reach the shore. Moreover, recent observations at the beach of Sète (southeast France) evidenced that the role of the sandbar is critical for shoreline response to the implementation of SBWs on barred beaches (Bouvier et al., 2017). At Sète, the structure clearly affected the original three-dimensional morphology of the sandbar which became more linear, resulting in a slight seaward migration of the shoreline in front of the structure. Not only affecting alongshore processes, the SBW at Sète also clearly induced a large reduction in offshore sandbar migration rate. This behavior is further investigated in this study through a comparison with another site, Narrowneck on the Gold Coast (east Australia) where an artificial multi-functional reef has been deployed since 2000 (Jackson et al., 2007).
Field site
The Lido of Sète
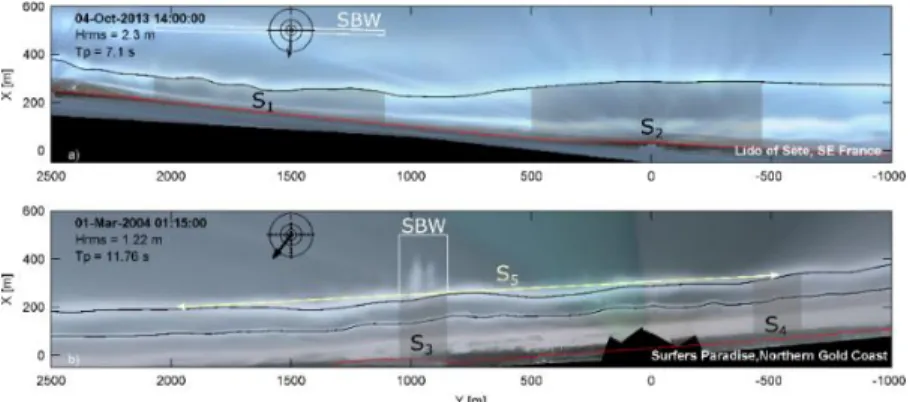
The Lido of Sète, southeast France, is a narrow and relatively straight sandy barrier located in the northern part of the Mediterranean Sea. It is a semi-diurnal microtidal environment, with a moderate-energy modal wave climate characterized by episodic severe storms. Prior to SBW installation, the Lido of Sète was characterized by a double bar system with a mean shoreface slope of 0.9 %. The outer bar was located approximatively 350 m from the shore with its crest in approximatively 4 m below mean sea level. The inner bar (with its crest in 2-m depth) had an oblique configuration, attached to the shore in the SBW area (S1, Fig. 2a) and progressively detaching on the adjacent coast (S2, Fig. 3a) to reach
a distance of 170 m from the shore. Previous studies in this area described a relatively slow (> 10 year cycle) Net Offshore Migration (NOM) cycle (Aleman et al., 2013).
A large beach management program (BCEOM, 2001) was developed at the Lido of Sète with the objective to reduce coastal erosion. The program involved the installation of a 1-km long SBW in early 2013 on the subdued outer bar crest (Fig. 2a). The structure extends 12 m in the cross-shore direction with its crest in approximatively 1.5 m water depth.
Narrowneck
Narrowneck is located at the northern end of the Gold Coast in southeast Queensland, Australia. It is a wave-dominated 3-km long straight stretch of beach with a nearshore bed slope of around 2 %. The annual mean root-mean-square wave height is about 0.8 m with a peak period of 10 s. The tide is semi-diurnal with a spring tidal range of 1.5–2 m. Narrowneck is characterized by a double sandbar system with the inner and outer bars located on average some 50 and 150 m from the shore. Cross-shore inner and outer-bar dynamics exhibit episodic NOM that are triggered by large wave events (Castelle et al., 2007; Ruessink et al., 2009).
An artificial reef has been installed offshore to provide a submerged, low visual impact, coastal control point to stabilize the nourished northern Gold Coast beaches. As the reef is in a popular tourist and surfing area, it has also been designed and constructed to enhance recreational amenity (Ranasinghe and Turner, 2006). The structure is essentially V-shaped in plan with the apex pointing seaward (Fig. 2b). The structure extends from about 200 m to 400 m offshore and 150 m alongshore. The apex of the structure is located in about 10-m depth while the inshore extremity is 2-m depth.
Fig. 2. Aerial view of the submerged breakwaters (SBW) deployed offshore at a) the lido of Sète (Southeastern France) and b) Narrowneck (Northern Gold Coast).
Fig. 3. Planview time-exposure image showing both study sites (a) Lido of Sète and (b) Narrowneck with SBW position illustrated (white rectangle). Shaded areas illustrate each location where the
alongshore average sandbar position has been computed.
Method
Observations
Hydrodynamics
At the Lido of Sète, incident wave conditions were collected every 30 min from a directional wave buoy located offshore moored in 30 m-depth. Water levels were measured in the harbor of Sète at few kilometers away from the study site. At Narrowneck, wave characteristics were measured every hour by a directional wave buoy in 18-m depth. Water levels were available as hourly-predicted values at the Gold Coast Seaway located 5 km north of the field site.
Video imagery
An Argus video monitoring system (Holman and Stanley, 2007) has been collecting images for both sites during more than 5 years. While at Narrowneck, the video monitoring station has been collecting data since the beginning of the artificial reef installation, data collections started 3 years before reef deployment at Sète. 10-min averaged images of multiple cameras were combined and transformed to real-world plan view images (Holland et al., 1997) on a 2 x 2 m grid extending 600 m in the cross-shore (X) and 3.5 km in the alongshore (Y) direction (Fig. 3). Morphological features (bar, shoreline) were extracted using ARGUS toolboxes (Holman and Stanley, 2007) through the sampling of pixel luminosity intensity (Lippmann and Holman, 1989).
For the video monitoring station of Sète, in the sandbar area, an overall error of 12 m is assumed for the cross-shore sandbar position (Bouvier et al., 2017). Inner-bar crests were extracted before and after every significant energetic event (defined as Hs > 1.5 m with a minimal duration of 12 h). The outer bar was difficult to extract with sufficient frequency as the depth of its crest did not often permit wave breaking and any potential video identification. Consequently, at Sète video observations will only describe the cross-shore inner-bar evolution. For the video monitoring station of Narrowneck, a 9.3-year dataset of low-tide time-exposure images previously described in (Price and Ruessink, 2011; Ruessink et al., 2009) in which inner and outer bar positions were daily extracted with good accuracies was available for this study.
In this study, an alongshore discretization of the cross-shore process for both field sites is proposed. Alongshore averaged sandbar(s) position were computed in two different geographic sectors; in the lee of the structure and well away from it on the undisturbed coast. The size of the sector depends on the SBW’s length. At Sète, the alongshore sections length (1 km) well exceeds the alongshore wavelength of crescentic inner-bar and megacusps, which influence is therefore filtered when computing the alongshore averaged position. At Narrowneck, because the alongshore sections length (200 m) is smaller than the crescentic patterns, the computation was also realized for a 2.5-km long section (sector 5), providing a comparison with sectors 3 and 4. In any case, cross-shore sandbar positions were computed relative to a fixed line positioned approximatively on the dune foot (red dashed line in Fig. 3). Results are compared between each sector to decipher the role of SBWs on cross-shore sandbar processes for the beach of Sète and Narrowneck.
Numerical modelling
Model description
We use a non-linear, depth-averaged morphodynamic model (2DBeach; Dubarbier et al., 2017) to better understand the cross-shore sandbar(s) behavior following SBW installation. Both cross-shore and alongshore processes are included allowing the bars to migrate in the cross-shore direction, but also to develop alongshore variability in position and depth.
The model consists of three coupled modules (Dubarbier et al., 2017). 1) the wave field is computed with the spectral wave model SWAN (Booij et al., 1999), solving the wave action balance. We use a classical wave dissipation formula (Battjes and Janssen, 1978) with a constant breaker parameter 𝛾 = 0.73 following Battjes and Stive (1985). In order to limit non-physical wave refraction near SBWs induced by excessive bottom slope at the structure extremity, limiters (l =
0.25) based on the Courant–Friedrichs–Lewy criteria are used for the spectral propagation (refraction and frequency shifting) in SWAN according to (Dietrich et al., 2013). 2) The horizontal flow field is computed via the time-and depth-averaged non-linear shallow water equations. The hydrodynamic module of 2DBeach uses an implicit method to obtain quasi-steady mean water depth and water volume flux (Castelle et al., 2012). The computation uses the radiation stress definition introduced by Phillips (1977) including effetcs of the wave return flow (undertow). 3) The total sediment transport Qt is obtained with an energetics-type sediment transport equation, based on Hsu et al. (2006) and Dubarbier et al. (2015), and consists of three modes of sediment transport, reading as:
𝑄𝑡 = 𝑄𝑤 + 𝑄𝑐 − 𝑄𝑑 (1) with transports related to wave velocity skewness Qw, wave-induced mean current Qc, and gravitational downslope effects Qd. Each mode of transport contains both bed load and suspended load. 4) The bed level is updated through the sediment mass conservation equation that loopback into the wave model.
Model set up and scenario
For each field site, a regular grid was considered with a grid cell size of dX = 10 m (cross-shore direction) and dY = 20 m (longshore direction). While the offshore boundary of the model was located close to the wave sensor at Narrowneck, a first SWAN simulation on a larger grid permitted to refract the wave field from the offshore buoy at Sète. Simulations were performed during high energy wave events leading to a net offshore migration (E1 fig. 4b and E2 Fig. 5b). For each
field site, the initial beach morphology corresponds to a synthetic alongshore uniform double barred system with a beach profile based from a bathymetric survey realized few weeks before the storm. SBWs were implemented or not on the numerical grid depending of the simulation presented. While the design of SBW was relatively simple for the case of Sète, the artificial reef installed at Narrowneck needed more consideration. Even if relatively schematic, each structure has been designed with respect to their own characteristics.
A spatially constant d50 of 200 𝜇𝑚 and 250 𝜇𝑚 were respectively used in agreement with the beach sediment at the Gold Coast and the Lido of Sète. Coefficients Cw, Cc and Cd that scale the contribution of each corresponding transport (Qw, Qc and Qd respectively) were adjusted following a sensitivity analysis for both field sites. From default coefficients (Cw:Cc:Cd = 0.08:0.08:0.24), we adopted a relatively low Cw coefficient in comparison with Cc for both sites as sandbars tended to systematically migrate onshore in other cases (Table 1). Comparing with default values, low Cd was necessary to limit numerical instabilities close to the SBWs which were considered as non-erodible.
Site Cc Cw Cd Lido of Sète 0.08 0.05 0.16 Narrowneck 0.04 0.05 0.08
Table. 1. Optimized parameters for each field site.
Results
Observations
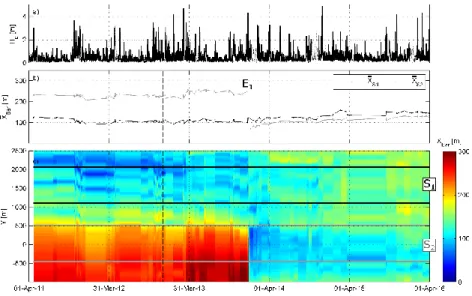
Fig. 4. provides insight into the cross-shore inner-bar behavior at the Lido of Sète illustrating time series of wave conditions (Hs, Fig. 4a.) and longshore averaged cross-shore sandbar position (Fig. 4b.) computed in the lee of the structure (S1) and in the undisturbed nearshore (S2). As previously described in Bouvier et al. (2017), results show a clear change in inner-bar cross-shore behavior since the structure deployment (black dashed line in Fig. 4b). Although at a different distance to the shore, inner bar at S1 and S2 locations shows similar behavior prior to the deployment. Subsequently, a series of storms in March 2013 and December 2013 drove an offshore sandbar migration at a much higher rate in S2 than in S1 (Fig. 4b). This behavior is hypothesized to be caused by the SBW that, through wave energy dissipation inhibited further offshore migration of the sandbar at S1 location. This difference in offshore migration magnitude between both sectors resulted in a sandbar splitting (Bouvier et al., 2017).
The same analysis was performed at Narrowneck (Fig. 5) for the outer-bar cross-shore dynamics. As previously studied by Ruessink et al. (2009), the outer-bar responded to storm events by migrating offshore with a rate depending of incident wave conditions. Even if not presented here, the inner bar appeared to be coupled with outer-bar presenting a very similar cross-shore dynamic. Unlike the beach of Sète, the cross-shore sandbar dynamics was not affected by SBW and shows a very homogenous response alongshore (Fig. 5b and c). This was not expected as a close inspection of the available imagery shows that waves are systematically breaking over the reef during storms or moderate events (see also Fig. 3b). Further investigation through numerical modelling is necessary to better assess the real impact of SBW on cross-shore processes at Sète and clarify the non-influence of the structure at Narrowneck.
Fig. 4. Cross-shore inner-bar dynamic at the Lido of Sète. Offshore (a) significant wave height Hs, (b) alongshore-averaged (𝑋̅̅̅̅̅̅) inner-bar position (over 1 km in the lee of the artificial reef in black 𝐵𝑎𝑟
and over 1 km in the undisturbed coast in grey) and (c) cross-shore inner-bar position 𝑋𝐵𝑎𝑟
depending of the alongshore location Y.
Fig. 5. Cross-shore outer-bar dynamic at Narrowneck. Offshore (a) significant wave height Hs, (b) alongshore-averaged (𝑋̅̅̅̅̅̅) outer-bar position (over 200 m in the lee of the artificial reef in black 𝐵𝑎𝑟
and over 200 m in the undisturbed coast in grey) and (c) cross-shore outer-bar position 𝑋𝐵𝑎𝑟
Numerical modelling
Morphological evolution
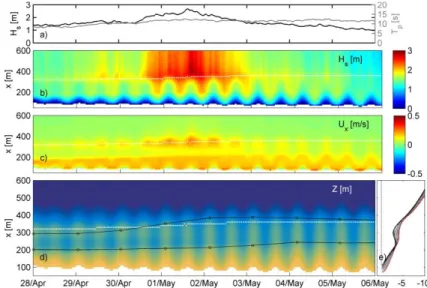
Fig. 6 and 7 respectively show the model results for Sète (SBW’s lee) and Narrowneck (undisturbed coast) in their own environment during storms. We choose to present these simulations to assess the ability of the model to reproduce both the inner-bar stability at Sète behind the reef and a net offshore migration event at a non-disturbed location at Narrowneck. At Sète, when sufficiently high (Hs > 1 m; Fig. 6b) waves break over the SBW and an onshore directed flow (20 cm/s; Fig. 6c) is produced. In the sandbar area (x = 200 m), waves do not break across the deep sandbar and therefore do not drive any substantial current. According to our observations (black line), the simulated sandbar crest (white dots) remained stable.
At Narrowneck, the outer bar was initially close to the shore (X = 320 m) with its crest in approximatively 4 m-depth. During the storm, energetic waves (> 2 m) were breaking over the sandbar at a location depending on the tide. The dissipation of wave energy over the sandbar crest induced an important offshore-directed flow (Fig. 7c). Offshore outer-bar migration appeared systematically during low tide inducing a more important dissipation of energy over the sandbar. Comparing with our observations (black curves), the model underestimates sandbars offshore migration (50 %) and systematically induces a sandbars crest smoothing when migrating offshore. At the inner-bar location, tidal signal on cross-shore velocities is less significant particularly during the peak of the storm.
Discussion and conclusion
While the change in cross-shore sandbar dynamics following SBW deployment at the beach of Sète has been described recently (Bouvier et al., 2017), the cross-shore sandbar dynamic at Narrowneck has been shown as alongcross-shore uniform and not affected by the SBW installed. These contrasting behaviors are addressed using high frequency video monitoring and a process-based morphodynamic model. The interannual and seasonal variability were not affected by SBWs at both sites. However, at Sète, inner bar net offshore migration was clearly inhibited by SBW. On the contrary, at Narrowneck, cross-shore sandbars variability remained the same despite SBW implementation
The model was able to reproduce both the sandbars offshore migration during a storm at Narrowneck (admittedly underestimated) and the inner-bar stability at Sète. Our results suggest a very important role of the SBW depth.
Fig. 6. Simulation of beach profile evolution at Lido of Sète on the reef area during a storm (see E1 in Fig. 4b). a) Offshore measured time series of root mean square wave height and peak wave period. Time-space diagram of simulated b) significant wave high, c) cross-shore current and d)
bottom evolution. The white line (black dots) indicates the simulated (measured) sandbar crest position. e) Beach profile evolution with the initial and final profile in black and red respectively.
Fig. 7. Simulation of beach profile evolution at Narrowneck on the undisturbed coast during a storm (see E3 in Fig. 5b). a) Offshore measured time series of root mean square wave height and peak wave period. Time-space diagram of simulated b) significant wave high, c) cross-shore current and
d) bottom evolution. The white line (black dots) indicates the simulated (measured) sandbar crest position. e) Beach profile evolution with the initial and final profile in black and red respectively.
Our ability to predict sandbar migration when deploying SBW has strong implications for the capacity to predict shoreline erosion in their lees and may significantly affect the population close to the coast. Overall these results illustrate the importance of considering nearshore sandbars when designing of coastal structures. The design of an artificial reef seems to be case sensitive and should be carefully approach, imposing a first strong knowledge of the global dynamic at the study site.
Acknowledgments
CB acknowledges financial support from BRGM, EPOC, DREAL-Occitanie and Sète AggloPôle Méditerranée through a PhD grant. This project has benefited from state aid managed by the French National Research Agency under the program Investments for the future and bearing the reference ANR-10-IDEX-03-02. CB also gratefully acknowledge WRL for their support and for providing data. Video images and bathymetry from the Narrowneck reef was provided by the City of Gold Coast. The authors also thanks B.G. Ruessink for sandbar positions digitized from the Argus images at Narrowneck.
References
Aleman, N., Robin, N., Certain, R., Barusseau, J.-P., Gervais, M., 2013. Net offshore bar migration variability at a regional scale: Inter-site comparison (Languedoc-Roussillon, France). J. Coast. Res.
https://doi.org/10.2112/SI65-290.1
Battjes, J.A., Janssen, J.P.F.M., 1978. Energy Loss and Set-Up Due to Breaking of Random Waves, in: Coastal Engineering 1978. American Society of Civil Engineers, New York, NY, pp. 569–587.
https://doi.org/10.1061/9780872621909.034
Battjes, J.A., Stive, M.J.F., 1985. Calibration and verification of a dissipation model for random breaking waves. J. Geophys. Res. 90, 9159.
https://doi.org/10.1029/JC090iC05p09159
Booij, N., Ris, R.C., Holthuijsen, L.H., 1999. A third-generation wave model for coastal regions: 1. Model description and validation. J. Geophys. Res. Ocean. 104, 7649–7666. https://doi.org/10.1029/98JC02622
Bouvier, C., Balouin, Y., Castelle, B., 2017. Video monitoring of sandbar-shoreline response to an offshore submerged structure at a microtidal beach. Geomorphology 295, 297–305.
Castelle, B., Marieu, V., Coco, G., Bonneton, P., Bruneau, N., Ruessink, B.G., 2012. On the impact of an offshore bathymetric anomaly on surf zone rip channels. J. Geophys. Res. Earth Surf.
https://doi.org/10.1029/2011JF002141
Castelle, B., Turner, I., Ruessink, B., Tomlinson, R., 2007. Impact of storms on beach erosion: Broadbeach (Gold Coast, Australia). J. Coast. Res. 534– 539.
Dean, R., Chen, R., Browder, A., 1997. Full scale monitoring study of a submerged breakwater, Palm Beach, Florida, USA. Coast. Eng. 29, 291– 315.
Dietrich, J.C., Zijlema, M., Allier, P.-E., Holthuijsen, L.H., Booij, N., Meixner, J.D., Proft, J.K., Dawson, C.N., Bender, C.J., Naimaster, A., Smith, J.M., Westerink, J.J., 2013. Limiters for spectral propagation velocities in SWAN. Ocean Model. 70, 85–102.
https://doi.org/10.1016/J.OCEMOD.2012.11.005
Dubarbier, B., Castelle, B., Ruessink, G., Marieu, V., 2017. Mechanisms controlling the complete accretionary beach state sequence. Geophys. Res. Lett. https://doi.org/10.1002/2017GL073094
Holland, K.T., Holman, R. a, Lippmann, T.C., Stanley, J., Plant, N., 1997. Practical Use of Video Imagery in Nearshore Oceanographic Field Studies - Oceanic Engineering, IEEE Journal of. IEEE J. Ocean. Eng. 22, 81–92. Holman, R.A., Stanley, J., 2007. The history and technical capabilities of Argus.
Coast. Eng. https://doi.org/10.1016/j.coastaleng.2007.01.003
Hsu, T.-J., Elgar, S., Guza, R.T., 2006. Wave-induced sediment transport and onshore sandbar migration. Coast. Eng. 53, 817–824.
https://doi.org/10.1016/J.COASTALENG.2006.04.003
Jackson, L., Corbett, B.B., Tomlinson, R.B., McGrath, J.E., Stuart, G., 2007. Narrowneck Reef: Review of Seven Years of Monitoring 75.
Lippmann, T.C., Holman, R.A., 1989. Quantification of sand bar morphology: A video technique based on wave dissipation. J. Geophys. Res. 94, 995. https://doi.org/10.1029/JC094iC01p00995
Price, T.D., Ruessink, B.G., 2011. State dynamics of a double sandbar system. Cont. Shelf Res. https://doi.org/10.1016/j.csr.2010.12.018
Ranasinghe, R., Larson, M., Savioli, J., 2010. Shoreline response to a single shore-parallel submerged breakwater. Coast. Eng. 57, 1006–1017. https://doi.org/10.1016/J.COASTALENG.2010.06.002
Ranasinghe, R., Turner, I.L., 2006. Shoreline response to submerged structures: A review. Coast. Eng. https://doi.org/10.1016/j.coastaleng.2005.08.003 Ranasinghe, R., Turner, I.L., Symonds, G., 2006. Shoreline response to multi-functional artificial surfing reefs: A numerical and physical modelling study. Coast. Eng. https://doi.org/10.1016/j.coastaleng.2005.12.004 Ruessink, B.G., Pape, L., Turner, I.L., 2009. Daily to interannual cross-shore
sandbar migration: Observations from a multiple sandbar system. Cont. Shelf Res. https://doi.org/10.1016/j.csr.2009.05.011
Wamsley, T., Hanson, H., Kraus, N., 2002. Wave transmission at detached breakwaters for shoreline response modeling.