HAL Id: hal-00304630
https://hal.archives-ouvertes.fr/hal-00304630
Submitted on 1 Jan 2001HAL is a multi-disciplinary open access archive for the deposit and dissemination of sci-entific research documents, whether they are pub-lished or not. The documents may come from teaching and research institutions in France or abroad, or from public or private research centers.
L’archive ouverte pluridisciplinaire HAL, est destinée au dépôt et à la diffusion de documents scientifiques de niveau recherche, publiés ou non, émanant des établissements d’enseignement et de recherche français ou étrangers, des laboratoires publics ou privés.
Scotland.
A. Jenkins, R. C. Ferrier, R. C. Helliwell
To cite this version:
A. Jenkins, R. C. Ferrier, R. C. Helliwell. Modelling nitrogen dynamics at Lochnagar, N.E. Scotland.. Hydrology and Earth System Sciences Discussions, European Geosciences Union, 2001, 5 (3), pp.519-528. �hal-00304630�
Modelling nitrogen dynamics at Lochnagar, N.E. Scotland Hydrology and Earth System Sciences, 5(3), 519–527 (2001) © EGS
Modelling nitrogen dynamics at Lochnagar, N.E. Scotland.
A. Jenkins
1, R.C. Ferrier
2and R.C. Helliwell
21 Centre for Ecology and Hydrology, Wallingford, Oxon OX10 8BB, UK 2 Macaulay Institute, Craigiebuckler, Aberdeen, AB15 8QH, UK
Email for corresponding author: [email protected]
Abstract
Controls on nitrate leaching from upland moorland catchments are not yet fully understood and yet, despite agreements on emission reductions, increased surface water nitrate concentrations may affect significantly the acidity status of these waters in the future. At Lochnagar, an upland moorland catchment in N.E. Scotland, 12 years of surface water chemistry observations have identified a steady increase in nitrate concentration despite no measured change in inorganic nitrogen deposition. The MAGIC model has been applied to simulate a ‘best case’ situation assuming nitrate in surface water represents ‘hydrological’ contributions (direct run-off) and a ‘worst case’ assuming a nitrogen saturation mechanism in the catchment soil. Only the ‘saturation’ model is capable of matching the 12 years of observation for nitrate but both model structures match the pH and acid neutralising capacity record. Future predictions to 2040, in response to the agreed emission reductions under the Gothenburg Protocol, are markedly different. The worst case predicts continued surface water acidification whilst the best case predicts a steady recovery.
Keywords: nitrogen saturation, modelling, Lochnagar, Gothenburg Protocol
Introduction
There is a growing body of evidence that long-term changes are occurring in surface water chemistry in Europe and N. America (e.g. Stoddard et al., 1999; Evans et al., 2001). The changes are largely consistent with a move towards less acidic conditions as a result of reductions in sulphate (SO4) concentration. These reductions in SO4 concentration are in line with observed decreases in sulphur (S) deposition which, in turn, reflect the efforts of international agreements to reduce S emissions throughout Europe (Jenkins, 1999). Identification of this long-term trend at some sites and regions, however, is confounded by variability in other environmental factors such as rainfall, sea-salts and temperature (e.g. Monteith and Evans, 2000). In addition, it has been postulated that a long-term increase in surface water nitrate (NO3) concentrations as a result of nitrogen (N) saturation (Aber et al., 1989; Stoddard, 1994; Dise and Wright, 1995) in soils might offset the expected recovery from acidification (Ferrier et al., 1995; Jenkins, 1999).
The process of N saturation describes the decreased immobilisation of deposited N in catchment soils as a result of increasing N richness relative to carbon (C) (decreased
C/N ratio) and subsequent NO3 breakthrough. This concept has been tested experimentally (Wright and van Breemen, 1995; Emmett et al., 1998) and found to be robust for forest soils (Gundersen et al., 1998). At catchment scale, however, observations of a long-term increase in NO3 concentrations are scarce.
The lack of certainty in our understanding of future N dynamics at catchment scale has led to the incorporation of various approaches and assumptions into prediction and assessment methodologies. For example, the critical load model FAB (Henriksen and Posch, 2001) embraces the N saturation principle and assumes that at some time in the future, immobilisation of N in the soil will be constant and relatively small. The immobilisation rate will be equal to the long-term annual amount of N which is used for the continuous build-up of stable C/N compounds in the soil (Posch and De Vries, 1999) plus N lost to denitrification plus the N retained within the lake. This provides the absolute worst case of NO3 leaching to surface waters and since dynamics are not included in the FAB model there is no need to understand the mechanism by which this occurs, the variables that control it or the rate at which the NO3
leaching increases. Alternatively, the MAGIC model was originally formulated (Cosby et al., 1995) to assume that N saturation did not occur and that the terrestrial catchment continued to immobilise N at the current rate as a direct proportion of N deposited. This assumes that effectively all NO3 in surface water results from direct run-off and may represent ‘hydrologic’ N. Clearly, under this model, if future N deposition is reduced, the flux of NO3 reaching the surface water will also be reduced and this represents a ‘best case’ of NO3 leaching. The absolute ‘best case’, not tested here, is one whereby the deposition of N falls below the terrestrial and aquatic biological requirement and so N leaching is zero. Recently, MAGIC has been further developed to embrace the N saturation concept. This has involved inclusion of dynamic equations for N cycling through the introduction of a soil organic matter compartment with the controls on NO3 leakage from the soil, based conceptually on an empirical model described by Gundersen et al. (1998). The intention, therefore, is that this soil organic compartment be observable and/or interpretable at the catchment scale. This model has previously been tested for forested systems (Wright et al., 1998) but not for moorland systems or against observed data at catchment scale.
The Lochnagar catchment in N.E. Scotland has been monitored for 12 years as part of the UK Acid Waters Monitoring Network (UKAWMN; Monteith and Evans, 2000) and over this period has shown increased NO3 concentration despite a relatively constant observed flux of deposited N (Fig. 1). This paper describes the application of the MAGIC model to this site under both ‘best’ and ‘worst’ cases of N leaching, an attempt to quantify the soil organic C and N pool at catchment scale and an assessment of the potential impact of N leaching on longer-term water chemistry predictions.
Model description
MAGIC is a process-oriented, lumped model of soil and surface water chemistry (Cosby et al., 1995), described here as MAGIC5, which has recently been further developed to incorporate N dynamics and called here MAGIC7 (Cosby et al., 2001). There were no process-based mechanisms for N retention in the soil in MAGIC5 and first order uptake coefficients were calibrated to represent catchment immobilisation such that input matched output at present day. These uptake coefficients were then assumed to remain constant into the future. This represents a ‘best’ case of N leakage since catchments that do not currently leak N will not leak in the future as N deposition is reduced.
The N dynamics in MAGIC7 are based conceptually on an empirical model described by Gundersen et al. (1998),
are similar to those implemented in the SMART model (De Vries et al., 1994) and are fully described by Cosby et al. (2001). MAGIC7 simulates two species of inorganic N in soil and surface waters, NO3 and ammonium (NH4). The major processes affecting these ions in soils have been incorporated, explicitly or implicitly, and include atmospheric deposition, nitrification, denitrification, mineralisation, uptake by plants, immobilisation into soil organic matter, export to surface water and in-lake retention. Atmospheric deposition of NO3 and NH4 and denitrification rates are specified as inputs to the model. Nitrification (biological conversion of NH4 to NO3) is modelled as a first order process. Immobilisation of inorganic N into the soil organic matter is controlled by the C/N ratio of the soil organic compartment (Gundersen et al., 1998). It is assumed that if the C/N ratio is above an upper threshold value (CNUP) then all incoming inorganic N is immobilised. If the C/N ratio is below a lower threshold value (CNLO) then no immobilisation occurs and all incoming inorganic N is leached to the surface water. The proportion of inorganic N immobilised is then assumed to vary linearly from 100% to 0% as the C/N ratio of the organic matter declines from CNUP to CNLO. This empirically based method Fig. 1. Observed annual inorganic N deposition fluxes (top panel) as
measured at the nearby Allt a’Mharcaidh collector and observed surface water NO3 concentrations at Lochnagar (bottom panel)
0 4 8 12 88 90 92 94 96 98 Flux (meq m-2 ) NO3 NH4 0 10 20 30 40
Jul-88 Jul-90 Jul-92 Jul-94 Jul-96 Jul-98
NO
3
(µeq l
Modelling nitrogen dynamics at Lochnagar, N.E. Scotland
for estimating immobilisation rates requires calibration of the upper and lower threshold C/N values. The inorganic N immobilised is added to the N in the organic matter causing a decline in the C/N ratio as N deposition accumulates. This model represents a ‘worst’ case for future N leaching since NO3 leaching will occur even with reduced inorganic N deposition as a result of continued input to the soil organic N pool. The rate at which N leaching occurs then depends upon the size of the organic C pool in the catchment and the slope of the line joining CNUP and CNLO. In order for the aggregated representation of the N cycle in MAGIC7 to function correctly, therefore, the characteristics of the soil organic matter compartment must be quantified adequately from field sampling or estimated from mapped information.
The study site and data sources
The Lochnagar catchment (NO 252 859) is located in N.E. Scotland on the eastern edge of the Cairngorm Mountains (Fig. 2). It has a total area of 102 ha with an altitudinal range of 790-1150 m, most of which is covered by montane vegetation including Calluna vulgaris, Empetrium, Vaccinium myrtillus, Lycopodium and some sphagnum sp.
near the loch edge. A particularly prominent feature of this catchment is a steep north-facing corrie that comprises c.30% of the total catchment area. Geologically the catchment is composed of biotite granite. The soils are derived from the Countesswells Association and range from poorly developed Alpine podzols on the steeper slopes (33% of catchment area) to deep peats at lower altitudes surrounding the loch (5%). Rock and lithosols (32%) and shallow peat (20%) comprise the other dominant soil types. The loch has an area of c.10 ha (c.10% of the total catchment area) and has no identifiable input streams.
The site forms part of the UKAWMN, established in 1988 and the loch is sampled at the outlet four times per year for chemical analysis (Monteith and Evans, 2000). Wet deposition data is derived from the nearest located collector in the UK Acid Deposition Monitoring Network, the River Mharcaidh (NH 876 052). For N, dry deposition represents a significant component of total deposition and is estimated from extrapolation of measured concentration fields of the pollutant gases and application of a process-based model of the deposition process (Smith et al., 2000). Total NO3 and NH4 deposition is then obtained from the UK 5x5 km grid (Fowler and Smith, 2000). Historical deposition is assumed to follow estimated emission trajectories for S, NH4 (RGAR, 1990) and NO3 (Simpson et al., 1997). Run-off is assumed to be 90% of rainfall.
Soil physical and chemical parameters are derived from two approaches: a procedure to catchment weight soil base saturation (%BS) and cation exchange capacity (CEC), and; a procedure to catchment weight soil organic C and N pools. For all soil types identified in the catchment, the %BS and CEC are profile weighted according to horizon depth and bulk density. Soil parameters are then subsequently weighted according to their spatial coverage in the catchment (Table 1). This process generates a single value for each parameter (i.e. soil depth, bulk density, CEC, exchangeable calcium (Ca), magnesium (Mg), sodium (Na), potassium (K) and %BS) for the catchment (Helliwell et al., 1998).
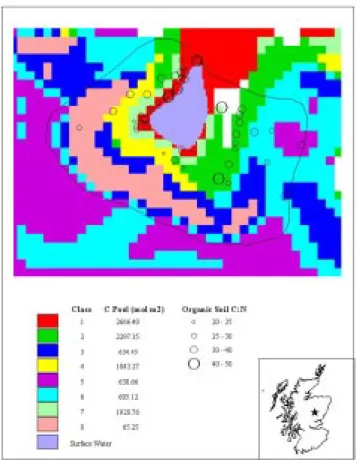
The estimation of catchment weighted C and N pools in the soil organic compartment for the application of MAGIC7 utilised data describing the C and N content of 69 samples collected in May 2000. Individual C/N ratios of the organic soil ranged from 20–50. In order to calculate weighted catchment parameter values for C and N, the soils within the catchment were mapped according not only to soil type but also by the catchment slope and altitude to give eight soil classes (Fig. 2). Carbon pools were greatest for deep organic soils at the base of the catchment (Classes 1 and 2) and smallest for the thin ranker soils on the mountain plateau. A similar spatial weighting procedure as that used for the calculation of base saturation and CEC as described earlier Fig. 2. Map of soil classes at Lochnagar indicating mean C pool
was adopted to calculate total catchment pools. This produced a total C pool of 967 mol m-2, a total N pool of 26 mol m-2 and a C/N (mol mol-1) of 37.2.
Model calibration and application
From the recent analysis of the UKAWMN chemistry data at this site (Monteith and Evans, 2000), the trend identified towards decreased non-marine SO4 precludes the use of mean data for the whole monitoring period (1988–2000) to describe the calibration targets for surface water chemistry. Consequently, the mean of the 1988–1993 period, when no significant trends were observed, was used to set the targets for calibration. For soils, the values generated from the spatial weighting procedure are used to define the soil base cation targets for both MAGIC5 and MAGIC7 simulations. The model calibration procedure was sequential and followed previously documented methods (Jenkins et al., 1997). First the chloride (Cl) and S dry deposition was adjusted to match observed surface water concentrations on the assumption that Cl is conservative within the catchment and soil S adsorption is currently very low. Next the NO3 concentrations were matched by adjusting the parameters controlling N dynamics in the respective models. For MAGIC5 (‘best case’) 100% catchment retention of N was required to match observed mean 1988–1993 surface water NH4 and NO3 concentrations, respectively. It is also assumed that direct deposition of NH4 to the lake is nitrified completely at each time step.
For MAGIC7 (‘worst case’) N calibration, the present day soil organic C and N pools are quantified from field data (see earlier). Surface water NO3 concentration has been observed to have increased from c.10 ueq l-1 in 1988-93 to c.17 ueq l-1 in 2000. Given that direct deposition of inorganic N to the loch, again assuming that all NH4 directly deposited on the loch is nitrified, produces a concentration of c.9 ueq l-1, NO
3 leaching from the terrestrial catchment must be assumed to have begun just prior to 1988. It is further assumed that nitrification of NH4 in soil is 100% at each time-step, that in-lake retention of N is not important at this site and that there is no change in the soil C pool over time. Given that the total N deposition flux to present day is known, therefore, the historical N pool can be adjusted to match the present day observed soil C/N. At the same time, CNUP and CNLO are adjusted to change the slope and position of the net immobilisation curve and so match the observed NO3 breakthrough. The net immobilisation curve calibrated to match the observations (Fig. 3) has a lower slope relative to the plot-scale leaching data reported by Gundersen et al. (1998) across a range of C/N values.
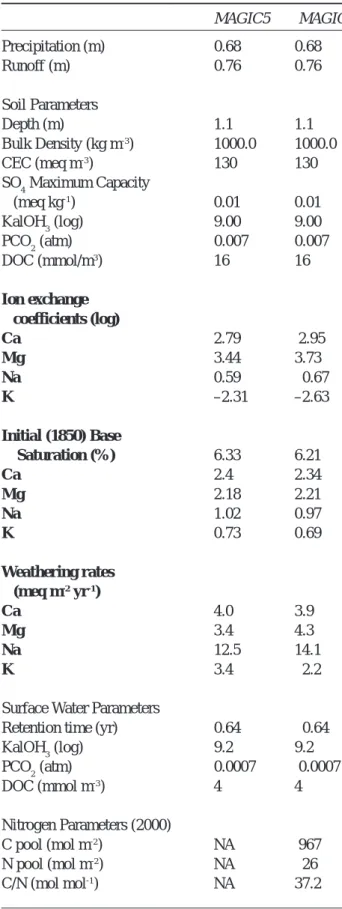
Table 1. Values of fixed and calibrated (bold) model parameters for the two model structures.
MAGIC5 MAGIC7 Precipitation (m) 0.68 0.68 Runoff (m) 0.76 0.76 Soil Parameters Depth (m) 1.1 1.1 Bulk Density (kg m-3) 1000.0 1000.0 CEC (meq m-3) 130 130 SO4 Maximum Capacity (meq kg-1) 0.01 0.01 KalOH3 (log) 9.00 9.00 PCO2 (atm) 0.007 0.007 DOC (mmol/m3) 16 16 Ion exchange coefficients (log) Ca 2.79 2.95 Mg 3.44 3.73 Na 0.59 0.67 K –2.31 –2.63 Initial (1850) Base Saturation (%) 6.33 6.21 Ca 2.4 2.34 Mg 2.18 2.21 Na 1.02 0.97 K 0.73 0.69 Weathering rates (meq m-2 yr-1) Ca 4.0 3.9 Mg 3.4 4.3 Na 12.5 14.1 K 3.4 2.2
Surface Water Parameters
Retention time (yr) 0.64 0.64
KalOH3 (log) 9.2 9.2 PCO2 (atm) 0.0007 0.0007 DOC (mmol m-3) 4 4 Nitrogen Parameters (2000) C pool (mol m-2) NA 967 N pool (mol m-2) NA 26 C/N (mol mol-1) NA 37.2
Modelling nitrogen dynamics at Lochnagar, N.E. Scotland
Following calibration of the acid anions, the observed base cation concentrations on the soil exchange complex and in surface water are matched by adjusting the soil selectivity coefficients and weathering rates. Both models were calibrated separately but base cation selectivity coefficients and weathering rates are very similar and well within the range of calibration uncertainty (Table 1).
Observed annual deposition fluxes of all major ions are used to drive the model from 1988 to 1999. From 2000 to 2010 a linear decrease in N and S deposition fluxes is assumed to reach the deposition level predicted by the HARM model for the emissions agreed under the Gothenburg Protocol. HARM (Metcalfe and Whyatt, 1995) is a source-receptor deposition model developed for use in the UK. Except for the period of observed deposition fluxes (1988–1999), deposition of base cations and Cl are assumed to be constant. Beyond 2010, deposition of S and N is assumed to remain constant to 2040.
Results
The simulated historical pattern of surface water NO3 concentration is the same for both MAGIC5 and MAGIC7 (Fig. 4) to the mid-1980s and shows a gradual increase as a result of increasing deposition flux directly to the loch. The rising trend in observed surface water NO3 concentration 1988–2000 is matched by the MAGIC7 simulation (Fig. 4). Observed concentrations are, however, more variable from year to year indicating that factors other than N deposition influence net immobilisation and, indeed, other processes operate in the catchment to affect NO3 concentration. In reality, temperature and rainfall variation within and between years will impact significantly the N dynamics and these controls are not incorporated in the
model. For MAGIC5, however, simulated NO3 concentration remains almost constant over the period of observation and the model cannot match the observed increase. MAGIC5 assumes a constant net retention of N deposition at each time step and so changes in surface water NO3 concentration can only be caused by changes in direct deposition to the loch. Since the observed deposition flux is relatively stable (Fig. 1) simulated surface water concentrations show little change.
The long-term N dynamics simulated within MAGIC7 (Fig. 5) show that NO3 concentration in the loch rose steadily as N deposition increased as a result of direct deposition to the loch. The soil C/N ratio gradually declines as the N deposition accumulates in the catchment until CNUP is reached in 1985 and, thereafter, the percentage of deposited N retained decreases. Note that the net retention of incoming N to the catchment is 95% in 2000.
Future predictions of NO3 concentration differ between the two model structures (Fig. 4). In MAGIC5, surface water concentrations decrease in line with the reductions in N deposition under the Gothenburg Protocol, again as a result of the change in direct deposition to the loch. In MAGIC7, NO3 concentration is predicted to stabilise to 2010 as N deposition decreases but the percentage retention decreases further as N continues to accumulate in the soil. Beyond Fig. 3. The calibrated relationship describing C/N ratio (mol mol-1)
and NO3 leaching at Lochnagar (line) compared to the empirical relationship derived from data for several European forested sites (squares; Gundersen et al., 1998). The current ‘position’ of
Lochnagar, as described by the field data, is indicated by the arrow.
Fig. 4. Simulated historical and future surface water NO3
concentrations (top panel) from MAGIC5 (best case; thin line) and MAGIC7 (worst case; thick line). Only MAGIC7 is capable of matching the observed increase in NO3 concentrations (bottom
panel) 0 0.2 0.4 0.6 0.8 1 1.2 1.4 10 15 20 25 30 35 40 C/N (Upper Soil) N Out/In Flux Lochnagar 0 20 40 1848 1888 1928 1968 2008 NO 3 (µeq l -1) 0 10 20 30 1985 1990 1995 2000 NO 3 (µeq l -1 )
2010, therefore, assuming constant N deposition at the level agreed under the Gothenburg Protocol, NO3 concentrations are predicted to increase further.
For SO4, the model simulations are identical and to 1988 closely match the assumed historical pattern of deposition flux, increasing to a peak in the early 1970s and then decreasing sharply (Fig. 6). Since 1988, SO4 concentration stabilised until 1995 and then decreased further. The model simulation closely matches the observed annual mean
concentrations (Fig. 6). The assumed linear reduction to 2010 in response to the Gothenburg Protocol leads to a further steep decline in surface water SO4 concentration (Fig. 6). Beyond 2010, emissions are assumed to remain constant and so the SO4 concentration remains stable.
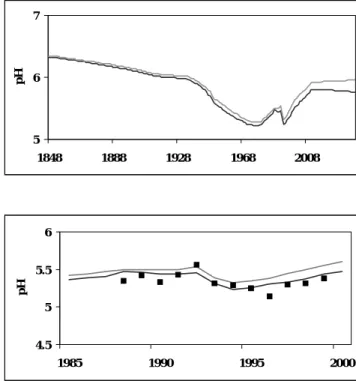
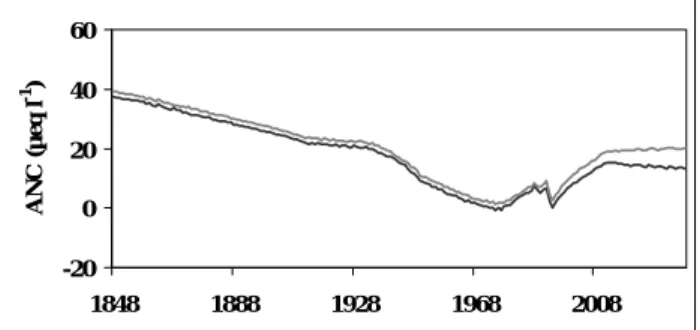
As a consequence of these simulated historical changes in S and N, both pH (Fig. 7) and ANC (Fig. 8) are predicted to have decreased steadily until the 1970s. The small difference in the two model simulations is the result of the uncertainty inherent in the calibration process. The decrease in S deposition then prompted a recovery into the mid 1980s. Over that period, increased N deposition had not led to NO3 breakthrough and the recovery reflects only the decrease in SO4 concentration. Since the mid-1980s, the increase in NO3, as a result of decreased retention of N in the catchment soils and constant SO4 concentration, caused a decline in ANC. Thereafter, as SO4 declined further, ANC shows a further recovery. This pattern of response is well matched by both models through the period 1988–2000 (Figs. 7 and 8) although the difference in NO3 leaching between the models is evident in the small but gradually increasing difference in the pH and ANC simulations.
A further improvement in ANC is predicted to occur by Fig. 5. Simulated historical and future N dynamics within MAGIC7
(worst case). Increasing N retention in the soil lowers the C/N and causes increased NO3 leaching in future despite decreased N
deposition
Fig. 6. Simulated historical and future surface water SO4
concentration (top panel). The pattern of change is closely related to change in deposition flux since S adsorption is assumed to be low. Simulated concentrations (line) match the observed concentrations (squares) well over the period 1988–2000 (bottom panel). The
simulations are identical for both MAGIC5 and MAGIC7.
Fig. 7. Simulated historical and future surface water pH (top panel)
for MAGIC5 (best case; thin line) and MAGIC7 (worst case; thick line). Differences between the two models to present day are negligible and represent calibration uncertainty. For future predictions, the difference results from the different N dynamics in the models. Both models are capable of matching the observed data
1988–2000 (bottom panel). 0 20 40 60 80 100 120 1848 1888 1928 1968 2008 NO 3 (µeq l
-1 ) & C/N (mol mol -1 ) % N Retention C/N N Dep N out 0 20 40 60 80 100 120 1848 1888 1928 1968 2008 SO 4 (µeq l -1 ) 0 20 40 60 80 1985 1990 1995 2000 SO 4 (µeq l -1 ) 5 6 7 1848 1888 1928 1968 2008 pH 4.5 5 5.5 6 1985 1990 1995 2000 pH
Modelling nitrogen dynamics at Lochnagar, N.E. Scotland
both models to 2010. In MAGIC5 this results from the decrease in both SO4 and NO3 whilst in MAGIC7, the decrease in SO4 concentration is greater than the increase in NO3 leakage and so both pH and ANC continue to recover although at a slower rate than in MAGIC5. It is beyond 2010 that the model simulations deviate substantially. In MAGIC7, despite the lower N deposition, the soil continues to accumulate N, net retention decreases and NO3 leaching increases. As a result, the longer term prediction is for a further acidification driven by NO3 leaching (Figs. 7 and 8). In MAGIC5, both pH and ANC are predicted to continue to increase at the lower level of deposition (Figs. 7 and 8).
Discussion
Both model structures are able to capture the observed changes in surface water acidity status over the 12 year period of record. The one exception being that MAGIC5 is unable to match the observed increase in NO3 concentrations. This difference is a direct result of the model structure and is significantly more important than the uncertainties involved in the calibration procedure. Nevertheless, the match to pH and ANC is generally
acceptable for both model structures. It is clear, however, that the models predict significantly different responses in the longer term, i.e. beyond 2010, and this has implications for the future review of the Gothenburg Protocol.
For MAGIC7, the close fit of the model to the 12 years of observed data indicates that a simplified representation of catchment chemical and biological processes can capture the dynamics of surface water N dynamics. Nevertheless, there are two important underlying assumptions in this model application that have yet to be tested adequately. Firstly, it is assumed that the increase in surface water NO3 concentrations is the result of decreased catchment retention of N as a result of a long-term reduction in net N immobilisation alone. Only continued monitoring will confirm whether this is the case. It is possible to hypothesise other mechanisms that might also lead to a reduction in catchment retention such as, increased mineralisation of organic N or decreased plant uptake as a result of climatic conditions. In both cases, the increased NO3 leaching will be temporary. In this respect the future predictions may be regarded as a worst case which over a sufficiently long time period will produce the low immobilisation rates currently included in the FAB critical loads model (Henriksen and Posch, 2001).
It is also possible that the increase in NO3 at Lochnagar merely represents a temporary transient which does not result from N saturation in the soil and concentrations will decrease again in the future. In this respect, temporary increases in N leaching have been reported in Europe (Lange Bramke; Wright et al., 2001) and in N.E. US (Mitchell et al., 1996) where the reasons were unexplainable in terms of acidification processes but were probably climate induced. Clearly, if this is the case, then neither MAGIC5 or MAGIC7 provides an appropriate model structure to describe long-term N dynamics. In addition, Lochnagar is the only site in the UKAWMN with an increasing trend in NO3, despite several sites with currently similarly high or higher NO3 concentrations (Monteith and Evans, 2000). At these other sites, it is quite likely that MAGIC7 will be unable to match the relatively constant NO3 concentrations over the last 10 years and instead will predict a gradual increase in NO3 concentrations. This implies that the mechanism whereby NO3 leaching increases with a continuous decline in soil C/ N might not be generally applicable. On this basis, it must be concluded that further testing of MAGIC7 is required before it is used regionally to predict future N dynamics. Nevertheless, this does not preclude the use of MAGIC7 as a ‘worst’ case model.
Secondly, the relationship between soil C/N and retention of incoming inorganic N described by Gundersen et al. (1998) was determined for soil waters in forested plots. The Fig. 8. Simulated historical and future surface water ANC (top
panel) for MAGIC5 (best case; thin line) and MAGIC7 (worst case; thick line). Differences between the two models to present day are negligible and represent calibration uncertainty. For future predictions, the difference results from the different N dynamics in the models. Both models are capable of matching the observed data
1988–2000 (bottom panel). -20 0 20 40 60 1848 1888 1928 1968 2008 ANC (µeq l -1 ) -10 0 10 20 1985 1990 1995 2000 ANC (µeq l -1 )
relationship has not yet been shown for moorland systems and, indeed, attempts to relate soil C/N to surface water NO3 concentrations in the Cairngorms (immediately adjacent to the Lochnagar catchment) show no clear evidence of this mechanism (Helliwell et al., 2001a). It is likely that variability in drainage characteristics and water pathways both within and between catchments, different soil type/vegetation composition and different management of grassland systems all contribute in masking the relationship at catchment scale (Helliwell et al., 2001b).
In this respect, the soil C/N varies considerably across a catchment whilst the catchment outflow integrates the NO3 leakage from all of the soils in the catchment. The slope of the net immobilisation curve used here was essentially determined by the observed increase in surface water NO3 and the calculated soil C and N pools (Fig. 3). This is somewhat less steep than would be derived from the data reported by Gundersen et al. (1998). There remains a degree of uncertainty in the estimation of the size of the catchment C and N pools and if the C pool was smaller, the slope of the curve would need to be steeper, the position of CNUP would change and the NO3 leakage into the future would be greater. In this case, the worst case for net N immobilisation (cf. the FAB steady-state model) would occur more quickly. It is also possible that the lumped soil pools incorporated in MAGIC conceal a variation in N dynamics between different soil and vegetation types within the catchment. If this is the case, the overall catchment C/N is irrelevant as a control on N leaching and the characteristics of those soil ‘patches’ that are leaking N need to be determined. This will require further field monitoring. Past, present and future inorganic N deposition fluxes at the site are also key inputs affecting the model predictions. The quantification of these deposition fluxes is also known to be uncertain at present. Confirmation of the hypothesis for N saturation and breakthrough at Lochnagar will only be achieved through continued monitoring of deposition and surface water chemistry at the site. Refinements in our understanding of N dynamics will improve the reliability of the existing model. In addition, improved estimates of deposition fluxes and pool sizes will aid in the prediction of the time-scale of the predicted responses. In the meantime, the use of these two alternative model structures, with their inherent assumptions regarding catchment N dynamics, to provide ‘best’ and ‘worst’ case simulations seems the most viable option to predict the response to future emission reductions.
Acknowledgements
This work has been supported in part by the UK Department of the Environment and the Regions (contract nos. EPG 1/
3/117 and EPG 1/3/133), the Commission of the European Communities under the RECOVER:2010 project (EVK1-CT-1999-00018) and the MOLAR project (EVK4-CT95-0007) and the Scottish Executive Environmental and Rural Affairs Department (SEERAD). We thank Jo Porter for his continued efforts in the field and Lynne Johnson for GIS assistance.
References
Aber, J.D., Nadelhoffer, K.J., Steudler, P. and Melillo, J.M., 1989. Nitrogen saturation in northern forest ecosystems. Bioscience,
29, 378–387.
Cosby, B.J., Hornberger, G.M., Galloway, J.N. and Wright, R.F., 1995. Modelling the effects of acid deposition: assessment of a lumped parameter model of soil water and streamwater chemistry. Water Res., 21, 51–63.
Cosby, B.J., Ferrier, R.C., Jenkins, A. and Wright, R.F., 2001. Modelling the effects of acid deposition: refinements, adjustments and inclusion of nitrogen dynamics in the MAGIC model. Hydrol. Earth Syst. Sci., 5, 499–527.
De Vries, W., Reinds, G.J., Posch, M. and Kamari, J., 1994. Simulation of soil response to acidic deposition scenarios in Europe. Water Air Soil Pollut., 78, 215–246.
Dise, N.B. and Wright, R.F., 1995. Nitrogen leaching from European forests in relation to nitrogen deposition. Forest Ecol.
Manage., 71, 153–161.
Emmett, B.A., Boxman, D., Bredemeier, M., Gundersen, P., Kjønaas, O.J., Moldan, F., Schleppi, P., Tietema, A. and Wright, R.F., 1998. Predicting the effects of atmospheric nitrogen deposition in conifer stands: Evidence from the NITREX ecosystem-scale experiments. Ecosystems, 1, 352–360. Evans, C.D., Cullen, J.M., Alewell, C., Kopácek, J., Marchetto,
A., Moldan, F., Prechtel, A., Rogora, M., Vesely, J. and Wright, R.F., 2001. Recovery from acidification in European surface waters. Hydrol. Earth Syst. Sci., 5, 283–297.
Ferrier, R.C., Jenkins, A., Cosby, B.J., Helliwell, R.C., Wright, R.F. and Bulger, A.J., 1995. Effects of future N deposition scenarios on the Galloway region of Scotland using a coupled sulphur and nitrogen model (MAGIC-WAND). Water Air Soil
Pollut., 85, 707–712.
Fowler, D. and Smith, R., 2000. Spatial and temporal variability in the deposition of acidifying species in the UK between 1986 and 1997. In: UK Acid Water Monitoring Network: 10 Year
Report, D.T. Monteith and C.D. Evans (Eds.). ENSIS
Publishing, London, 363 pp.
Gundersen, P., Emmett, B.A., Kjønaas, O.J., Koopmans, C.J. and Tietema, A., 1998. Impact of nitrogen deposition on nitrogen cycling in forests: a synthesis of NITREX data. Forest Ecol.
Manage., 101, 37–55.
Helliwell, R.C., Ferrier, R.C., Evans, C.D. and Jenkins, A., 1998. A comparison of methods for estimating soil characteristics in regional acidification models; an application of the MAGIC model to Scotland. Hydrol. Earth Syst. Sci., 2, 509–520. Helliwell, R.C., Wright, R.F., Ferrier, R.C., Jenkins, A. and Evans,
C.D., 2001a. Acidification of lochs in the Cairngorm Mountains, N.E. Scotland. Water Air Soil Poll., (in press).
Helliwell, R.C., Ferrier, R.C. and Kernan, M.R., 2001b. Interaction of nitrogen deposition and land use on soil and water quality in Scotland: issues of spatial variability and scale. Sci. Total Envir.,
Modelling nitrogen dynamics at Lochnagar, N.E. Scotland
Henriksen, A. and Posch, M., 2001. Steady-state models for calculating critical loads of acidity for surface waters. Water
Air Soil Pollut.: Focus, 1, 375–398.
Jenkins, A., 1999. End of acid reign? Nature, 401, 537–538. Jenkins, A., Renshaw, M., Helliwell, R., Sefton, C., Ferrier, R.
and Swingewood, P., 1997. Modelling surface water
acidification in the UK. Application of the MAGIC model to the Acid Waters Monitoring Network. IH Report 131, Wallingford,
UK, 54 pp.
Metcalfe, S.E. and Whyatt, J.D., 1995. Modelling future acid deposition with HARM. In: Acid rain and its impact: the critical
loads debate, R.W. Battarbee (Ed.), 27-36. ENSIS Publishing,
London.
Mitchell, M.J., Driscoll, C.T., Kahl, J.S., Likens, G.E., Murdoch, P.S. and Pardo, L.H., 1996. Climatic controls of nitrate loss from forested watersheds in the northeast United States. Environ.
Sci. Technol., 30, 2609–2612.
Monteith, D.T. and Evans, C.D. (Eds.), 2000. UK Acid Waters
Monitoring Network: 10 Year Report. ENSIS Publishing,
London, 363 pp.
Posch, M. and De Vries, W., 1999. Derivation of critical loads by steady-state and dynamic soil models. In: The Impact of Nitrogen
Deposition on Natural and Semi-Natural Ecosystems, S.J.
Langan (Ed.), 213–234. Kluwer Academic Publishers, Dordrecht, The Netherlands.
RGAR, 1990. Acid deposition in the United Kingdom, 1986-1988.
UK Review Group on Acid Rain. Third report. Department of
the Environment, London, 124 pp
Simpson, D., Olendrzynski, K., Semb, A., Støren, E. and Unger, S., 1997. Photochemical oxidant modelling in Europe:
multi-annual modelling and source receptor relationships. EMEP/
MSC-W Report 3/97), Norwegian Meteorological Institute, Oslo, Norway, 75 pp.
Smith, R.I., Fowler, D., Sutton, M.A., Flechard, C. and Coyle, M. 2000. Regional estimation of pollutant gas deposition in the UK: model description, sensitivity analyses and outputs. Atmos.
Environ., 34, 3757–3777.
Stoddard, J.L., 1994. Long-term changes in watershed retention of nitrogen: its causes and aquatic consequences. In:
Environmental Chemistry of Lakes and Reservoirs, L. Baker
(Ed.), 223–284. Advances in Chemistry Series, No. 237, American Chemical Society, Washington, DC.
Stoddard, J.L., Jeffries, D.S., Lükewille, A., Clair, T.A., Dillon, P.J., Driscoll, C.T., Forsius, M., Johannessen, M., Kahl, J.S., Kellogg, J.H., Kemp, A., Mannio, J., Monteith, D.T., Murdoch, P.S., Patrick, S., Rebsdorf, A., Skjelkvåle, B.L., Stainton, M.P., Traaen, T., van Dam, H., Webster, K.E., Wieting, J. and Wilander, A., 1999. Regional trends in aquatic recovery from acidification in North America and Europe. Nature, 401, 575–578. Wright, R.F. and van Breemen, N., 1995. The NITREX project:
an introduction. Forest Ecol. Manage., 71, 1–5.
Wright, R.F., Emmett, B.A. and Jenkins, A., 1998. Acid deposition, land-use change and global change: MAGIC 7 model applied to Aber, UK (NITREX project) and Risdalsheia, Norway (RAIN and CLIMEX projects). Hydrol. Earth Syst. Sci., 2, 385–397. Wright, R.F., Alewell, C., Cullen, J.M., Evans, C.D., Marchetto,
A., Moldan, F., Prechtel, A. and Rogora, M., 2001. Trends in nitrogen deposition and leaching in acid-sensitive streams in Europe. Hydrol. Earth Syst. Sci., 5, 299–310.