Characterizing the mechanical and transport coupling in
self-compacting
concrete
Part
I:
morphological
mechanical and boundary conditions
modeling at the
meso-scale
Davood Niknezhad
1, Balaji Raghavan
1, Fabrice Bernard
1, Siham Kamali-Bernard
11
Laboratory of Civil and Mechanical Engineering (LGCGM), INSA of Rennes, Davood.Nik-nezhad@insa-rennes.fr
1
Laboratory of Civil and Mechanical Engineering (LGCGM), INSA of Rennes, Balaji.Raghavan@insa-rennes.fr 1
Laboratory of Civil and Mechanical Engineering (LGCGM), INSA of Rennes, Fabrice.Bernard@insa-rennes.fr 1
Laboratory of Civil and Mechanical Engineering (LGCGM), INSA of Rennes, Siham.Kamali-Bernard@insa-rennes.fr
RÉSUMÉ. Dans la première partie de notre travail, nous commencerons par présenter un modèle morphologique explicite du béton à l'échelle mésoscopique, suivie par la simulation de son comportement mécanique et de la distribution de l’endommagement sous une charge de compression, par l’utilisation de l’analyse EF en 3D des essais de compression quasi-statique pour un spécimen composite virtuel à différentes fractions volumiques granulaires en utilisant un modèle continu visco-plastique avec un endommagement isotrope au taux indépendant (CDP) pour le comportement mécanique de la matrice (mortier) et un modèle mésoscopique morphologique explicite à deux phases pour le composite avec une garniture sphérique aléatoire avec des sphères de différents diamètres (ce qui correspond à la répartition granulométrique et notamment la fraction granulaire), et des mailles conformes EF correspondantes au composite final. Différentes conditions aux limites seront considérées de façon à déterminer les conditions de chargement appropriées pour le problème mécanique.
ABSTRACT. In the first part of this contribution, we will begin by presenting an explicit morphological model of concrete at the mesoscale, followed by simulation of its mechanical behavior and damage distribution under compressive loading, using 3D FE analyses of quasi-static compression tests for virtual composite specimens at different aggregate fractions using a rate-independent isotropic in viscid plastic damage (CDP) continuum model for the mechanical behavior of the matrix (mortar) and an explicit morphological two-phase mesoscale model for the composite with a random spherical packing of spheres with different diameters (corresponding to the particular granulometric distribution and aggregate fraction), along with corresponding conforming FE meshes for the final composite. We consider different boundary conditions so as to determine the appropriate loading conditions for the mechanical problem.
MOTS-CLÉS: modélisation mésoscopique, fractions volumique, conditions aux limites, endommagement, éléments finis. KEYWORDS: mesoscopic modeling, aggregate fractions, boundary conditions, damage, Finite Element Method (FEM).
1. Introduction
The cementitious composites are typically heterogeneous brittle materials that are known to fracture through the formation, growth and coalescence of microcracks [ALE 12]. Failure processes in concrete depend on the loading rate and are significantly influenced by micro-inertia of the material adjacent to a propagating microcrack and moisture in the capillary pores.
A realistic numerical simulation of material behavior must adequately represent the influence of as many length scales as possible on the mechanical as well as hygral response. The meso-scale is divided into a sub-mesoscale where the mortar is considered to be constituted by sand particles embedded in a homogenous cement paste, and a mesoscale itself representing the material as a two or three phase composite: mortar (matrix) and coarse aggregate (inclusions) with or without an Interfacial Transition Zone or ITZ). Since mesoscopic modeling of the composite is ostensibly the way to go, a suciently detailed morphological model for the mortar-aggregate composite is the next step.
In this work, we investigate the mechanical and transport properties of cementitious composites using a morphological 3D matrix-inclusion-ITZ model for the mesoscale behavior. Assuming a compression damaged plasticity-based behavior for the matrix phase under quasi-static loading, the model is used to determine the effect of volume fraction and boundary conditions on the mechanical response of the composite specimen under uniaxial loading.
2. Materials and experimental techniques 2.1. Materials and mixtures
The mortar phase used in this work is composed of Portland cement CEM I 52.5 N (according to European standard EN 197-1), sand S with grain size 0/4 mm and density 2600 kg/m³ , siliceous gravel with grain size 6.3/10 mm and density 2660 kg/m³ , and a water to cement ratio w/c = 0.368. Fluid Optima 224 based high range water reducer (HRWR) with density 1.05 ± 0.02 gm/cm3 (at 20°C) and pH : 4.70 ± 1.00 was used in order to enhance the flow ability of the mixtures (super-plasticizer). The overall composition is given in Table 1.
Table 1. Composition of the mixed concrete
Constituent kg/m³ of fresh concrete
Cement CEM I 52.5 330 Sand S(0 − 4) 780 Aggregate 760 Limestone powder 240 Water 210 Super-plasticizer (HRWR) 2.8 2.2. Mechanical loading
A standard displacement-controlled uniaxial compression test was performed on a cylindrical specimen of mortar (Figure 1) with dimensions φ110×h50 mm to first obtain the Ultimate Compressive Strength (UCS) of the mortar phase, and this was then used in conjunction with the CEB-FIP Model Code 2010 as well as the envelope curve proposed by [SIM 08] to plot the entire uniaxial compression curve and thus obtain the elastic constitutive and damage parameters for the mortar. This procedure allows us to avoid the usual problems associated with using the experimental compression test for the complete stress-strain curve. The mechanical properties are shown in Table 2, (ρ=density, Y =Young’s modulus, UCS = Ultimate Compressive Strength, and ν = Poisson’s ratio).
Table 2. Mechanical and transport properties of the mortar phase
Phase ρ (gm/cm³ ) UCS (MPa) Y (GPa) ν Permeability (m² )
Figure 1. Experimental Set-up for the uniaxial compression test on φ110×h220 mm specimen of concrete at
28 % aggregate volume fraction.
2.3. Morphological model of concrete at the mesoscale level
An explicit morphological model was previously developed by the authors for representing concrete at the mesoscale, considering the concrete specimen as a two (or three-phase) composite material: In this material the matrix phase consists of the cement mortar, while the inclusions phase consists of the aggregate grains, and the third (optional) phase is the interfacial transition zone (ITZ) for the cement paste, with a variety of contact conditions possible between the three phases.
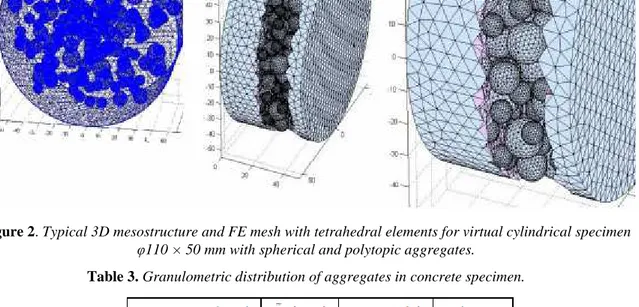
Figure 2. Typical 3D mesostructure and FE mesh with tetrahedral elements for virtual cylindrical specimen
φ110 × 50 mm with spherical and polytopic aggregates.
Full details on the model and techniques used are available in [26]. Using our previous work, we have used a random packing of spheres conforming to the experimental granulometric distribution of the composite specimen (Table 3) and volume fraction representing rounded aggregates ( represents the effective aggregate diameter). In addition, two different specimen geometries have been modeled, cubic and cylindrical. The typical FE meshes generated for the composite mesostructures for the two virtual specimens (with spherical aggregates) are shown in Figure 2.
3. Constitutive Models 3.1. Phase I: Mortar
3.1.1. Mechanical behavior
The main task in failure description is the recognition of damage patterns. Concrete Damage Plasticity (CDP) is a popular constitutive model that was introduced by Kachanov [KAC 58] and further developed by Rabotnov [RAB 71] and Jankoviak et al [JAN 05]. The model has been used in this paper, as in the authors’ previous work [NIK 15], for describing the elasto-plastic mechanical behavior of the mortar phase. This model uses the concept of isotropic damaged elasticity in combination with isotropic tensile and compressive plasticity to represent the inelastic behaviour of the mortar. In this model, the primary mode of failure in compressive loading is crushing while crack propagation is the primary mode of failure in tension, and the constitutive equation of mortar with scalar isotropic damage d takes the following form:
= 1 − : − = 1 − [1]
where is the effective stress tensor. The Abaqus implementation uses a formulation intended to alleviate the mesh dependency of the results that can arise from strain localisation effects. This requires the explicit definition of a characteristic length based on the element geometry and associated with an integration point, as well as the definition of the post-peak tensile strength of the material as a function of the local cracking displacement.
Figure 3. Constitutive Behavior of Cement Mortar under uniaxial (a) compressive (b) tensile loading.
The scalar (isotropic) damage variable d (d = dt in tension and dc in compressive loading respectively) is related to the equivalent plastic strain and the effective stress tensor:
= , ̃ ) [2]
Also, damage states in tension and compression are characterized independently by the equivalent plastic strains in tension and compression, ̃ (t) and ̃ c respectively. In terms of effective stresses, the yield function takes the form:
, ̃ = − 3 ̅ + ̃ !"+ # !" − $ ̃ [3]
Failure via crack propagation (tension) and/or crushing (compression) is represented by increasing values of
̃ (t) and ̃ c respectively, which control the evolution of the yield surface as well as the degradation of the
elastic stiffness of the mortar. The concrete damaged plasticity model assumes nonassociated potential plastic flow. The fundamental group of the constitutive parameters consists of 4 values, which identify the shape of the flow potential surface and the yield surface. Considering the Drucker-Prager model for the flow function:
Where Rt and RC are the uniaxial tensile and compressive strengths of concrete respectively. β is the dilation angle measured in the p−q plane at high confining pressure, m is an eccentricity of the plastic potential surface:
̅ = −-*/+01 [5]
= 23- + ̅ : + ̅ ² [6]
Standard values of β = 35◦, m = 0.1 were assumed in this study. Rc (i.e. the UCS of the mortar) was experimentally identified as described in the previous section. Rt was determined from Rc and the CEB-FIP relationship.
3.2. Phase II:
Aggregates The inclusions or aggregates in concrete may be silicious, calcareous, plastic or vegetal in origin, with corresponding matrix-inclusion contact criteria. For example, calcareous aggregates generally are in perfect contact with the mortar and plastic aggregates have a frictionless sliding contact with the mortar. The traditional approach is to assume linear-elastic-brittle behavior for the aggregates in the mechanical model. Aggregates may also be assumed to have negligibly low permeability as our previous research has showed, even though taking these into account with our approach is extremely simple [NIK 15].
3.3. Phase III:
Interfacial Transition Zone In the general case, we need to consider the effect of a third phase, called ITZ, as an extension of the first phase embedding the aggregates. In this particular study, just as in [NIK 15], the ITZ has been assumed to have no influence on the overall compressive behavior of the concrete specimen [BER 15] or on the homogenized transport properties [BER 15]. This is validated by [RAN 10] where we notethat even though the ITZ plays a role in the crack propagation paths, there is no real effect on the increase in the overall macroscopic damaged permeability. The explanation for this is found in some detail in [54], the presence of a zone with higher porosity (i.e. ITZ) around the aggregates modifies the structure of the paste farther away from the aggregates and leads to a decrease in the porosity of the bulk paste so as to respect the moisture conservation. In other words, the structure of the bulk paste of the mortar phase is different from that of the paste with the same w/c ratio but without a granular skeleton. There is thus only a slight effect of ITZ on the overall uniaxial compressive behavior of mortar as well as on its diffusivity (transport behavior), since the decrease of the porosity in the bulk paste, in effect, counterbalances the increased porosity in the ITZ. In other words, the ITZ phase only alters the crack patterns (damage is concentrated in this zone instead of away from it), so the net change in calculated permeability is negligible. This is clear when we consider the nature of the network mode. the calculated macroscopic permeability involves a summation/assembly of the contribution of individual crack patterns (damaged elements) and the net contribution of two different patterns could well be identical, as in the total amount of damage, leading thus to negligible differences in the calculated permeability.
4. Results and Discussion
4.1. Mechanical Behavior of the composite
Virtual cylindrical composite specimens φ110 × h50 mm were generated at various aggregate volume fractions 10 %, 20 %, 24 %, 28 % and 30 % for the experimental granulometric distribution, and for a uniform granulometric distribution (D50 or the median effective diameter of the experimental distribution) at 28 % volume fraction using the algorithms mentioned in section 2. These were then meshed using the GMSH algorithm to obtain corresponding FE meshes, as seen in section 2. Using a Drucker Prager yield criterion in ABAQUS, FE simulations were performed for two different boundary conditions at the bottom face for the various virtual composite specimens.
The displacement-based compression test was controlled at a speed of 0.25 µm/s and was carried out until failure of the specimen or excessive element distortion. Three different mesostructures with different random aggregate arrangements were studied at 28 % volume fraction and the variation of the simulated UCS was found to be ≤ 1 MPa thus allowing us to use a single mesostructure per aggregate volume fraction for the various FE mechanical simulations. The first main step then was to identify the appropriate boundary conditions on the bottom face so as to accurately represent the experimental conditions during the FE simulation.
Figure 4 and 5 show that this has an extremely significant effect on the simulation results obtained for the mechanical behavior of the specimen. Comparing the simulated UCS of the specimen at 28 % with the
experimentally obtained value of 52.8 MPa, we see that the built-in conditions better represent the loading conditions.
Figure 4. Effect of boundary conditions on bottom face of virtual specimen on the compression curve during
a uniaxial compression test on φ110 × h50 cylindrical concrete specimen at 28 % aggregate volume fraction(a) and damage distribution inside experimental specimen after removal (b).
This is clearly because the specimen was compressed on a non-lubricated steel plate, thus the coefficient of friction was sufficient to prevent non-vertical displacement at the bottom face. In addition, during the experimental compression of the specimen at 28 %, we observed that the damage was localized towards the exterior of the specimen (Figure 4(b)): similar to what was obtained with the built-in boundary conditions (Figure 5), rather than spread out over the entire section. Hence, we retain the built-in boundary conditions for the bottom face for the remaining sets of results.
Figure 5. Comparison of two different boundary conditions on bottom face of virtual specimen during uniaxial
compression at 28 % aggregate volume fraction on damage distribution inside specimen (sectional view).
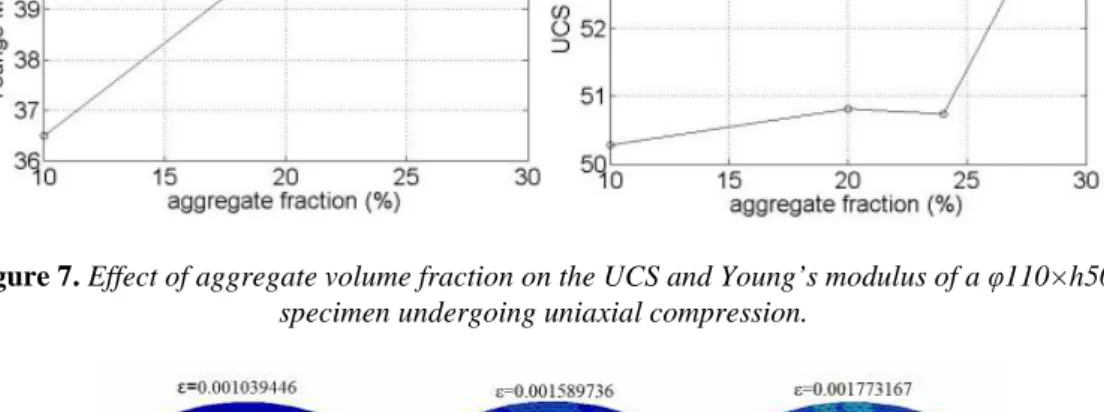
Next, we performed the FE simulations for the 4 different aggregate fractions (Figure 6), and as we expect, the UCS appears to increase with increasing fraction from 10 to 20 %, but from 20 % to 30 % (classical aggregate fractions for industrial concretes) the evolution is not monotonic and we observe a reduction in UCS for aggregate fractions in the neighborhood of 24 % (Figure 7), a phenomenon that we have seen previously [26] and has also been observed experimentally [29]. As expected from experimental observations made in the literature (e.g. [YAN 95]), and can be easily verified by calculating the Mori-Tanaka homogenized modulus for the composite [NIK 15], the Young’s modulus increases in almost linear fashion with the aggregate fraction since the aggregates have a higher rigidity compared to mortar. The typical evolution of damage distribution on
(a)
changing the aggregate granulometric distribution at the same volume fraction have a significant influence on the mechanical response.
Figure 6. Effect of aggregate volume fraction on the compressive behavior during a uniaxial compression
test on φ110 × h50 mm concrete specimen.
Figure 7. Effect of aggregate volume fraction on the UCS and Young’s modulus of a φ110×h50 mm
specimen undergoing uniaxial compression.
Figure 8. Damage distribution on the external surfaces at various points on the simulated uniaxial
The Figure 9 compares the simulation results obtained for two virtual specimens at 28 %, the first with the experimental granulometric distribution and the second with a uniform distribution, i.e. every aggregate having the same diameter = the median aggregate diameter of the experimental distribution.
Figure 9. Effect of granulometric distribution on the compressive behavior during a uniaxial compression
test on φ110 × h50 mm cylindrical concrete specimen at 28 % aggregate volume fraction
5. Conclusions
In this work, we have used our previously developed morphological 3D matrix-inclusion-ITZ model for a cementitious composite at the mesoscale and used this model to perform a series of virtual mechanical tests on a cylindrical composite specimen. We subjected a series of virtual composite specimens at different aggregate fractions and granulometric distributions to quasi-static uniaxial compressive loading with varying boundary conditions, to obtain the simulated damage and strain evolutions.
6. Bibliographies
[ALE 12] ALEXANDER M., BERTRON A., DE BELIE N., «Performance of Cement-Based Materials in Aggressive Aqueous Environments»: State-of-the-Art Report, RILEM TC 211 - PAE, RILEM State-of-the-Art Reports, Springer Netherlands, 2012.
[BER 15] BERNARD F., KAMALI-BERNARD S., «Numerical study of fITZg contribution on mechanical behavior and diffusivity of mortars», Computational Materials Science 102 (0) (2015) 250-257.
[JAN 05] JANKOWIAK T., LODYGOWSKI T., «Identification of parameters of concrete damage plasticity constitutive model», Foundations of Civil and Environmenta Engineering 16 (2005) 53-69.
[KAC 58] KACHANOV L. M., «O vremeni razrusenija v usloviach polzucesti », Izv. Akad. Nauk CCCP, Otd. Techn. Nauk, vol. 8, p. 26 - 31, 1958.
[NIK 15] NIKNEZHAD D., RAGHAVAN B., BERNARD F., KAMALI-BERNARD S., «Towards a realistic morphological model for the meso-scale mechanical and transport behavior of cementitious composites», Composites Part B: Engineering 81 (2015) 72-83.
[RAB 71] RABOTNOV Y. N., « Creep Problems in Structural Members », ZAMM - Journal of Applied Mathematics and Mechanics / Zeitschrift fur Angewandte Mathematik und Mechanik, vol. 51, no 7, p. 575-576, 1971.
[RAN 10] RANGARAJU P.R., OLEK J., DIAMOND S., «An investigation into the inuence of inter-aggregate spacing and the extent of the fITZg on properties of portland cement concretes», Cement and Concrete Research 40 (11) (2010) 1601-1608.
[SIM 08] SIMA JF., ROCA P., MOLINS C., «Cyclic constitutive model for concrete», Engineering Structures 30 (3) (2008) 695-706.