Child nutrition in countries of the Commonwealth of
Independent States: time to redirect strategies?
Adriano Cattaneo
1,*, Arnold Timmer
2, Tamara Bomestar
1, Jenny Bua
1, Sanjiv Kumar
2and Giorgio Tamburlini
11Unit for Health Services Research and International Health, Institute for Child Health IRCCS Burlo Garofolo,
Via dell’Istria 65/1, Trieste, Italy:2UNICEF Regional Office for Central and Eastern Europe and Commonwealth of Independent States, 5–7 Avenue de la Paix, CH 1211 Geneva 10, Switzerland
Submitted 26 November 2007: Accepted 19 May 2008: First published online 23 July 2008 Abstract
Background: Countries in the Commonwealth of Independent States made little progress in child nutrition and mortality between 1990 and 2005. The present paper assesses the nutritional status of children ,5 years of age and discusses possible strategies for improvement.
Methods: Data on low birth weight, infant and young child feeding, underweight, overweight and micronutrient deficiencies were compiled from available reports and databases, complemented through questionnaires to UNICEF Country Offices, and analysed by country, age, gender, urban/rural residence, maternal education and wealth quintiles.
Results: Exclusive feeding in the first 6 months and continuing breast-feeding up to 2 years fall short of WHO and UNICEF recommendations. Com-plementary foods are introduced too early and may be poor in protein and micronutrients. Stunting and underweight are prevalent, especially in children aged 12 to 35 months; overweight is even more prevalent. Vitamin A and I deficiencies are still present in some countries, despite current control efforts. Anaemia ranges between 20 % and 40 %. Higher rates of malnutrition are found in rural areas, children of less educated mothers and lower-income families. Discussion: Current public health strategies should be redirected to address: (i) overall protection, promotion and support of infant and young child feeding, in addition to breast-feeding; (ii) overweight, in addition to underweight and stunting; and (iii) malnutrition as a whole, in addition to micronutrient deficiencies. An equity lens should be used in developing policies and plans and implementing and monitoring programmes. Capacity building, cross-sectoral action, improved data collection within adequate legal frameworks and community engagement should be the pillars of redirected strategies.
Keywords Child malnutrition Infant feeding Overweight Micronutrient deficiency Commonwealth of Independent States
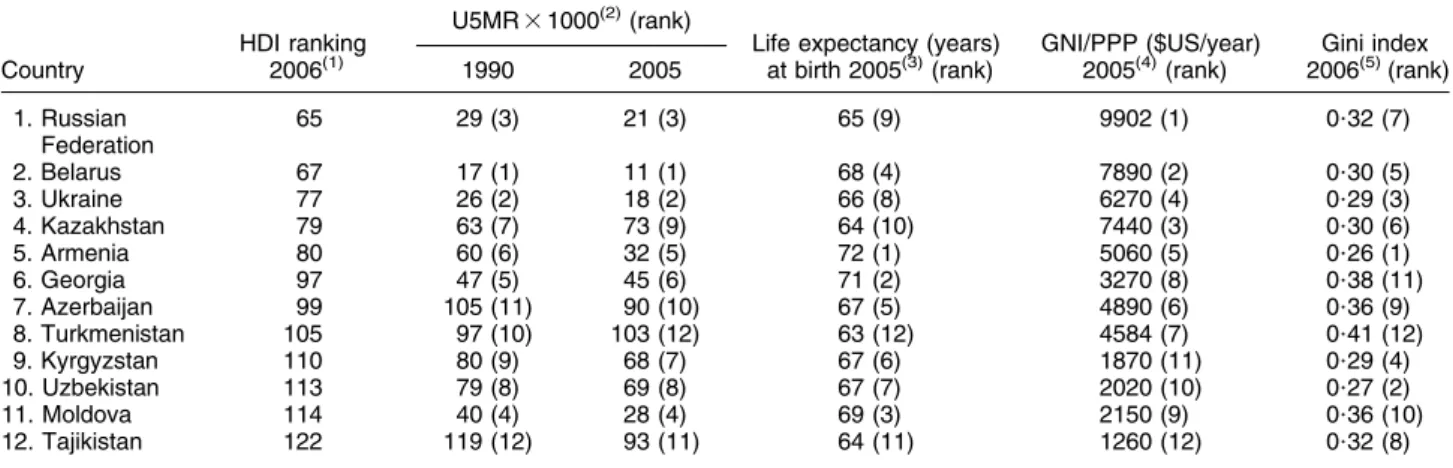
The Commonwealth of Independent States (CIS) is a group of countries that shared the same political system
for most of the 20th century (Table 1(1–5)). From 1991
these countries followed distinct paths of development and are now very different in terms of resources, econ-omy, political systems, religion, culture, social standards and health. Yet many international agencies keep placing them in the same group, e.g. for the achievement of the Millennium Development Goals (MDG). In 2005, their total population was about 278 million, with over 3?5
million births(6). For several decades, at the time of the
Soviet Union, these countries were thought to rank rela-tively well in terms of under-five mortality rate (U5MR), second only to high-income countries. This is no longer so: several countries with similar gross national income (GNI) per capita currently show lower U5MR and, most
important, are on track to achieve MDG4 by 2015, while CIS countries overall made little improvement between
1990 and 2005 and are off track(7). Improved and more
transparent statistics only partially explain this situation, which has its main roots in social and economic pro-blems. Over most of the 1990s, all CIS countries
experi-enced serious economic recession, disruption of
previously generous health and social protection systems, growing inequities, conflicts and increasing poverty. Between 1990 and 2001, the number of people living on less than $US 1 per day increased from 2?3 to 17 million, i.e. from less than 1 % to almost 6 % of the total
popula-tion(2). Cultural and geographical factors combined with
diverse and often troubled economic and political transition have led, over the past 15 years, to striking dispari-ties among and within countries in key development
indicators such as U5MR, life expectancy at birth and GNI
in purchasing power parity(1,3–5)*.
Nutrition is an important determinant of child health,
and of health and social outcomes later in life(8,9). It is
also a key mediator between socio-economic status
and health(10,11). Stunting, vitamin A deficiency (VAD), I
deficiency disorders (IDD) and Fe deficiency anaemia (IDA) have been identified as key risk factors for child
development(12). Investing in child nutrition is crucial to
improve child health and development and to alleviate poverty and inequity. An unpublished World Bank doc-umenty had already identified critical nutrition issues in CIS countries before 2000. The objectives of the present paper are to assess the current nutritional status of chil-dren ,5 years of age in these countries and to discuss possible strategies for improvementz.
Methods
Our situation analysis was limited to children ,5 years of age. We looked for data on low birth weight (LBW), infant and young child feeding, stunting, wasting, underweight, overweight, VAD, IDD and IDA in the following docu-ments and databases:
1. Reports from Demographic and Health Surveys (DHS), Multiple Indicator Cluster Surveys (MICS) and other national/local surveysy.
2. Annual reports from WHO, UNICEF, the World Bank, the United Nations Development Programme and the World Food Programme.
3. WHO global databases on child growth and nutrition, infant and young child feeding, and micronutrient defi-ciencies (http://www.who.int/nutrition/databases/en/). 4. Documents provided by the Health and Nutrition Unit
of the UNICEF Regional Office for Central and Eastern Europe and CIS countries and its partners.
5. Documents provided by UNICEF Country Offices and, through them, by Ministries of Health (MOH). A list of all documents used to extract data, and the years to which they refer, is available as an additional file. Most documents in the list are freely available online; the others can be made available upon request.
Summary tables by country and year were then com-piled. These tables allowed identification of data gaps and inconsistencies, and were used to develop a questionnaire sent to all UNICEF Country Offices. The questionnaire requested to: (i) look at the compiled tables to fill gaps and explain or sort out inconsistencies; (ii) provide additional data, if available, to complement the existing ones; and (iii) provide information on plans, programmes, projects and resources available to address child nutrition problems, such as the Baby Friendly Hospital Initiative (BFHI) or food fortification and/or supplementation programmes. Ques-tionnaires were returned by all countries but Belarus and Moldova. With these additional data, the summary tables were revised and finalized.
Minor inconsistencies were always due to mistakes in rounding and reporting, and were easily adjusted. Major inconsistencies, instead, were due to the use of different sources of data (i.e. routine v. survey data) for the same indicator; in these cases, survey results were considered of higher quality, in terms of completeness and accuracy, and were chosen for reporting in the present paper. When major inconsistencies were detected between
Table 1 Countries of the Commonwealth of Independent States ranked by Human Development Index (HDI) HDI ranking U5MR 3 1000
(2)
(rank)
Life expectancy (years) GNI/PPP ($US/year) Gini index Country 2006(1) 1990 2005 at birth 2005(3)(rank) 2005(4)(rank) 2006(5)(rank)
1. Russian Federation 65 29 (3) 21 (3) 65 (9) 9902 (1) 0?32 (7) 2. Belarus 67 17 (1) 11 (1) 68 (4) 7890 (2) 0?30 (5) 3. Ukraine 77 26 (2) 18 (2) 66 (8) 6270 (4) 0?29 (3) 4. Kazakhstan 79 63 (7) 73 (9) 64 (10) 7440 (3) 0?30 (6) 5. Armenia 80 60 (6) 32 (5) 72 (1) 5060 (5) 0?26 (1) 6. Georgia 97 47 (5) 45 (6) 71 (2) 3270 (8) 0?38 (11) 7. Azerbaijan 99 105 (11) 90 (10) 67 (5) 4890 (6) 0?36 (9) 8. Turkmenistan 105 97 (10) 103 (12) 63 (12) 4584 (7) 0?41 (12) 9. Kyrgyzstan 110 80 (9) 68 (7) 67 (6) 1870 (11) 0?29 (4) 10. Uzbekistan 113 79 (8) 69 (8) 67 (7) 2020 (10) 0?27 (2) 11. Moldova 114 40 (4) 28 (4) 69 (3) 2150 (9) 0?36 (10) 12. Tajikistan 122 119 (12) 93 (11) 64 (11) 1260 (12) 0?32 (8)
U5MR, under-five mortality rate; GNI, gross national income; PPP, purchasing power parity.
* The rank order of Table 1, based on the latest value of the Human Development Index (HDI), is used throughout the present paper. yRokx C, Galloway R & Brown L (2000) Prospects for improving the nutrition situation in Eastern Europe and Central Asia. Washington, DC: The World Bank.
zThe information used for the present paper is part of a wider situation analysis on child nutrition in countries of Central and Eastern Europe and CIS commissioned by the Regional Office of UNICEF.
y Survey methods, raw data and statistics, including confidence intervals when applicable, are available in survey reports; only summary statistics on the indicators of interest are reported in the present paper.
survey data (e.g. between the MICS 2000 and the Centers for Disease Control and Prevention (CDC)-supported 2002 surveys carried out in Ukraine), survey methods were scrutinized and the results of the survey using better methods were chosen (the CDC-supported survey in the Ukraine example). To help investigate factors associated with child nutrition, data were stratified when possible by age group and by social determinants: gender, urban/ rural residence, maternal education and wealth quintile.
Results
Low birth weight
The most accurate way to assess nutritional status at birth takes into account the distribution of birth weight and gestational age. Unfortunately, the only data available are the rates of LBW (less than 2500 g), which include term newborns, small-for-gestational-age newborns and pre-term newborns who may be well nourished. The most recently reported national rates are: Belarus and Ukraine 4 % (MICS, 2005); Georgia, Kyrgyzstan and Uzbekistan 5 % (MICS, 2005); Russian Federation (MoH, 2001), Turkmenistan (DHS, 2000), Moldova (DHS, 2005) and Kazakhstan (MICS, 2006) 6 %; Armenia 7 % (DHS, 2001); Tajikistan 10 % (MICS, 2005); Azerbaijan 11 % (MICS, 2001). When sequential data from consistent sources such as DHS or MICS are available, the trend is either stable (Georgia, Uzbekistan) or downward (Kazakhstan and Tajikistan). In none of the countries is an upward trend reported. Except for Tajikistan and Azerbaijan, most values are included in a range of rates similar to those
reported in high-income countries(6). Information on
distribution of birth weight according to social and economic variables is not available.
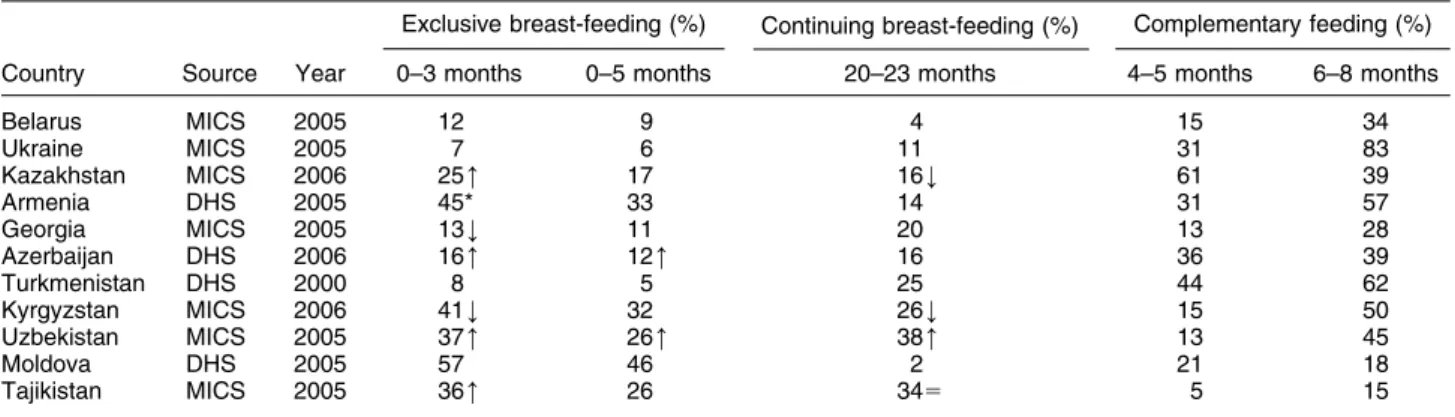
Infant and young child feeding
The initiation of breast-feeding is higher than 90 % in all countries. Table 2 shows the rates of exclusive and
continuing breast-feeding, as well as those of com-plementary feeding. When data come from similar sour-ces and age groups, an attempt is made to show whether the rates indicate an upward (m), downward (k) or stable (5) trend compared with the value immediately preced-ing the one shown in the table. The Russian Federation does not report national data gathered with definitions and methods comparable to those reported by other countries. Figure 1 shows the percentage of births in Baby Friendly Hospitals (BFH) and the proportion of BFH over all maternity hospitals. The overall rate of babies born in BFH in the region is 32 %. Four countries (Azerbaijan, Georgia, Uzbekistan and Tajikistan) have adopted the International Code of Marketing of Breastmilk Substitutes; monitoring of its compliance is a problem everywhere. In addition to the rates shown in Table 2, there is little information on complementary feeding, especially in terms of adequate quantity and quality. Early introduction of complementary foods is common. More detailed qua-litative data are available from five countries (Kazakhstan, Armenia, Turkmenistan, Kyrgyzstan and Moldova), based on DHS conducted between 1997 and 2005. In these countries, infants given complementary foods and fluids before 6 months of age usually get cow’s milk or formula, fruit and vegetables. Few get tubers, legumes and meat, fish or eggs; more are given carbohydrate-rich foods (porridge, bread, pasta, biscuits). The percentage of infants given protein-rich foods (meat, fish, eggs, dairy products) increases to 14–19 % between 6 and 9 months and goes beyond 50 %, to reach 90 % in some countries, only in the second year of life. Protein-rich foods are given more and earlier in urban than in rural areas. The available data do not provide information on inequalities concerning infant and young child feeding.
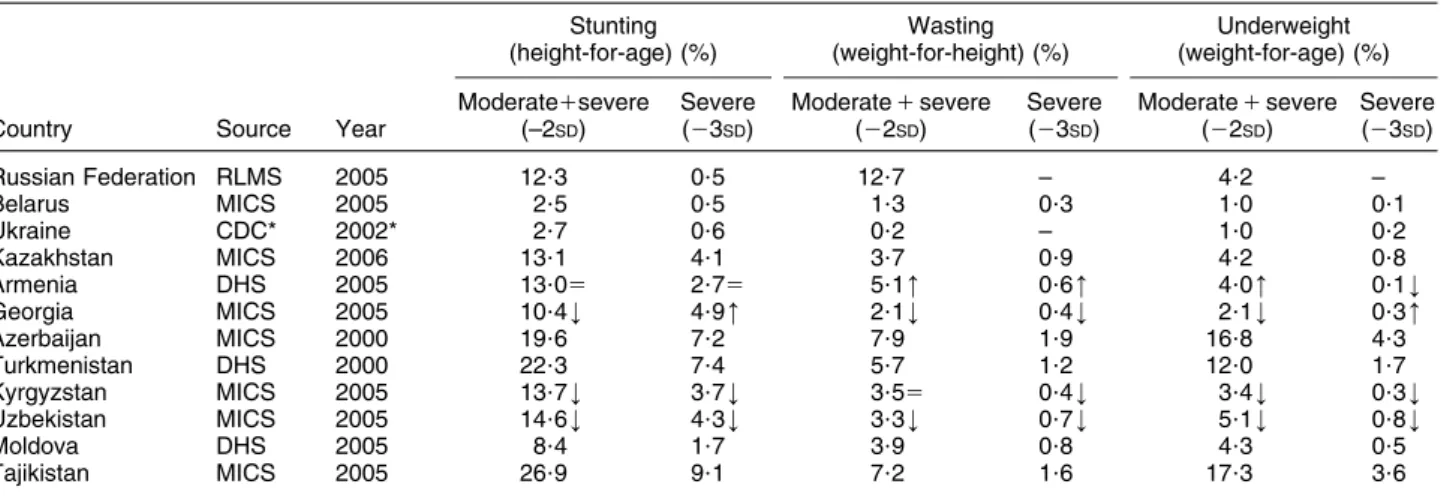
Undernutrition
Table 3 shows the latest data on stunting, wasting and underweight by country. For some countries only data at a single point in time are available, for other countries it is
Table 2 Rates of exclusive and continuing breast-feeding, and of complementary feeding, by age group, in countries of the Commonwealth of Independent States
Exclusive breast-feeding (%) Continuing breast-feeding (%) Complementary feeding (%) Country Source Year 0–3 months 0–5 months 20–23 months 4–5 months 6–8 months
Belarus MICS 2005 12 9 4 15 34 Ukraine MICS 2005 7 6 11 31 83 Kazakhstan MICS 2006 25m 17 16k 61 39 Armenia DHS 2005 45* 33 14 31 57 Georgia MICS 2005 13k 11 20 13 28 Azerbaijan DHS 2006 16m 12m 16 36 39 Turkmenistan DHS 2000 8 5 25 44 62 Kyrgyzstan MICS 2006 41k 32 26k 15 50 Uzbekistan MICS 2005 37m 26m 38m 13 45 Moldova DHS 2005 57 46 2 21 18 Tajikistan MICS 2005 36m 26 345 5 15
MICS, Multiple Indicator Cluster Survey; DHS, Demographic and Health Survey;m, upward trend; k, downward trend; 5, stable. *Source: DHS, 2000.
possible to indicate trends. In all countries, the rates of moderate plus severe stunting are consistently higher in children aged 6–35 months, usually with a peak at 12–23 months; the range in this age group goes from 3?1 % in Belarus to 36?3 % in Turkmenistan, with rates over 20 % also in Armenia, Azerbaijan and Tajikistan. The rates of underweight show the same age distribution; they are higher in older children only in Armenia, Belarus, Kyr-gyzstan and Moldova. The rates of wasting do not show a regular pattern of distribution by age. U5MR correlates strongly with the rates of moderate plus severe stunting (r 5 0?76) and underweight (r 5 0?81), but there is no correlation with the rate of wasting (r 5 0?11). When data are available, substantial differences are observed within countries. The rates of stunting are generally worse in rural than in urban areas (except for Armenia), in children of less v. more educated mothers (twice as high or more in all countries except for Belarus and Tajikistan) and in children from families belonging to the lowest wealth
quintiles (Fig. 2). The rates of stunting are higher in males, except for Uzbekistan and Azerbaijan where they are higher in females.
Overweight
The available data indicate that the problems of under-weight and overunder-weight coexist in many countries. Figure 3 shows that the rate of overweight is higher than the rate of underweight in all countries except Azerbaijan and Tajikistan, and higher than the rate of stunting in the Russian Federation, Belarus, Ukraine and Georgia. There are no data on overweight from Moldova. Information from countries with sequential data, such as Kazakhstan and Georgia, show that overweight is increasing. In all countries, the highest prevalence of overweight is at 12–23 months. Gender, place of residence, maternal education and wealth, i.e. the same factors considered for undernutrition, are also associated with differences in rates of overweight. The pattern, however, is not clear
0 10 20 30 40 50 60 70 80 90 100
Rus Bl Ukr Kaz Arm Geo Aze Tkm Kgz Uzb Mda Tjk
%
Fig. 1 Percentage of births in Baby Friendly Hospitals ( ) and the proportion of Baby Friendly Hospitals over all maternity hospitals (’) in the twelve countries (Rus, Russian Federation; Blr, Belarus; Ukr, Ukraine; Kaz, Kazakhstan; Arm, Armenia; Geo, Georgia; Aze, Azerbaijan; Tkm, Turkmenistan; Kgz, Kyrgyzstan; Uzb, Uzbekistan; Mda, Moldova; Tjk, Tajikistan) of the Commonwealth of Independent States (source: UNICEF database)
Table 3 Rates of stunting, wasting and underweight in children aged 0–59 months in countries of the Commonwealth of Independent States Stunting (height-for-age) (%) Wasting (weight-for-height) (%) Underweight (weight-for-age) (%)
Country Source Year
Moderate1severe (–2SD) Severe (23SD) Moderate 1 severe (22SD) Severe (23SD) Moderate 1 severe (22SD) Severe (23SD) Russian Federation RLMS 2005 12?3 0?5 12?7 – 4?2 – Belarus MICS 2005 2?5 0?5 1?3 0?3 1?0 0?1 Ukraine CDC* 2002* 2?7 0?6 0?2 – 1?0 0?2 Kazakhstan MICS 2006 13?1 4?1 3?7 0?9 4?2 0?8 Armenia DHS 2005 13?05 2?75 5?1m 0?6m 4?0m 0?1k Georgia MICS 2005 10?4k 4?9m 2?1k 0?4k 2?1k 0?3m Azerbaijan MICS 2000 19?6 7?2 7?9 1?9 16?8 4?3 Turkmenistan DHS 2000 22?3 7?4 5?7 1?2 12?0 1?7 Kyrgyzstan MICS 2005 13?7k 3?7k 3?55 0?4k 3?4k 0?3k Uzbekistan MICS 2005 14?6k 4?3k 3?3k 0?7k 5?1k 0?8k Moldova DHS 2005 8?4 1?7 3?9 0?8 4?3 0?5 Tajikistan MICS 2005 26?9 9?1 7?2 1?6 17?3 3?6
RLMS, Russian Longitudinal Monitoring Survey; MICS, Multiple Indicator Cluster Survey; CDC, Centers for Disease Control and Prevention survey; DHS, Demographic and Health Survey;m, upward trend; k, downward trend; 5, stable.
cut; in some countries, such as Belarus, children of poorer and less educated families in rural areas are more affec-ted, while the opposite occurs in Uzbekistan.
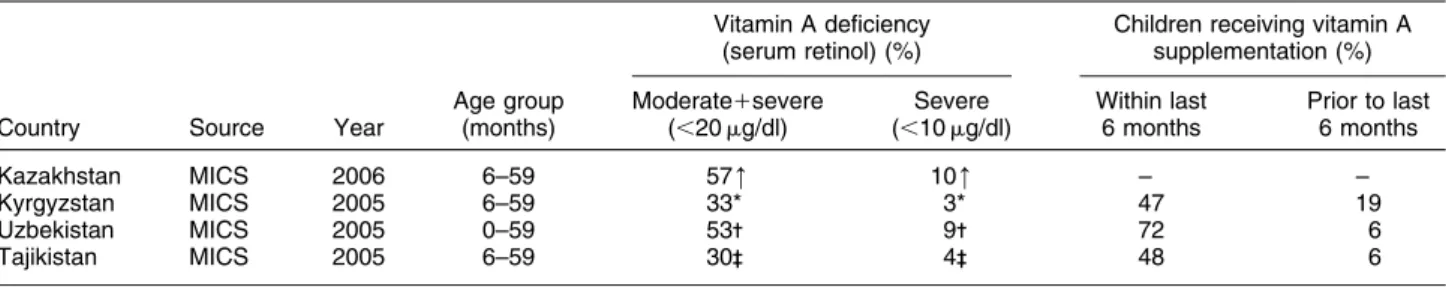
Micronutrient deficiencies
Table 4 shows information on levels of VAD and supple-mentation coverage. There is information only from four countries and there are no comparable data from other sources. Table 5 shows the levels of IDD measured in three ways (prevalence of goitre, median urinary I concentration (UIC), population with UIC below given thresholds) and the
percentage of households that use adequately iodized salt. In Ukraine and Kazakhstan the only data available refer to women 15–49 years of age, in the other countries to schoolchildren. None of the countries report median UIC below 20 m/l, but Ukraine, Azerbaijan, Kyrgyzstan, Moldova, Tajikistan and some regions in the Russian Federation fall into the less than 100 mg/l category. Among countries with data, only Ukraine, Uzbekistan and Tajikistan have more than 20 % of children with UIC less than 50 mg/l. Adequately iodized salt is available in more than 90 % of households in Kazakhstan, Armenia, Georgia and Turkmenistan. It is
0 5 10 15 20 25 30 35
Blr Kaz Arm Geo Aze Kgz Uzb Mda Tjk
%
Fig. 2 Rates of moderate plus severe stunting by wealth quintile (’, poorest quintile; , richest quintile) in some countries
(Blr, Belarus; Kaz, Kazakhstan; Arm, Armenia; Geo, Georgia; Aze, Azerbaijan; Kgz, Kyrgyzstan; Uzb, Uzbekistan; Mda, Moldova; Tjk, Tajikistan) of the Commonwealth of Independent States (source: Multiple Indicator Cluster Surveys and Demographic and Health Surveys) 0 5 10 15 20 25 30
Rus Blr Ukr Kaz Arm Geo Aze Kgz Uzb Tjk
%
Fig. 3 Rates of moderate plus severe stunting (height-for-age; ’), underweight (weight-for-age; ) and overweight
(weight-for-height; ) in some countries (Rus, Russian Federation; Blr, Belarus; Ukr, Ukraine; Kaz, Kazakhstan; Arm, Armenia; Geo,
Georgia; Aze, Azerbaijan; Kgz, Kyrgyzstan; Uzb, Uzbekistan; Tjk, Tajikistan) of the Commonwealth of Independent States (source: Multiple Indicator Cluster Surveys and Demographic and Health Surveys)
Table 4 Vitamin A deficiency and supplementation coverage in some countries of the Commonwealth of Independent States Vitamin A deficiency
(serum retinol) (%)
Children receiving vitamin A supplementation (%)
Country Source Year
Age group (months) Moderate1severe (,20 mg/dl) Severe (,10 mg/dl) Within last 6 months Prior to last 6 months Kazakhstan MICS 2006 6–59 57m 10m – – Kyrgyzstan MICS 2005 6–59 33* 3* 47 19 Uzbekistan MICS 2005 0–59 53- 9- 72 6 Tajikistan MICS 2005 6–59 30-- 4-- 48 6
MICS, Multiple Indicator Cluster Survey;m, upward trend. *In 2003.
-Survey carried out in 2002 in the most fertile region of the country. --National Ministry of Health survey carried out in 2003.
difficult to find reliable data on IDA because most countries report rates of anaemia and only a variable proportion of it is associated with Fe deficiency. Table 6 summarizes the data available; there are no data for Belarus, Georgia and Kyrgyzstan. Preventive Fe (and folic acid) supplementation is routine during pregnancy in many CIS countries, with self-reported coverage ranging between 4 % (Azerbaijan) and 90 % (Uzbekistan, in eight out of fourteen regions) among countries reporting. Some countries have Fe sup-plementation programmes for children ,5 years of age, usually between 6 and 24 months, and some report on coverage (latest values): Uzbekistan (90 %, again in eight out of fourteen regions), Turkmenistan (dropped from 90 % to nil in a few years) and Tajikistan (10 %). Where data are available, clear disparities exist between rural and urban areas and by socio-economic level (e.g. education, wealth) for all micronutrient deficiencies, showing higher rates of affected children in rural, poorer and less educated families. Also, some regions within countries are more affected than others.
Discussion
There are several limitations in the information that was available for our analysis. Heterogeneity in the sources of information is the main problem, reducing the validity of comparisons when non-standard methods are used. Even when similar standard methods are used, as with DHS and MICS, small changes of questionnaires in subsequent surveys, minor adaptations to the local situation, varia-tions in the way data collection tools are used by different survey teams, as well as inevitable random errors, call for some caution in interpreting rates and temporal trends. Some of the differences observed between and within countries, and some unexpected results, therefore may be due to lack of complete information and/or to the use of different methods. Moreover, lack of sequential informa-tion prevents a full understanding of some trends, for example on overweight and inequalities. Given these limitations, we think that the available information is sufficient to reassess key issues and to identify strategic directions for improving the nutritional status of children in CIS countries.
Key issues Low birth weight
LBW is the combined consequence of fetal growth restric-tion and preterm birth, in proporrestric-tions that available data do not allow to estimate. In addition, data collection is incomplete – WHO and UNICEF estimate that about 21 % of births were not weighed in 2000, with differences between
and within countries(13) – and may be inaccurate and
affected by mistakes at the various levels of reporting, e.g. measurement errors where newborn infants are weighed and inaccurate self-reporting by mothers. Improvements in
Table 5 Io dine deficie ncy disorde rs (IDD) and percent age of hous ehold s with acces s to iodiz ed salt by coun try, Common weal th of In depen dent Stat es I deficie ncy Populati on (%) with UIC House holds with iodiz ed salt (%) Countr y Sourc e, yea r Age group Goitre (%) Median UIC (m g/l) , 100 m g/l , 50 m g/l So urce, year . 15 ppm Russian Fede ration N ational IDD report , 2006 6– 12 years 8–30 -60–11 0 -– – UNICEF, 2004 20 Belaru s U NICEF/ MOH, 2006 6– 18 years 13 17 9 1 4 3 MOH , 2003 36 Ukrain e N ational surv ey, 20 02 Wom en 15–49 years – 9 0 5 6 2 6 MICS, 2005 18 Kazakh stan N ational surv ey, 20 06 Wom en 15–49 years – 2 3 6 16 6 MICS, 2005 92 Armenia MOH , 2005 8– 10 years – 3 1 3 6 2 UNICEF/ MOH , 2005 97 Georgi a U NICEF, 2005 6– 12 years 32 32 1 5 1 UNICEF, 2005 91 Azerb aijan* Sur vey, 2004 8– 14 years 46 54 25–39 -– DHS, 20 06 54 Turkmen istan MOH , 2004 8– 10 years 2 1 7 0 18 5 MOH , 2004 100 Kyrgyz stan* Sur vey, 2006 6– 8 year s – 99 51 11 MICS, 2005 76 Uzbekist an Sur vey, 2005 6– 12 years – 1 4 1 40 21 MICS, 2005 53 Moldov a MOH , 1996– 98 6– 12 years 27–41 -78 – – DHS, 20 05 60 Tajikistan MSS , 2 0 0 3 6 – 5 9 months – 7 3 54–74 -33 –43 -MOH , 2006 58 UIC, urinary I concentration; MOH, Ministry of Health; MSS, Micronutrient Status Survey; MICS, Multiple Indicator C luster Survey; DHS, Demographi c a nd Health Survey. *Data from some provinces. -Regional differences.
data collection may lead to higher rates; this would be expected in countries where anaemia is highly prevalent in pregnancy. That said, current LBW rates do not seem to represent a priority problem with a few exceptions (i.e. Azerbaijan and Tajikistan). There might be, however, areas and/or social and minority groups within countries with rates of LBW above the national average and this is certainly worth investigating.
Infant and young child feeding
Data on breast-feeding suffer from many problems in terms of definitions and methods. The WHO
defini-tions(14)are not used consistently in all countries; they are
not used at all in the Russian Federation, where reliable national data are not available. Many other countries report incomplete data. Available data, however, allow to conclude that breast-feeding intention and initiation are not a problem, while exclusivity in the first 6 months and continuation up to 2 years and beyond, as recommended
by UNICEF and WHO(15), are. The percentage of births in
BFH and the proportion of BFH over all maternity hos-pitals are higher than those reported by many
high-income countries(16). Of the twelve CIS countries, three
(25 %) have 60 % or more of health facilities designated as BFH and 60 % or more of births in BFH, compared with three (8 %) and two (5 %), respectively, among thirty-eight high-income countries. None of the CIS countries has less than 10 % of births in BFH compared with twenty (53 %) out of thirty-eight high-income countries. These encouraging data on implementation of the BFHI may explain the achievements in terms of initiation of breast-feeding; other strategies, including better support at
community and primary health-care levels(17), are needed
to improve exclusivity of breast-feeding for 6 months and continuation afterwards. Adoption and enforcement of the International Code, as well as strengthened monitor-ing of its implementation to regulate the marketmonitor-ing of infant food, is also needed. The pattern of rapidly wor-sening growth in the 6–35 months age group confirms that complementary feeding is a main area of concern, despite the poor information available. Early introduction
of complementary food is a problem, as shown by the low rates of exclusive breast-feeding at 0–5 months. Food may also be inadequate, with a late and scarce use of protein- and micronutrient-rich diets. Finally, available data do not provide information on inequalities; however,
in CIS countries, as in the rest of Europe(18), better
maternal education and occupation, as well as family income and social class, are probably associated with better breast-feeding practices, and this is probably applicable to complementary feeding as well.
Undernutrition
Since most data derive from standard surveys, they can be used to identify countries in which undernutrition, parti-cularly stunting and underweight, still represents a public health problem. Based on a simple categorization of
stunting levels proposed by WHO(19), only Tajikistan and
Turkmenistan would be classified as countries with medium (20–29 %) prevalence; all the other countries would fall into the low (,20 %) prevalence category. The situation in the Russian Federation and Moldova may deserve further study to investigate why their levels of undernutrition are higher than expected based on socio-economic indicators. The rates of stunting and under-weight are comparable with those of high-income coun-tries only for Belarus, which is also, not surprisingly, the country with the lowest U5MR. Finally, when temporal trends are available, the rates of stunting, wasting and underweight appear to be decreasing in most CIS coun-tries. In many countries, however, the rates of stunting and underweight at sub-national level may be much higher than the national average. This is also true for children in the age group 6–35 months, which show the highest rates of stunting and underweight compared with the other age groups, a likely sign of inadequate infant and young child feeding.
Overweight
The available data, despite their scarcity, allow to draw a clear conclusion about overweight: in most CIS countries, overweight is an important and increasing problem and a
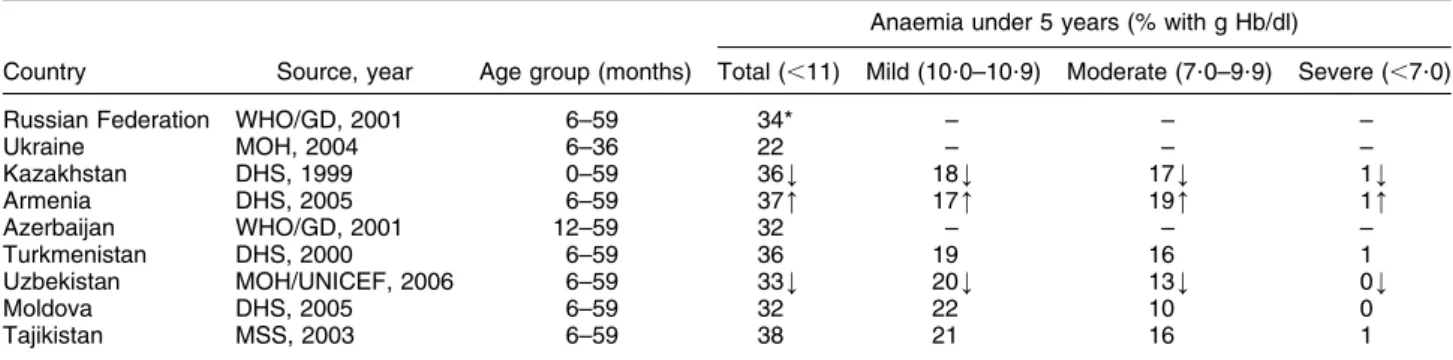
Table 6 Rates of anaemia in children in some countries of the Commonwealth of Independent States
Anaemia under 5 years (% with g Hb/dl)
Country Source, year Age group (months) Total (,11) Mild (10?0–10?9) Moderate (7?0–9?9) Severe (,7?0)
Russian Federation WHO/GD, 2001 6–59 34* – – –
Ukraine MOH, 2004 6–36 22 – – – Kazakhstan DHS, 1999 0–59 36k 18k 17k 1k Armenia DHS, 2005 6–59 37m 17m 19m 1m Azerbaijan WHO/GD, 2001 12–59 32 – – – Turkmenistan DHS, 2000 6–59 36 19 16 1 Uzbekistan MOH/UNICEF, 2006 6–59 33k 20k 13k 0k Moldova DHS, 2005 6–59 32 22 10 0 Tajikistan MSS, 2003 6–59 38 21 16 1
WHO/GD, WHO global databases; MOH, Ministry of Health; DHS, Demographic and Health Survey; MSS, Micronutrient Status Survey;m, upward trend; k, downward trend.
public health priority, and many countries face the dou-ble burden of under- and overnutrition. The fact that in these countries overweight and obesity in older children and adults is a public health problem had already been
established years ago(20,21). If it is a problem in older
children and adults, it is very likely to start earlier in
childhood, as experienced in industrialized countries(22).
Using the same categorization for overweight that WHO uses for wasting, i.e. measured in terms of categories of weight-for-height, Belarus, Kyrgyzstan and Uzbekistan would be classified as low (5–9 %), Kazakhstan and Armenia as medium (10–14 %) and Ukraine, the Russian Federation and Georgia as high (15 % or more) pre-valence countries; Azerbaijan and Tajikistan would have the rate of overweight expected within the normal dis-tribution. Weight-for-height, however, is not a very good indicator of overweight; the BMI would be preferable for surveillance, other measures being more appropriate for
research and clinical medicine(23–25). In interpreting the
available data one should also keep in mind that use of the recently launched WHO growth standards may push up the current estimates of the rates of overweight and
obesity in children(26).
Micronutrient deficiencies
VAD is considered a public health problem when 15 % or more of children have serum retinol levels less than
20 mg/dl(27)or when the U5MR exceeds 70 per 1000(28,29).
Based on these criteria VAD is a priority in all countries with data (Table 4), but also in Azerbaijan, which has had a nationwide vitamin A supplementation programme since 2005, and Turkmenistan. VAD may be a public health problem also in parts of the other countries. Kyr-gyzstan, Uzbekistan and Tajikistan are the countries with better developed national programmes, based on vitamin A supplementation coverage. Other countries may need to improve their programmes, as well as their data col-lection and reporting systems. A country has achieved sustainable elimination of I deficiency if more than 90 % of salt samples in households are adequately iodized (.15 ppm), if the median UIC is greater than or equal to 100 mg/l, with more than 50 % of children with values above 100 mg/l and no more than 20 % of children with values below 50 mg/l, and if at least eight of ten
pro-grammatic criteria are met(30). Based on these criteria,
Kazakhstan, Armenia, Georgia and Turkmenistan have reached the goal. In all other countries except the Russian Federation and Ukraine, the commitment exists and the goal is attainable in a few years. Of the 3?5 million chil-dren born every year in CIS countries, only about 40 % are protected from the consequences of I deficiency. Of the 2?1 million unprotected, 58 % are born in the Russian Federation. Anaemia (Hb , 11 g/dl) is considered a severe public health problem where its prevalence is 40 % or more; it is considered as moderate between 20 % and
39 %, and as mild between 5 % and 19 %(31). Based on
these criteria, all CIS countries would fall into the mod-erate public health problem category. However, some regions or some population subgroups (e.g. children aged 6–23 months in whom the rates of anaemia are often higher than 40 %) may have a severe problem. As malaria and other parasitic diseases are absent in most countries, almost all anaemia is probably IDA.
Strategic directions
Particularly when compared with countries within the same range of per capita income, CIS countries perform poorly in key health indicators such as U5MR and life
expectancy(6). The reasons for this are complex, as shown
by the low ranking in HDI(1), but there is little doubt that
sustained investments in child nutrition would yield important returns in terms of child survival, health and development, and would contribute to better health later
in life(8). This is particularly true for some countries of the
Caucasus and Central Asia, where nutrition indicators are worse than in the remaining countries. The results pre-sented and discussed above clearly indicate that public health nutrition strategies, currently focusing on the promotion of breast-feeding and the control of micro-nutrient deficiencies, need to be at least in part redirected to address: (i) the overall protection, promotion and support of infant and young child feeding; (ii) the prevention of overweight and obesity; and (iii) malnutrition as a whole, as opposed to stunting, underweight and micronutrient defi-ciencies alone. We envisage three main strategic directions for future investments in child nutrition.
1. Addressing undernutrition
This implies intensified and sustained action to remove or mitigate the root causes of stunting and underweight with a combination of social and economic interventions on distal factors, such as agricultural development, food production, trade and prices, combined with information, education and communication aimed at improving feed-ing practices. The protection, promotion and support of breast-feeding remain prominent as priority interventions, but should be associated with interventions to protect, promote and support timely, adequate and safe
com-plementary feeding(32). Both breast-feeding and
com-plementary feeding need strong legal protection from the marketing of breast milk substitutes and energy-dense foods and beverages. The above-mentioned strategies will probably be a priority in all CIS countries. Current programmes for the control of VAD, IDD and IDA should be maintained and extended where needed, since there is little doubt that their permanence as public health pro-blems will keep affecting the development of many children for years to come. A multi-pronged strategy combining fortification, supplementation and improve-ment of feeding practices is required to effectively reach the target population groups. In addition to scaling up vitamin A and Fe supplementation, flour fortification and
salt iodization, fortification of complementary foods and staple foods used for complementary feeding with mul-tiple micronutrients, and home-based fortification such as multiple-micronutrient powders, are measures to reduce the burden of micronutrient deficiencies and to ensure an adequate I and folic acid status for women when they get pregnant. The control of IDA includes in addition better
birthing practices and delayed cord clamping(33,34), as
well as protection, promotion and support of exclusive breast-feeding up to 6 months with diversification of complementary feeding to include Fe-rich foods
after-wards(35,36). Daily or bi-weekly Fe supplementation is
effective and safe(37), but it is more difficult to implement
at high coverage and is unlikely to reach the children who most need it. However, where possible and sustainable, it can be taken into consideration as a complementary measure.
2. Addressing overweight
As with undernutrition, preventive strategies will have to include a complex mix of social, economic, health and nutrition interventions to be delivered over a long time and reaching those affected by overweight as a
con-sequence of both poverty and affluence(8,38,39). Much can
be gained with a boost of programmes for the protection, promotion and support of breast-feeding, leading to increased exclusivity in the first 6 months and duration
into the second year of life and beyond(40,41). The
pre-vention of overweight and obesity depends also on timely and adequate complementary feeding; where overweight is a problem, breast-feeding is not exclusive to start with and is stopped early, while complementary feeding is usually too early and unbalanced in favour of sugar- and fat-dense foods. Moreover, prevention is based on a healthy
family diet and on adequate levels of physical activity(39).
These healthy behaviours depend on social factors that have to be adequately addressed in all countries. The development and implementation of intersectoral policies and action plans based on the recommendations agreed upon during the Interministerial WHO/EURO Conference held in Istanbul in late 2006, including legislation to protect children from marketing of energy-dense foods and bev-erages and programmes to promote physical activity,
represent the way forward(39,42).
3. Addressing inequities and targeting specific population groups
Although no socio-economic group is totally exempt, malnutrition is not equally distributed. There are inequalities in all countries so that even where under-nutrition, overweight, breast-feeding or micronutrient deficiencies may not be considered as public health priorities country-wide, they may be so for specific population groups or minorities. Our data show that undernutrition and micronutrient deficiencies, as well as overweight, affect in particular children between 6 and
35 months of age and, not surprisingly, increase with poverty. Strategies aimed at improving nutrition should therefore aim at reducing inequalities by addressing the social and economic determinants of food availability, distribution, purchase and use, especially in countries and population groups with high rates of stunting and underweight. The role of maternal education is of parti-cular importance: enrolment and retention of girls in secondary and higher schools should be maintained at high level, such as in Kazakhstan (87 %), or raised where lower, such as in Georgia (67 %), since higher maternal education is associated with better rates of LBW, breast-feeding, adequate complementary breast-feeding, underweight and overweight. Maintaining a high level of social pro-tection for women in the workforce, and extending the protection to those who may not be covered by current legislation, is another important determinant of good infant and child health and nutrition. Identifying and targeting groups at special risk, such as single, adolescent and smoking mothers, or women belonging to minorities, may also help improve the nutritional status of infants and children and reduce inequalities. Population groups at risk of wasting and severe malnutrition should be iden-tified while preventive and remedial measures are plan-ned and implemented. This equity lens should be used in both programme implementation and in monitoring and
evaluation of results(43).
The diversity of the situation across and within the twelve CIS countries means that variable emphasis will be given to each strategic direction to fit specific needs. A common feature, however, is the emphasis needed on cross-cutting issues. The first one, and an underlying pillar of development in child nutrition, is capacity building; only a scientific community that develops a national strategy based on evidence and that informs all the actors about their role, including training on new tasks, will have high chances of achieving better child nutrition. Second is cross-sectoral action in central and local governments, involving all government sectors as well as international and bilateral agencies and non-governmental organizations; nutrition policies and plans should define the role of different sectors and need to be translated into concrete work plans. Third, all nutrition policies and plans should be complemented by reliable standard systems for data collection. In CIS countries this seems to be a problem especially for birth weight, breast-feeding, complementary breast-feeding, IDA and overweight. Standard and improved data collection systems for monitoring and evaluation of programmes should look also at the effect on inequalities. Agreed equity stratifiers, such as family income and parental education, as well as gender, minority group and detailed geographical data, should be consistently used. Data collection systems should integrate information on policies, plans and interventions, as well as social and economic context, to
facilitate interpretation of changes in health and nutrition indicators. Fourth, such a complex set of policies, plans and programmes needs improvement of the legal fra-mework to address key issues such as the adoption of legislation to protect breast milk and healthy foods for infants and young children, the adoption and enforce-ment of adequate food standards, and measures to improve the social protection of working mothers. Action should also be taken on the demand side to empower families in making the right choice through a strength-ening of independent information channels and of the counselling capacity of health-care providers. Finally and most important, attention needs to be drawn on action at community level. Nutrition is strongly influenced by current beliefs, access to information, health providers’ practice and service delivery strategies, all requiring sustained action at local level by health professionals, the media and grass-roots organizations. Awareness must be built in commu-nities, and their health and administrative authorities, on the importance of adequate nutrition since birth, as a
crucial component of early childhood development(44). To
succeed and be cost-efficient, national programmes and action plans need a solid counterpart at community level. As recommended for the protection, promotion and
support of breast-feeding(45), mother-to-mother support
groups and similar community initiatives will contribute to make policies and strategies more effective.
Acknowledgements
A.C. and G.T. coordinated the collection and analysis of data and had primary responsibility in writing the paper. A.T. and S.K. provided the data directly and/or through UNICEF Country Offices, and participated in interpreta-tion of results. T.B. and J.B. compiled all of the data, including those gathered through questionnaires, and participated in their analysis and interpretation. All authors worked on subsequent drafts of the paper and approved the final version of the manuscript. The work was funded by the UNICEF Regional Office for Central and Eastern Europe and Commonwealth of Independent States and all the authors declare that they have no conflict of interest. The submission represents original work that has not been published previously, that is not currently being considered by another journal, and that being accepted for Public Health Nutrition will not be published elsewhere in the same form, in English or in any other language, without the written consent of the Nutrition Society. It is confirmed that each author has seen and approved the contents of the submitted manuscript.
References
1. United Nations Development Programme (2006) Human
Development Report 2006. Beyond Scarcity: Power, Poverty and The Global Water Crisis. New York: UNDP.
2. United Nations Millennium Project (2005) Investing in
Development: A Practical Plan to Achieve the Millennium Development Goals. New York: Earthscan.
3. UNICEF (2006) The State of the World’s Children 2006.
Excluded and Invisible. New York: UNICEF.
4. The World Bank (2007) World Development Report 2007.
Development and The Next Generation. Washington, DC: World Bank.
5. The World Bank (2006) World Development Report 2006.
Equity and Development. Washington, DC: World Bank.
6. UNICEF (2007) The State of the World’s Children 2007.
Women and Children: The Double Dividend of Gender Equality. New York: UNICEF.
7. World Health Organization (2005) Health and the
Millen-nium Development Goals. Geneva: WHO.
8. The World Bank (2006) Repositioning Nutrition as Central
to Development: A Strategy for Large-Scale Action.
Washington, DC: World Bank.
9. Ezzati M, Lopez AD, Rodgers A, Vander Horn S & Murray
CJ; Comparative Risk Assessment Collaborating Group (2002) Selected major risk factors and global and regional burden of disease. Lancet 360, 1347–1360.
10. Norgan NG (2000) Long-term physiological and economic
consequences of growth retardation in children and adolescents. Proc Nutr Soc 59, 245–256.
11. Must A & Strauss RS (1999) Risks and consequences of
childhood and adolescent obesity. Int J Obes Relat Metab Disord 23, Suppl. 2, S2–S11.
12. Walker SP, Wachs TD, Gardner JM, Lozoff B, Wasserman
GA, Pollitt E & Carter JA; International Child Development Steering Group (2007) Child development: risk factors for adverse outcomes in developing countries. Lancet 369, 145–157.
13. World Health Organization/UNICEF (2004) Low Birthweight:
Country, Regional and Global Estimates. New York: UNICEF.
14. World Health Organization (1991) Indicators for Assessing
Breastfeeding Practices. Geneva: WHO; available at http:// www.who.int/child-adolescent-health/New_Publications/ NUTRITION/WHO_CDD_SER_91.14.PDF
15. World Health Organization (2002) Global Strategy for Infant and Young Child Feeding. Geneva: WHO; available at http:// www.who.int/child-adolescent-health/New_Publications/ NUTRITION/gs_iycf.pdf
16. Cattaneo A, Yngve A, Koletzko B & Guzman LR (2005)
Protection, promotion and support of breast-feeding in Europe: current situation. Public Health Nutr 8, 39–46.
17. Coutinho SB, de Lira PI, de Carvalho LM & Ashworth A
(2005) Comparison of the effect of two systems for the
promotion of exclusive breastfeeding. Lancet 366,
1094–1100.
18. Yngve A & Sjostrom M (2001) Breastfeeding determinants and a suggested framework for action in Europe. Public Health Nutr 4, 729–739.
19. World Health Organization (1995) Physical Status: The Use
and Interpretation of Anthropometry. Geneva: WHO.
20. James PT, Leach R, Kalamara E & Shayeghi M (2001) The
worldwide obesity epidemic. Obes Res 9, Suppl. 4, 228S–233S.
21. Martorell R, Kettel KL, Hughes ML & Grummer-Strawn LM
(2000) Overweight and obesity in preschool children from developing countries. Int J Obes Relat Metab Disord 24, 959–967.
22. Lobstein T & Frelut ML (2003) Prevalence of overweight among children in Europe. Obes Rev 4, 195–200.
23. Cole TJ, Donnet ML & Stanfield JP (1981) Weight-for-height indices to assess nutritional status – a new index on a slide-rule. Am J Clin Nutr 34, 1935–1943.
24. Cole TJ, Bellizzi MC, Flegal KM & Dietz WH (2000)
Establishing a standard definition for child overweight and obesity worldwide: international survey. BMJ 320, 1240–1243.
25. Lobstein T, Baur L & Uauy R (2004) Obesity in children and young people: a crisis in public health. Obes Rev 5, Suppl. 1, 4–104.
26. World Health Organization (2006) Child Growth Standards.
Length/Height-for-Age, Weight-for-Age, Weight-for-Length, Weight-for-Height and Body Mass Index-for-Age: Methods and Development. Geneva: WHO.
27. Sommer A & Davidson FR (2002) Assessment and control
of vitamin A deficiency: the Annecy Accords. J Nutr 132, 9 Suppl., 2845S–2850S.
28. Schultink W (2002) Use of under-five mortality rate as an
indicator for vitamin A deficiency in a population. J Nutr 132, 9 Suppl., 2881S–2883S.
29. UNICEF Nutrition Section (2006) Vitamin A
Supplementa-tion: Progress for Child Survival. New York: UNICEF. 30. International Council for the Control of Iodine Deficiency
Disorders/UNICEF/World Health Organization (2001)
Assessment of Iodine Deficiency Disorders and Monitoring Their Elimination: A Guide for Programme Managers. Geneva: WHO.
31. World Health Organization (2001) Iron Deficiency Anemia
Assessment, Prevention and Control: A Guide for Pro-gramme Managers. Geneva: WHO.
32. Dewey KG (1998) Cross-cultural patterns of growth and nutri-tional status of breast-fed infants. Am J Clin Nutr 67, 10–17.
33. Chaparro CM, Neufeld LM, Tena Alvez G, Eguia-Liz
Cedillo R & Dewey KG (2006) Effect of timing of umbilical cord clamping on iron status in Mexican infants: a randomised controlled trial. Lancet 367, 1997–2004.
34. van Rheenen P & Brabin BJ (2004) Late umbilical
cord-clamping as an intervention for reducing iron deficiency anaemia in term infants in developing and industrialised countries: a systematic review. Ann Trop Paediatr 24, 3–16.
35. Griffin IJ & Abrams SA (2001) Iron and breastfeeding.
Pediatr Clin North Am 48, 401–413.
36. Ramakrishnan U & Yip R (2002) Experiences and
challenges in industrialized countries: control of iron deficiency in industrialized countries. J Nutr 132, 4 Suppl., 820S–824S.
37. Gera T & Sachdev HP (2002) Effect of iron supplementa-tion on incidence of infectious illness in children: systematic review. BMJ 325, 1142.
38. Monteiro CA, Moura EC, Conde WL & Popkin BM (2004)
Socioeconomic status and obesity in adult populations of developing countries: a review. Bull World Health Organ 82, 940–946.
39. World Health Organization (2007) The Challenge of Obesity
in the WHO European Region and the Strategies for Response. Summary. Copenhagen: WHO Regional Office for Europe; available at http://www.euro.who.int/document/ e89858.pdf
40. Harder T, Bergmann R, Kallischnigg G & Plagemann A
(2005) Duration of breastfeeding and risk of overweight: a meta-analysis. Am J Epidemiol 162, 397–403.
41. Horta BL, Bahl R, Martines J & Victora C (2007) Evidence on the Long-term Effects of Breastfeeding: Systematic Reviews and Meta-analyses. Geneva: WHO.
42. World Health Organization (2006) European Charter on
Counteracting Obesity. WHO European Ministerial
Conference on Counteracting Obesity, Istanbul, Turkey, 15–17 November 2006. Copenhagen: WHO Regional Office for Europe; available at http://www.euro.who.int/ Document/E89567.pdf
43. Victora CG, Wagstaff A, Schellenberg JA, Gwatkin D,
Claeson M & Habicht JP (2003) Applying an equity lens to child health and mortality: more of the same is not enough. Lancet 362, 233–241.
44. Engle PL, Black MM, Behrman JR, Cabral de Mello M, Gertler PJ, Kapiriri L, Martorell R & Young ME; International Child Development Steering Group (2007) Strategies to avoid the loss of developmental potential in more than 200 million children in the developing world. Lancet 369, 229–242.
45. EU Project on Promotion of Breastfeeding in Europe (2004)
Protection, Promotion and Support of Breastfeeding in Europe: A Blueprint for Action. Luxembourg: European Commission, Directorate Public Health and Risk Assessment; available at http://europa.eu.int/comm/health/ph_projects/ 2002/promotion/fp_promotion_2002_frep_18_en.pdf