Thermic effect of glucose a nd thermal
body
insulation in lean an d obesesubjects: a calorimetric approach
By E. JEQUIER,
PH.
PITTET
and P.-H. GYGAX, Division of ClinicalPhysiology
andInstitute of Physiology, I O I I Lausanne, SwitzerLand
The fact that many obese subjects have a tendency to gain weight with no real excess of food intake is generally accounted for by a low physical activity (Bullen,
Reed
& Mayer, 1964). Although a few authors have claimed that the efficiency ofenergy utilization could be greater in obese than in lean subjects (Galton & Bray,
1967)’ there is no clear evidence to support this concept.
In a period of weight gain, the positive energy balance in the obese can be
explained by a relative excess of energy intake in relation to a decreased energy expenditure. The latter may be due partly to lack of muscular exercise, but other factors may contribute to save energy in the obese such as impairment of glucose oxidation with a low thermic effect (specific dynamic action) or decreased heat losses during cold exposure resulting from an elevated body thermal insulation.
Since this symposium is concerned with ‘Applications of human and animal calorimetry’, I will briefly describe the methods of direct and indirect human calorimetry used in Lausanne.
Direct ca lorimetry
We have built a direct calorimeter of low thermal inertia and rapid response time, large enough to accommodate patients (Spinnler, Jkquier, Favre, Dolivo &
Vannotti, 1973). Our instrument is a heat-flow calorimeter in which the rate of
heat loss by a subject is measured by a gradient layer. The heat flow through a layer is given by Fourrier’s law:
where is the heat flow through the layer, A is the area of the layer, h is the specific thermal conductivity of the layer, D is the thickness of the layer, and
T,
andT2
are the temperature of inner and outer surfaces, respectively.The calorimeter is a small chamber with a volume of I . 56 m3. The inner surface
is completely covered with a gradient layer. The gradient layer consists of an epoxy resin 2.4 mm thick with a copper circuit printed on both sides. The electrical resistance of each circuit is dependent on its temperature. The measurement of the heat flowing through the layer is performed by accurate measurements of the difference in temperature between the two surfaces of the layer. The copper
PROCEEDINGS
circuits of the inner and outer surfaces of the gradient layer are connected in a Wheatstone bridge. The voltage measured is proportional to the sensible heat flowing through the layer (Q). The measurement of detectable heat (radiative plus convective) using a gradient layer requires a constant temperature of the outer surface of the layer. The walls of the chamber are maintained at a constant temperature, within 0.005' of the set temperature, by circulating water through
channels in the walls of the chamber.
Evaporative heat losses of the subject are measured through a ventilatory circuit. Outside air is forced through the ventilatory circuit at a flow rate of 1 1 5 0 l/min. The air is first cooled to a low temperature, TI, and completely saturated with water. Before reaching the chamber, it is passed through a heater where it is warmed to the chamber temperature, T,. The water vapour lost by the subject increases the water content of the air. Outgoing air from the chamber passes through a heat exchanger (condenser) maintained at the low temperature, T , . The water vapour lost by the subject condenses out and gives up its latent heat which is measured by a gradient layer: this corresponds to the evaporative heat losses of the subject. Respiratory heat losses can be measured separately through a respiratory circuit.
Indirect calmimet y
The oxygen consumption ( PO2) of the subject is measured by an opencircuit system. A transparent plastic, ventilated hood is lowered over the subject's head and secured around his neck with an airtight tissue. A slight negative pressure is maintained in the hood to prevent expired air from leaking out. The air flow at the outlet of the hood is measured using a pneumotachograph and samples of the out- flowing air are continuously passed through a paramagnetic oxygen analyser and an infra-red carbon dioxide analyser. The non-protein respiratory quotient is determined by subtracting the oxygen consumed and carbon dioxide produced by protein utilization assessed from urinary nitrogen excretion. The tables of Lusk
(1924) were used to obtain the amount of carbohydrate and lipid oxidized.
Thermometry
Internal temperature is measured using a tympanic thermocouple. Mean skin
temperature is calculated by weighting eight individual skin temperatures according to the method of Hardy & Du Bois (1937).
Utilization rate and thermic effect of glucose in lean and obese subjects Two groups of female subjects who were familiar with the equipment were studied in the direct calorimeter (Pittet, Chappuis, Acheson, de Techtermann 8z Jkquier, 1976). Group I consisted of ten control subjects, aged 24.2+ 1 - 7 years with a mean body-weight of 56.6k1.9 kg (102+2.070 of ideal weight). Group 2 consisted of eleven obese subjects, with a mean weight of 83-7+4-4 kg
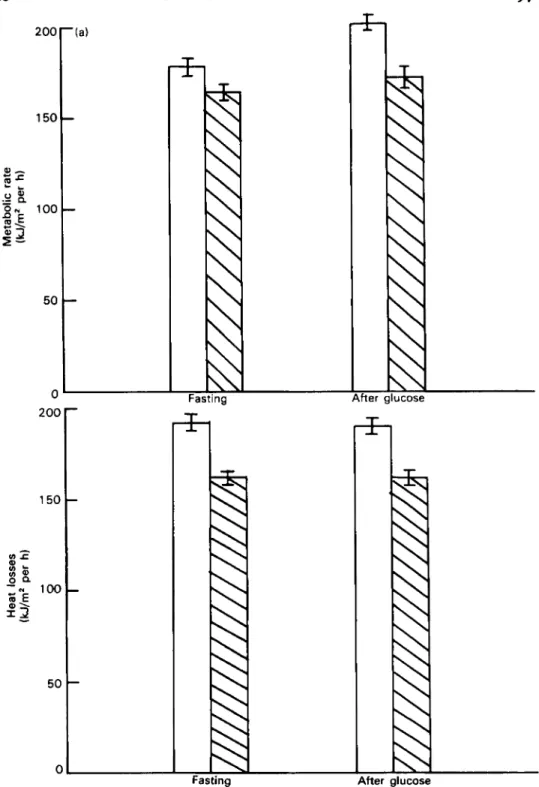
The subjects were introduced into the calorimeter at 28O and 30% relative humidity. After a 4o-min period of measurements in the fasting state, an oral dose of 50 g glucose was given and measurements including direct and indirect calorimetry were done during 150 min. Control experiments were done in three control subjects to study the effect of an energy-free meal, 150 ml water+lemon juice. The results are given in Fig. I.
At 28O, a temperature considered to be near the thermal neutral environment, in
the fasting state heat losses expressed in kJ/m2 per h were significantly higher in the control subjects (192+5.3) than in the obese (162.6k3.9). Metabolic rate was
also more elevated in controls (177.8+8 kJ/m2 per h) than in the obese (164. xk4-8) but the difference was not significant.
Simultaneous measurements of metabolic rate (M) and heat losses (H) allow us
to calculate the heat storage (S); for a resting subject,
S=M-H.
Hence, at 28O, control subjects were in negative thermal balance (S = -14.2+5.0 kJ/mZ per h) whereas the obese were in thermal equilibrium(S
= I . 5+-4-8 kJ/m2 per h).After the ingestion of glucose, metabolic rate measured over the ~ p m i n period increased in both groups, by 13.0% in the control and 5.2% in the obese. Calculated in terms of specific dynamic action the increase in metabolic rate was 12.070 and 5.2%, respectively, of the energy content of the load. Heat losses did not change significantly during the 150 min after glucose in either group. Thermal balance became positive in both groups, 10.9k5.6 and 10.8i-4.8 kJ/m2 per h in controls and obese, respectively.
The oxidation rate of the different substrates was calculated. In the fasting state, control subjects oxidized mainly carbohydrate (90.4 mg/min) and less lipid (68.8 mg/min), whereas the main energy substrate utilized by the obese was lipid (103.7 mg/min) and less carbohydrate (50.2 mg/min). After the glucose load, carbohydrate oxidation rate increased in both groups to reach 159 mg/min in controls and 95.6 mg/min in the obese. Lipid oxidation decreased slightly and protein metabolism remained unchanged. The energy-free meal (water+lemon juice) induced no significant change in metabolic rate or heat losses.
The main finding of this study is a lower thermic effect of glucose in obese than in control subjects. The obese had a lower oxidation rate of carbohydrate than controls in both the fasting and postprandial states.
This
can be explained by the inhibition of carbohydrate oxidation in the presence of elevated plasma free fatty acids (FFA) as described by Gomez, Jkquier, Chabot, Buber & Felber (1972); the entry of FFA into muscle cells is stimulated and their utilization depends mainly on their concentration. In addition, Randle, Hales, Garland & Newsholme (1963) showed that increased fatty acid oxidation leads to inhibition of key enzymes in the glycolytic pathway which decreases the rate of glucose oxidation.The fact that the obese were in thermal equilibrium at 28O whereas the controls were in negative thermal balance may be related to the differences in thermic effects observed. The increase in metabolic rate after glucose ingestion in the controls may play a thermoregulatory role, whereas there was no need for an extra heat production in the obese subjects.
I978
rfter glucose
Fig. I. (a) Metabolic rate (kJ/m’ per h) during a 40-min control period (fasting) and during 150
min after an oral dose of 50 g glucose for a group of ten female control subjects 0 and for a group of
eleven female obese subjects N. The increase in metabolic rate after the glucose load was statistically significant in the group of control subjects (P<o.ooI). (b) Heat losses (kJ/m* per h) for
Thermal body insulation
It is well established that in thermally comfortable environments, thermal body insulation does not play a role in the regulation of human energy expenditure. However, during cold exposure, the amount of heat lost influences the cooling rate of the body and can elicit metabolic responses. Under these conditions, the degree of thermal body insulation is an important factor; a large insulation can contribute to saving and may lead to an economy of fuels consumed by the body.
Thermal
body
insulation(1,)
is obtained by the equation:where Tin, is internal (or core) temperature,
Tsk is mean skin temperature,
Ab is
body surface andask
is total heat losses through the skin. Thermal body insulation depends on the composition and the thickness of subcutaneous tissues as well as on their blood flow (Jequier, Gyax, Pittet & Vannotti, 1974). The study of thermal body insulation in subjects of widely different body-weight may give some insight into the mechanism of the low energy expenditure observed in obese subjects exposed to cold, or in anorexic patients in a neutral thermal environment.Subjects
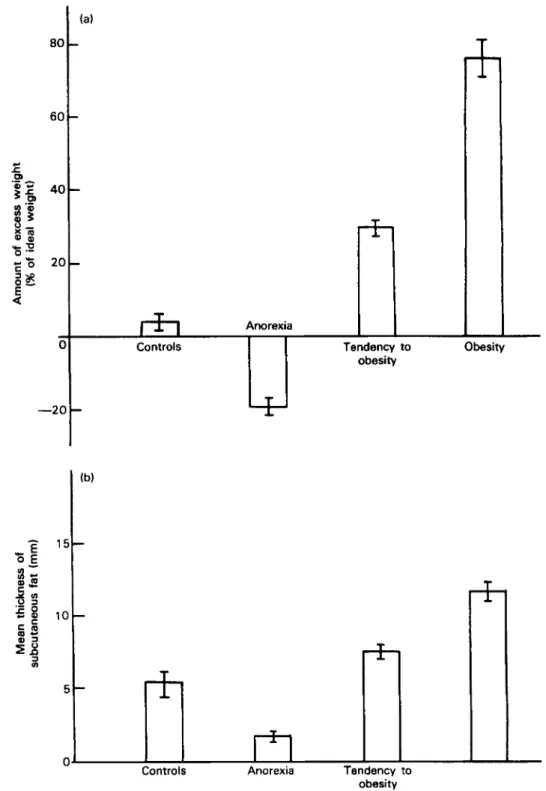
The subjects of this study were women with no evidence of endocrine disease. They were assigned to four groups according to their weight and anamnesis. Fig. 2 shows the weight (in 7’0 excess of ideal weight) and the mean thickness of
subcutaneous fat of the four groups of subjects.
( I ) Controls (n=27): womeq with body-weight within +_Io% of ideal weight.
( 2 ) A m e x i c (n = 1 8 ) : women with body-weight between -10 and -30% of ideal
(3) Trend to obesity (n=29): women moderately obese (weight +xo to +35% of
( 4 ) Obese (n=34): women with marked obesity (body-weight in excess
of
+so%weight, and with an anamnesis of anorexia nervosa.
ideal weight) and with an anamnesis of easy weight
gain.
of ideal weight).
Experiments
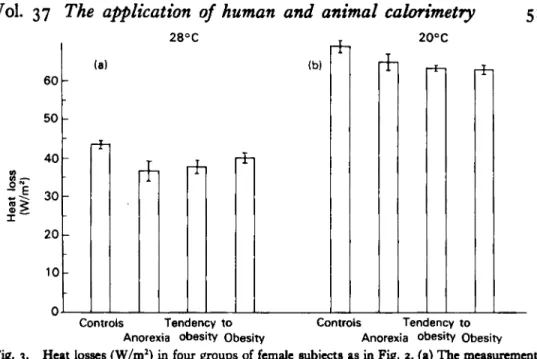
Heat losses (in W/mz) and total body insulation were measured in each group of subjects at an ambient temperature ( T, ) of 2 8 O or 20° or both. (Most subjects performed only one test.)
Heat losses
Fig. 3 shows that controls had higher heat losses than the three other groups at 28 or 20°
T,.
Thermal body insulation
Thermal body insulation was determined as previously described. In addition, the insulation due to the subcutaneous fat was calculated from measurements of subcutaneous fat thickness (Fig. 2) and the coefficient of thermal conductivity of fat ( 0 . 2 1 W/m per deg C) as described by Jkquier et al. (1974).
50 (a)
8t
60P-
o - ?2i?I
h
Anorexia O 1 v o n t r o l sI
I
Tendency toI
I
obesity besityI978
obesityFig. 2. (a) Excess weight (in 70 of ideal weight) in four groups of female subjects. (b) Mean thickness of subcutaneous fat (in mm) in the name four group of female subjects. Vertical bars
5 1 28OC 20°C (b) T 50
"i
' i r!!!
I- 10 0L
Controls Tendency to Controls rendency to Anorexia obesity Obesity Anorexia obesity Obesity
Fig. 3. Heat losses (Wlrn') in four groups of female subjects as in Fig. 2. (a) T h e measurements
werc performed by direct calorimetry 30 min &a exposure at an ambient temperature of 2 8 O . (b) The measurements werc performed I h after exposure at an ambient temperature of 20°. Vertical
bars represent the standard errors of the mean valuea
(a) 28OC 20oc
1
Th
1
ControlsTendency to Controls Tendency to Anorexia Obesity Obesity Anorexia Obesity Obesity
Fig. 4. Thermal body insulation (W-' mz "C) in the four groups of female subjects as in Fig.
2. (a) 30 min exposure at 2 8 O . (b) I h exposure at 20°. R, rcprteents the insulation due to the
subcutaneous fat. 0, represents the insulation due to the tissues underlying the subcutaneous fat,
i.e., the insulation related to the decrease of blood flow by vlsoconstriction. Vertical bars represent
the standard m r s of the mean values for total insulation.
Fig. 4 shows that subcutaneous fat insulation depends upon the weight of the subjects (dashed area of the columns). The white part of the columns represents the insulation due to the tissues underlying the subcutaneous fat, i.e., the
insulation related to the decrease of blood flow by vasoconstriction. Subjects with anorexia nervosa had the largest insulation at z 8 O , thanks to an intense vaso- constriction in subcutaneous tissues. In contrast, the obese had a large ‘fat’ insulation and a small ‘regulatory’ insulation.
After I h of cold exposure at zoo, body insulation rose in all subjects. The
increase in insulation was especially important in the tendency to obesity and obese groups. Subjects with a tendency to obesity presented a large ‘regulatory’ insulation (white part of the column) which indicates an increased vaso- constriction of subcutaneous vessels with a decreased heat transfer by the blood flow.
Metabolic heat production
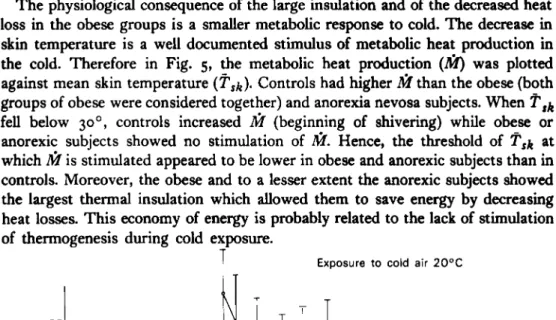
The physiological consequence of the large insulation and of the decreased heat loss in the obese groups is a smaller metabolic response to cold. The decrease in skin temperature is a well documented stimulus
of
metabolic heat production in the cold. Therefore in Fig. 5 , the metabolic heat production (&) was plotted against mean skin temperature (psk). Controls had higher &than the obese (both groups of obese were considered together) and anorexia nevosa subjects. When T r kfell below 3 0 ° , controls increased M (beginning of shivering) while obese or anorexic subjects showed no stimulation of ilk Hence, the threshold of T S k at which
n’l
is stimulated appeared to be lower in obese and anorexic subjects than in controls. Moreover, the obese and to a lesser extent the anorexic subjects showed the largest thermal insulation which allowed them to save energy by decreasing heat losses.This
economy of energy is probably related to the lack of stimulation of thermogenesis during cold exposure.Exposure to cold air 20°C
T
3 5 4 1 I I I I
29 29.5 30 30.5 31
Mean skin temperature ( “ C )
Fig. 5. Relationship between mean skin temperature and metabolic heat production (in W/m2) in the control group O---O, the tendency to obesity and the obese groups 0 - - - 0, and the anorexia nervosa group A- A. The measurements wcre performed during I h exp0am-e at an ambient temperature of 20°.
REFERENCES
Bullen, B. A., Reed, R. B. & Mayer, J. (1964). Am. J. din. Nutr. 14, zxr. Galton, D. J. & Bray, G. A. (1967). J. din. Endon. Metub. 27, 1573.
Gomez, F., Jequier, E., Chabot, V., Buber, V. & Felber, 1.-P. (1972). Metabolism 21, 381. Hardy, J. D. & Du Boiq E. F. (1937). J. Nu&. 15, 5.
Jkquier, E., Gygax, P.-H., Pittet, Ph. & Vannotti, A. (1974).
3.
uppl. Physiol. 36,674.Lusk, G . (1924). J . bwl. Chem. 59, 41.
Pittet, Ph., Chappuiq Ph., Acheson, K., de Techtermann, F. 8c Jkquier, E. (1976). Br. J . NU&. 35,
Randle, P. J., Hales, C. N., Garland, P. B. & Newsholme, E. A. (1963). Lancet i, 785.
S p i d e r , G., Jequier, E., Favre, R., Dolivo, M. & Vannotti, A. (1973). J. uppl. Physiol. 35, 158.
281.