Original Article
Nephrology
Dialysis
Transplantation
The value of different resistance parameters in distinguishing
biopsy-proved dysfunction of renal aUografts
B. Frauchiger
1, A. Bock
2, R. Eichlisberger
1, J. Landmann
3, G. Thiel
2, M. J. Mihatsch
4and K. Jager
1'Division of Angiology, 2Division of Nephrology, 3Division of Vascular and Transplantation Surgery, and ""Institute of Pathology, University Hospital, CH-4031 Basel, Switzerland
Abstract. The data concerning the value of duplex
sonography in diagnosing parenchymatous renal allo-graft dysfunction are controversial. Most early studies did not take into consideration the many factors influencing resistance parameters. We therefore per-formed a prospective, biopsy-controlled study with exclusion of all known sources of error regarding resistance parameters. Furthermore we investigated the value of a new resistance parameter, the systolic decel-eration percentage. Forty-seven duplex sonographic studies were performed on 43 patients (30 male, 13 female, median age 47 years, range 7-70). Fourteen studies were done on normally functioning grafts (con-trol group) an average of 33 days after transplantation. Thirty-three studies were performed on dysfunctional grafts immediately prior to biopsy. Grafts which had been transplanted more than a year previously or with vascular findings or any other clinical or sonographic pathology probably explaining function deterioration were excluded. In all patients, the resistive index (RI), pulsatility index (PI) and systolic deceleration percent-age (DP) were calculated in the main renal artery and in the interlobar artery. Of the 33 grafts with dysfunc-tion, nine had vascular rejection (VR), 11 interstitial rejection (IR), 11 cyclosporin A toxicity (CAT) and two other histologies (OR). The mean RI in normal grafts (NO) was 0.71+0.06 in the main artery and 0.68 + 0.06 in the interlobar artery, in VR 0.86 + 0.12 and 0.80 + 0.18, in IR 0.72 + 0.05 and 0.70 + 0.07, in CAT 0.67 + 0.06 and 0.65 ±0.07 and in OR 0.64 + 0.07 and 0.60 + 0.01. For PI, the values were 1.45 ±0.23 and 1.41 ±0.28 (NO), 3.5 + 2.13 and 2.92±2.16 (VR), 1.55±0.26 and 1.46±0.33 (IR), 1.32±0.25 and 1.27±0.26 (CAT) and 1.30±0.34 and 1.13±0.04 (OR). For DP we calculated 28±5% and 29±6% (NO), 43 ±14% and 36 ±6% (VR), 29 ±9% and 27 ± 9% (IR), 31 ± 8% and 32 ± 7% (CAT ) and 32 ± 4% and 28 + 3% (OR). The sensitivity/specificity for VR with a cutoff mean+ 2 SD was 0.44/1 for RI, 0.55/0.97 for PI and 0.33/0.89 for DP. It was concluded that:
Correspondence and offprint requests to: Prof. K. Jager, Division of Angiology, Petersgraben 4, University Hospital, CH-4031 Basel, Switzerland.
(1) despite the high selection of our patient group, diagnostic accuracy of duplex sonography for diagnos-ing parenchymatous function disorder in renal allograft remains insufficient; (2) in vascular rejection only, the resistance parameters differ significantly from the values of normal aUografts; (3) the higher the cutoff of resistance parameters, the better the specificity and the worse the sensitivity for diagnosing vascular rejec-tion; (4) of all investigated resistance parameters, the RI is the most practical due to a simple measurement technique.
Key words: biopsy; diagnostic accuracy; duplex
sonography; parenchymatous function disorder; renal allograft dysfunction; resistance parameters
Introduction
While duplex sonography is widely accepted for its high diagnostic accuracy [1-4] in diagnosing renal transplant artery stenosis, thrombosis or arteriovenous fistula, its value in the differential diagnosis of paren-chymatous disorders such as acute tubular necrosis (ATN), vascular rejection (VR), interstitial rejection (IR) and cyclosporin A toxicity (CAT) is controversial [5,6]. Table 1 lists the major published studies which address this issue [5-16]. There is an obvious hetero-genity in the design of these studies. Only half were prospective and strictly biopsy-controlled studies. Furthermore, most studies were not standardized for time after transplantation. Transplants with vascular findings, e.g. transplant artery stenosis, were not always excluded. Many studies had no standardized definition of the Doppler technique and the duplex studies were not strictly performed before biopsy. Finally, a control group with clearly defined normal function is often absent. Therefore, we were interested in evaluating the performance of commonly used resistance parameters in diagnosing biopsy-defined parenchymatous dis-orders when compared to a control group with normal renal function.
In addition, we studied a new Doppler resistance 1 1995 European Dialysis and Transplant Association-European Renal Association
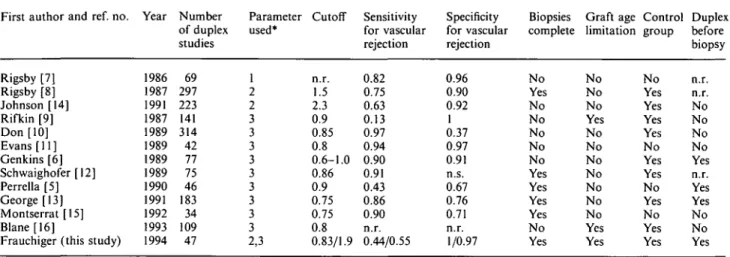
Table 1. Major studies dealing with the differential diagnosis of resistance parameters in renal allograft dysfunction, 1986-1994
First author and ref. no.
Rigsby [7] Rigsby [8] Johnson [14] Rifkin [9] Don [10] Evans [11] Genkins [6] Schwaighofer [12] Perrella [5] George [13] Montserrat [15] Blane [16]
Frauchiger (this study) Year 1986 1987 1991 1987 1989 1989 1989 1989 1990 1991 1992 1993 1994 Number of duplex studies 69 297 223 141 314 42 77 75 46 183 34 109 47 Parameter used* 1 2 2 3 3 3 3 3 3 3 3 3 2,3 Cutoff n.r. 1.5 2.3 0.9 0.85 0.8 0.6-1.0 0.86 0.9 0.75 0.75 0.8 0.83/1.9 Sensitivity for vascular rejection 0.82 0.75 0.63 0.13 0.97 0.94 0.90 0.91 0.43 0.86 0.90 n.r. 0.44/0.55 Specificity for vascular rejection 0.96 0.90 0.92 1 0.37 0.97 0.91 n.s. 0.67 0.76 0.71 n.r. 1/0.97 Biopsies complete No Yes No No No No No Yes Yes Yes Yes No Yes Graft age limitation No No No Yes No No No No No No No Yes Yes Control group No Yes Yes Yes Yes No Yes Yes No Yes No Yes Yes Duplex before biopsy n.r. n.r. No No No No Yes n.r. Yes Yes No No Yes
n.r. = not reported. *1 = diastolic/systolic ratio, 2 = PI, 3 = RI.
parameter within the same context. Usually, the characterization of vascular resistance with Doppler ultrasound is made by the ratio of minimal diastolic frequency divided by peak systolic frequency, or by modifications of this ratio. The involvement of arterial vessels by a pathologic process influences not only the ratio between diastolic and systolic frequency and the mean arterial frequency but also the waveform of the Doppler spectral analysis. Fronek et al. described several Doppler features and considered acceleration as the most sensitive [17]. Recently, Labs and co-workers reported a feature superior to acceleration. They found a significant reduction in the prestenotic systolic deceleration time in extremity artery stenosis in the segment close to the obstruction [18]. Due to the shortness of the renal transplant artery, we hypo-thesized that an involvement of vessels distal to the sampling position might also influence systolic decel-eration in renal allografts, probably yielding higher diagnostic accuracy than the commonly used resistance parameters. The evaluation of the diagnostic value of this as yet uninvestigated parameter for renal trans-plants was therefore another objective of our study.
Subjects and methods
Patients
From May 1991 to January 1993 we prospectively performed a total of 47 duplex sonographic studies in 43 patients with renal allografts (30 males, 13 females, mean age 44 years, median 47, range 7-70). Thirty-four patients had arterial hypertension, five had diabetes mellitus and seven were smokers. Four patients had a living related donor kidney, the others had cadaver grafts. Fourteen patients with normal renal function served as a control group. The inclusion criteria for the control group were normal and stable trans-plant function over the first 4 weeks after transtrans-plantation with an actual creatinine < 200 umol/1. After duplex sono-graphic measurement, the transplant function remained stable for at least 6 days. The mean serum creatinine in this
group was 112 umol/1 (median 120, range 68-169). For ethical reasons, none of these transplants had a biopsy. Duplex sonography was performed on average 33 days after transplantation (range 26-48 days, median 34). The mean heart rate was 72 + 8 beats/min, and mean blood pressure was 151 ± 15/89 + 7 mmHg.
The inclusion criterion for the dysfunction group was scheduled biopsy for increasing creatinine and/or decreasing diuresis within the first year after transplantation. The exclu-sion criteria were any vascular finding and any other clinical or sonographic pathology possibly explaining the dysfunc-tion, e.g. postrenal obstruction. Of 57 initially included biopsies, 24 were excluded from the study. Of these, 16 were excluded because of vascular findings (two iliac artery sten-oses, eight transplant artery stenosis, six AV fistulae), four because of postrenal obstruction, one because of lupus erythematodes with disseminated intravascular coagulation, one because of fever and tachycardia and two because of delayed biopsy. Therefore 33 biopsies remained in the dys-function group (25 patients with one biopsy and one duplex sonographic study and four patients with two biopsies and two duplex sonographic studies). The minimal interval between the first and the second biopsy in those patients with more than one biopsy was 1 month. The second biopsy was performed for a new function deterioration and never revealed the same histology as the first biopsy. The mean heart rate was 77 + 10 beats/min (range 56-96) and the mean blood pressure was 147+ 18/90 + 9 mmHg. The mean serum creatinine in the group of transplants with dysfunction was 237 ±22 umol/1 (range 96-600, median 178). All these patients underwent duplex sonography immediately before biopsy. The biopsies were performed on average 3.9 months after transplantation (range 0.3-9 months, median 3.9).
Itnmunosuppression
Patients received induction immunosuppression on days 0-6 in the form of either 4 mg/kg/day of rabbit ATG (ATG-Fresenius) or 5 mg/day OKT3. Associated immunosuppres-sion therapy consisted of steroids (0.5 mg/kg/day with biweekly taper to zero), azathioprin (2 mg/kg/day day 0-56) and cyclosporin A (200-300 mg twice daily from day 4, with dose adjustments as necessary to reach target levels of 200-250 ng/ml).
Distinguishing dysfunction of renal allografts
Transplant biopsy
Rejections were primarily treated with methylprednisolone pulses (0.5 g/day on three consecutive days). A renal biopsy was taken if this treatment failed in a clinical rejection situation. Graft needle biopsies (1.8 mm Tru-cut or Medilink needles) were taken with ultrasonic guidance and processed for light microscopy, immunohistology and electron micro-scopy according to standard techniques. All biopsies were classified by M.J.M.
Duplex sonographic measurements
After 10 min of rest prior to measurement of blood pres-sure and heart rate, all patients were imaged with an ATL Ultramark 9 digital plus unit (Advanced Technology Laboratories, Bothell, WA, USA) using a 3-MHz phased-array transducer. The wall filter was set at 50 Hz. Initially, the cortex, medulla and the perirenal areas were imaged and longitudinal and axial measurements were taken. In the second part of the examination, the entire length of the iliac artery as well as the main renal and peripheral arterial and venous vessels were visualized with the color-coded Doppler. The pulsed Doppler sample volume was then placed to take three measurements of peak systolic and minimal diastolic frequencies in the main renal artery as well as in the interlobar artery or in areas of special interest with pathologic color flow pattern. The Doppler angle was generally kept at 60°; in cases of tortuous vessels, angle corrections were performed. Velocities were recorded in cm/s. All transplants with vascular findings, e.g. transplant artery stenosis, venous stenosis or AV fistula, were excluded.
Frequency
(peak systolic fraq. =100%)
45% <
100 Time (msec)
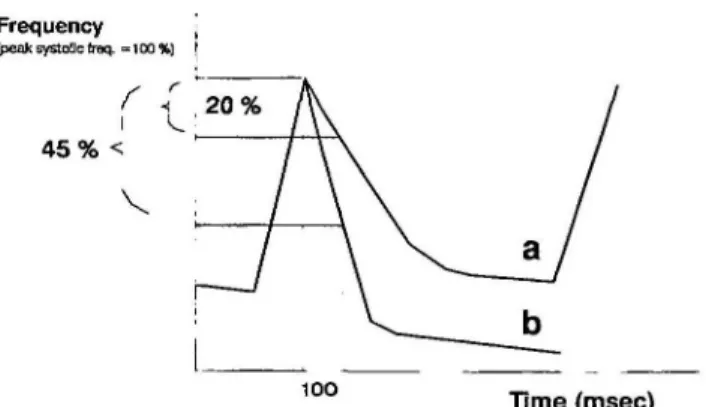
Fig. 1. Illustration of two different types of Doppler waveforms, (a) normal and (b) abnormal frequency loss in the first 100 ms after peak frequency, (a) Normal systolic deceleration; (b) increased deceleration in a segment with high peripheral resistance (e.g. vascular rejection).
Results
Biopsy results
Of the 33 biopsies, nine were classified as VR, 11 as IR, 11 as CAT and two had other morphology (OR; one had a nearly normal histology with some oxalate crystals and the other an unclassified complex histo-logy). The histological changes were graded as mild, moderate or severe. In 10 biopsies, histological changes in addition to the main finding were observed.
Calculation of resistance parameters
The resistive index (RI) [19] was calculated by the formula:
1 - minimal diastolic frequency
peak systolic frequency
The calculation of the pulsatility index (PI) [20] was according to the formula:
peak systolic frequency —minimal diastolic frequency mean peak arterial frequency
The third evaluated parameter was the systolic decel-eration (DP, deceldecel-eration percentage). Modifying the parameter used by Labs et ah, we did not calculate the time of deceleration but the percentage of peak velocity reduction during the first 100 ms after the systolic peak [18]. Figure 1 illustrates the principle of this parameter.
For RI, an additional calculation for the correction of heart rate was performed [21]. The correction of RI for heart rate according to Mostbeck revealed slightly lower mean values by 0.01-0.02, in all sub-groups except vascular rejection. Because this non-significant change did not influence either sensitivity, specificity or positive or negative predictive value, the heart rate-corrected data were not considered further. No correction formulae exist for PI and DP.
Resistance parameters
Table 2 gives an overview of the different resistance parameters in the diagnosis groups. In the control group, we found a significant difference for RI and PI between the values in the main renal artery and those in the interlobar artery (/><0.02, paired Mest). RI, PI and DP in the main renal artery of grafts with vascular rejection differed significantly from the values in normal transplants (for RI P< 0.009, for PI and DP
P<0.03, unpaired Mest). The other histologies did
not differ significantly from normal grafts. Figure 2
Fig. 2. Duplex sonogram of a severe vascular rejection. The left part of the illustration shows the position of the Doppler sample volume in the main renal artery. On the right side, the Doppler spectral analysis shows absent flow in mid and end diastole. RI is equal to 1.
530
Table 2. Values of the three resistance parameters (mean ± SD)
B. Frauchiger el al. Main artery 0.71+0.06f (0.69 + 0.06) 1.45 + 0.23 28 ±5% 0.86 + 0.12* (0.86 + 0.12) 3.5 + 2.13** 43 ±14%*** 0.72 + 0.05(0.71+0.05) 1.55 + 0.26 29 + 9 0.67 + 0.06(0.65 + 0.05) 1.32 + 0.25 31+8% Interlobar artery 0.68 + 0.06f 1.41+0.28 29 ±6% 0.80+0.18 2.92 + 2.16 36 + 6% 0.70 + 0.07 1.46±0.33 27 ±9% 0.65+0.07 1.27 + 0.26 32 + 7% Statistics Normals (n = 14) RI1 PI Deceleration Vascular rejection (n = 9) RI1 PI Deceleration Interstitial rejection (n = 11) RI' PI Deceleration Cyclosporin A toxicity (/»= 11) RI1 PI Deceleration tP<0.02 *P<0.009 vs normals **P<0m vs normals ***P<0.03 vs normals 1
Values corrected for heart rate [21].
shows the duplex sonogram of a severe vascular rejection.
Diagnostic accuracy
The calculations of sensitivity/specificity are based on the highly selected patient group. Since only the patients with vascular rejection differed in their resist-ance parameters from the normals, we only evaluated the performance of the three parameters in detecting vascular rejection. The cutoff for all parameters was based on the values of normal transplants and was defined by the mean-t-2SD. Therefore, the cutoff for RI was 0.83, for PI 1.9 and for deceleration percentage 39%. The sensitivity/specificity for vascular rejection was 0.44/1 for RI, 0.55/0.97 for PI and 0.33/0.89 for DP. The receiver operating curve (ROC) with stepwise increased threshold for all three resistance parameters is shown in Figure 3.
Discussion
The accuracy of duplex sonography in the diagnosis of parenchymatous disorders of renal allografts is
Sensitivity 1 0.9 0.8 0.7 0.6 0.5 0.4 0.3 0.2 0.1 0 " ^ " - " ^ ^ ^ ^ ^ - ^ ^ " — \ " • RIO.6-0.83 » P11.0-2.5 * DP 25 - 45 T \ " 1 V< ,—.— 0.1 0.2 0.3 0.4 0.5 0.6 0.7 0.8 0.9 1 Specificity
Fig. 3. Receiver operating curve for RI, PI and DP (stepwise increased threshold) in diagnosing vascular rejection.
controversial. We therefore performed a prospective and biopsy-controlled study and tried to eliminate any known sources of error with respect to resistance parameters. Despite this, we were unable to demon-strate any use of duplex sonography for diagnosing parenchymatous disorders. Vascular rejection was the only state in which the mean values for all resistance parameters differed significantly from those of normal transplants. With a standard cutoff of mean + 2SD we achieved for vascular rejection an excellent specificity combined with a poor sensitivity. Lowering the cutoff somewhat increases sensitivity but at the same time lowers specificity.
The lack of diagnostic accuracy is evident. Despite the highly selected patient group, we achieved an acceptable specificity for vascular rejection only, but combined with an insufficient sensitivity in a clinical setting. Assuming that interstitial rejection or cyclospo-rin A toxicity influences the resistance parameters in a predictable way appears to be wrong. Despite the known vasoconstrictive effect of cyclosporin A on peripheral renal vessels [22], we noted no difference compared to normal transplants in our study. On the other hand, Platt et al. showed a significant increase in RI in postrenal obstruction, a non-vascular cause of renal dysfunction [23]. Inconsistent results are reported for ATN. Because in our institution ATN is based on clinical parameters, and allografts with imme-diate postoperative dysfunction only rarely undergo biopsy, we have no data for comparison in this study. The available data in the literature suggest that severe ATN causes an increase in resistive parameters [24,25]. In summary, only a severe reduction of renal blood flow seems to influence duplex sonographic parameters of resistance. In irradiated pig kidneys, even a blood flow reduction of two-thirds did not influence Doppler parameters significantly [26]. Therefore, a blood flow reduction of about 50%, as seen in cyclosporin A toxicity, does not necessarily change resistive para-meters. On the other hand, in severe vascular rejection
renal blood flow may be decreased to 10-20% [27]. In addition to thrombosis, intimal proliferation and inti-mal fibrosis, severe blood flow reduction seems to be mediated by thromboxane, which leads to an extensive preglomerular vasoconstriction [28,29]. In this situ-ation, Doppler parameters change significantly. As a co-factor to the renal pelvis pressure increase, the renal blood flow reduction may also be mediated by throm-boxane-induced vasoconstriction in postrenal obstruc-tion [30].
The exclusion of potential miscalculations by a care-ful study design did not improve the accuracy of duplex sonography. Since the correction for heart rate did not influence diagnostic accuracy of RI in our series, we ignored this factor in all subgroups. Furthermore, for PI no correction factor is known, while the systolic deceleration does not seem to be influenced by heart rate. Nevertheless, a more accurate distinction of different parenchymal disorders could not be achieved. In randomly selected cases, the scattering of the results in the different groups may have been even larger.
The comparison between the three applied para-meters shows that there are no substantial differences in diagnostic accuracy. With the cutoff mean + 2SD, the highest sensitivity was reached by PI, whereas the RI had a somewhat poorer sensitivity but an excellent specificity of 100%. However, sensitivity (33-55%) of all parameters is insufficient.
The new parameter, the deceleration percentage, was based on the observation that the systolic deceleration is increased in cases of a more distal arterial obstruction [18]. We reached a high specificity in vascular rejection similar to PI with a slightly poorer sensitivity. The alteration of the late systolic Doppler waveform seems to be affected by the same mechanisms as RI and PI. The change of the Doppler waveform in late systole is uniform and consists of a deceleration increase. The graduation of the increase again shows no correla-tion to the pathologic diagnosis except for vascular rejection.
The PI has one more measurement element than RI. Despite this, the additional calculation of mean velocity effects no additional diagnostic accuracy. We assume that this is due to the close relationship between the minimal diastolic velocity and the mean velocity which effects a parallel cumulative increase of variance.
In consideration of all above facts, the RI is easiest to perform and gives the best information. Only two simple parameters are needed for calculation of RI. For PI, three parameters are necessary, of which the mean velocity requires corresponding calculation soft-ware in the scanner. The quantification of late systolic deceleration requires either extended manual measure-ment or special calculation software.
The values of the resistance parameters in the main artery compared to the interlobar artery are signific-antly higher. This phenomenon has already been reported in an earlier study [25]. It is assumed that the decrease of resistance parameters from the central renal artery to the periphery is due to a decrease of the resistance remaining 'downstream'. We also noted
distinctly lower velocities in the peripheral vessels compared to the main artery. The same observation was described by Deane [31]. Nevertheless, the differ-ence between the two sampling positions has no dia-gnostic significance.
We conclude that the resistance parameters measured by duplex sonography are insufficient for the diagnosis of parenchymal diseases in renal allografts. The only exception to this is the diagnosis of vascular rejection. In this situation, distinctly increased resistance para-meters indicate vascular rejection as the most probable disorder provided all known sources of error are excluded. While duplex sonography is very useful for diagnosing vascular lesions within the main renal artery, its use for parenchymal disorders is limited.
References
1. Grenier N, Douws C, Morel D et al. Detection of vascular complications in renal allografts with color Doppler flow imaging. Radiology 1991; 178: 217-223
2. Plainfosse MC, Menoyo Calonge V, Beyloune-Mainardi C, Glotz D, Duboust A. Vascular complications in the adult kidney transplant recipient. J Clin Ultrasound 1992; 20: 517-527 3. Taylor KJ, Morse SS, Rigsby CM, Bia M, Schiff M. Vascular
complications in renal allografts: detection with duplex Doppler US. Radiology 1987; 162: 31-38
4. Frauchiger B, Eichlisberger R, Bock A et al. Frequency and clinical significance of vascular findings in renal allograft dys-function. Eur J Ultrasound 1994; 1 (Suppl 1): 24
5. Perrella RR, Duerinckx AJ, Tessler FN et al. Evaluation of renal transplant dysfunction by duplex Doppler sonography: a prospective study and review of the literature. Am J Kidney Dis 1990; 15: 544-550
6. Genkins SM, Sanfilippo FP, Carroll BA. Duplex Doppler sono-graphy of renal transplants: Lack of sensitivity and specificity in establishing pathologic diagnosis. Am J Roentgenol 1989; 152: 535-539
7. Rigsby CM, Taylor KJ, Weltin G et al. Renal allografts in acute rejection: evaluation using duplex sonography. Radiology 1986; 158: 375-378
8. Rigsby CM, Burns PN, Weltin GG, Chen B, Bia M, Taylor KJW. Doppler signal quantitation in renal allografts: compar-ison in normal and rejecting transplants, with pathologic correla-tion. Radiology 1987; 162: 39-42
9. Rifkin MD, Needleman L, Pasto ME et al. Evaluation of renal transplant rejection by duplex Doppler examination: value of the resistive index. AJR 1987; 148: 759-762
10. Don S, Kopecky KK, Filo RS et al. Duplex Doppler US of renal allografts: causes of elevated resistive index. Radiology 1989; 171: 709-712
11. Evans C, Cochlin DL, Ferguson C, Griffin PJ, Salaman JR. Duplex Doppler studies in acute renal transplant rejection. Transplant Proc 1989; 21: 1897-1898
12. Schwaighofer B, Kainberger F, Fruehwald F, Huebsch P, Gritzmann N, Karnel F, Tscholakoff D. Duplex sonography of normal renal allografts. Ada Radiol 1989; 30: 53-66
13. George EA, Salimi Z, Wolverson MK, Garvin PJ. Assessment of renal allograft pathology by scintigraphic and ultrasound index-markers. Renal Allograft Pathol 1991; 6: 394-398 14. Johnson CP, Foley WD, Gallagher-Lepak S, Roza AM, Adams
MB. Evaluation of renal transplant dysfunction using color Doppler sonography. Gynecol Obstet Surg 1991; 173: 279-284 15. Montserrat E, Lauzurica R, Vails R et al. Usefulness of duplex
Doppler sonography in the diagnosis of acute renal allograft rejection. Transplant Proc 1992; 24: 61-62
16. Blane CE, Gagnadoux MF, Brunelle F, Argyropoulou M, Lallemand D. Doppler ultrasonography in the early postopera-tive evaluation of renal transplants in children. Can Assoc Radiol 1993; 44: 176-178
532
17. Fronek A, Johansen KH, Dilley RB, Bernstein EF. Noninvasive physiologic tests in the diagnosis and characterization of peri-pheral arterial occlusive disease. Am J Surg 1973; 126: 205—214 18. Labs KH, Windeck P, Pischel T, Jager KA. The pre-stenotic
Doppler shift signature. VASA 1992; 21: 241-248
19. Pourcelot L. Applications cliniques de l'examen Doppler trans-cutane. In: P Peronneau, ed. Velocimetrie Ultrasonore Doppler. INSERM, Paris, 1975; 213-240
20. Gosling RG, Dunbar G, King DH et al. The quantitative analysis of occlusive peripheral arterial disease by a non-intrusive ultrasonic technique. Angiology 1971; 22: 52-55
21. Mostbeck GH, Goessinger HD, Mallek R, Siostrzonek P, Schneider B, Tscholakoff D. Effect of heart rate on Doppler measurements of resistive index in renal arteries. Radiology 1990; 175: 511-513
22. Kho TL, Teule J, Leunissen KJVIL et al. Nephrotoxic effect of cyclosporine A can be reversed. Transplant Proc 1987; 19:
1749-1753
23. Platt JF, Ellis JH, Rubin JM. Renal transplant pyelocaliectasis: role of duplex Doppler US in evaluation. Radiology 1991; 179: 425-428
24. Attal M, Bitker MO, Bousquet JC, Chatelain C, Grellet J. Diagnosis of early complications of the transplanted kidney by pulsed Doppler. J Radwl 1991; 72: 187-192
B. Frauchiger et al. 25. Rajaseker MR, Lodge JP, Irving HC, Giles GR. Early computed colour echo Doppler imaging following renal transplantation.
Br J Surg 1991; 78: 872-874
26. Mastorakou I, Robbins MEC, Bywaters T. Resistance and pulsatility Doppler indices, how accurately do they reflect changes in renal vascular resistance. Br J Radio! 1993; 66: 577-580
27. Ash J, DeSouza M, Peters M, Wilmot D, Hausen D, Gilday D. Quantitative assessment of blood flow in pediatric recipients of renal transplants. J Nucl Med 1990; 31: 580-585
28. Thonshoff B, Busch C, Schweer H, Scharer K, Seyberth HW.
In vivo prostanoid formation during acute renal allograft
rejec-tion. Nephrol Dial Transplant 1993; 8: 631-636
29. Munger KA, Coffman TM, Griffiths RC, Fogo A, Badr KF. The effects of surgery and acute rejection on glomerular hemody-namics in the transplanted rat kidney. Transplantation 1993; 55: 1219-1224
30. Yanagisawa H, Jin Z, Kurihara N, Klahr S, Morrissey J, Wada O. Increases in glomerular eicosanoid production in rats with bilateral ureteral obstruction are mediated by enhanced enzyme activities of both the cyclooxygenase and 5-lipoxygenase path-ways. Proc Soc Exp Biol Med 1993; 203: 291-296
31. Deane C. Doppler and color Doppler ultrasonography in renal transplants: chronic rejection. J Clin Ultrasound 1992; 20: 539-544
Received for publication 26.6.94 Accepted in revised form 13.12.94