Publisher’s version / Version de l'éditeur:
Journal of the Illuminating Engineering Society, 16, 1, pp. 143-149, 1987-01
READ THESE TERMS AND CONDITIONS CAREFULLY BEFORE USING THIS WEBSITE.
https://nrc-publications.canada.ca/eng/copyright
Vous avez des questions? Nous pouvons vous aider. Pour communiquer directement avec un auteur, consultez la première page de la revue dans laquelle son article a été publié afin de trouver ses coordonnées. Si vous n’arrivez pas à les repérer, communiquez avec nous à [email protected].
Questions? Contact the NRC Publications Archive team at
[email protected]. If you wish to email the authors directly, please see the first page of the publication for their contact information.
NRC Publications Archive
Archives des publications du CNRC
This publication could be one of several versions: author’s original, accepted manuscript or the publisher’s version. / La version de cette publication peut être l’une des suivantes : la version prépublication de l’auteur, la version acceptée du manuscrit ou la version de l’éditeur.
Access and use of this website and the material on it are subject to the Terms and Conditions set forth at
Check value verification under different levels of illumination
Smith, S. W.; Rea, M. S.
https://publications-cnrc.canada.ca/fra/droits
L’accès à ce site Web et l’utilisation de son contenu sont assujettis aux conditions présentées dans le site LISEZ CES CONDITIONS ATTENTIVEMENT AVANT D’UTILISER CE SITE WEB.
NRC Publications Record / Notice d'Archives des publications de CNRC:
https://nrc-publications.canada.ca/eng/view/object/?id=96b34a6c-298f-47ab-b0a5-05ab560d9ac9 https://publications-cnrc.canada.ca/fra/voir/objet/?id=96b34a6c-298f-47ab-b0a5-05ab560d9ac9Ser
THI
n21d
no.
1469
National Research
Conseil national
c
2b
Council Canada
de recherches Canada
BrnG
-
Institute for
lnstitut de
Research in
recherche en
Construction
construction
... .
Check Value Verification Under Different
Levels of Illumination
by S.W. Smith and M.S. Rea
Reprinted from
Journal of the Illuminating Engineering Society
Winter 1987, p. 143- 149
(IRC Paper No. 1469)
Price $3.00
NRCC 27951
-
NNRC-
CISTI fI R C
L I B R A R Y
A d 6
i4
1987
B I B L ~ O T H ~ Q U E
I
R
C
i
CNRC-
IClSTABSTRACT
Performance at a simulated realistic task, check value
verification of handwritten numerals, was tested under
different illumination levels. Verification speed and accuracy
improved with illumination level up to about 5,000 lx.
Legibility of handwritten numerals was important to
performance, poorer handwriting being more difficult.
Performance for all checks improved at the same rate with
illumination level.
k s u d
On a dvalu6 la performance de certains sujets lors de
l'exdcution d'une tache rgelle mais simulge, soit la
vdrification des montants de cheques dcrits
3 la main, 3 des
niveaux dlCclairage difftkents.
La vitesse et la prgcision
ont augment6 avec le niveau dlCclairage
dont le niveau maximum
dtait d'environ
5
000 lx.
La lisibilitd des chiffres dcrits
3
la main dt
ait importante dans cette exp'erience, une mauvaise
6criture rendant la legt-*-n
p l u sd&&f
f a b k
La performance des
sujets, pour ce qui ess
~~2 <-de tous les chsques,
Check Value Verification Under Different
Levels of Illumination
Stanley W Smith, Ph.D. (I) and Mark S. Rea, Ph.A (2)
This manuscript was accepted for publication in 1980. The present editors regret the tardiness of its publication.
Introduction
This is the third report of a series describing ex- periments designed to explore and define relation- ships between illumination level and the performance of tasks having selected realistic components of typi- cal office tasks. The first report described an experi- ment involving proofreading of paragraphs for mis- spelled words.' In that experiment performance im- proved with increased illumination at different rates for a group of young and a group of older subjects and for different print qualities. The second report described an experiment involving reading for infor- mation taking a reading test2. In this second experi- ment there were no large consistent differences in test scores attributable to light level for a group of young and a group of older subjects. The experiment de- scribed in this third report involved comparing four digit handwritten numbers on personal checks with typed numbers on a sheet of paper. Since many office jobs involve similar tasks and materials, the general features of the functional relationships derived from this experiment should have practical significance.
Stimulus Materials
Seven common types of personal checks (2-314
x
6inches) were obtained from a bank note printing com- pany. Five types of plain design differed mainly in color: blue, gray, green, pink and yellow. The other two types were sets containing several multicolored
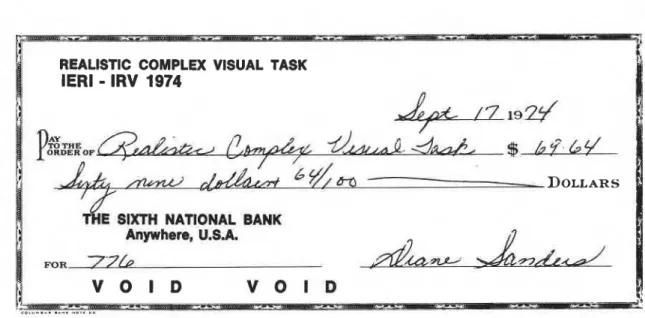
scenes. Figure 1 shows the format and a sample of how
checks were written.
Seventy-four unsystematically selected people each wrote one check of each type using his or her own pen or pencil and check writing style. They were told what to write on each check. This included a four-digit dollar and cents amount ranging from $10.00 to $99.99. Amounts were pre-determined from a table of random numbers. The 518 checks were rated by six other people for the "readability" of the four digit numbers. Rating was done under uniform illumina-
tion of 0.9 fc using a five-point scale ranging from 1
(very difficult) to 5 (very easy). The checks were then ordered according to their average ratings. The 59 checks with ratings just below the 80 with the highest
(1) Division of Sensory Biophysics and Institute for Research in Vision, Ohio State University. (2) Institute for Research and Construction, Nu-
tional Research Council, Ontario, Canada.
ratings were eliminated to increase the separation be- tween the most readable and the other checks. Similarly, 59 checks were eliminated to increase the separation between the 80 checks of poorest readabili- ty and those of better readability. The remaining 400 checks, 40 in each of ten sets, were used in the experi- ment. The eliminated checks were used for practice trials.
The 80 least readable checks were divided into sets of 40 primarily on the basis of whether low readability was due to poor handwriting (set 1) or to basic visual variables such as low contrast, small numbers or thin
lines (set 2). This distinction was not clear, and
therefore not used, in grouping checks for the other eight sets. The average readability rating for each set
of checks is listed in Table 1.
Ten checks (one from each set) were selected for visibility assessment. These checks had the smallest rating variability of those having the value of the aver- age rating of the set. Visibility measurements3 were made of the handwritten four-digit numbers of the selected representative checks by an experienced oper- ator whose calibration function closely approximated the standard visibility reference function4. Measure- ments were made with a 15-inch viewing distance at 30 degrees from vertical. The visibility levels determined
in this way are listed in Table 1. Luminance values,
determined for the representative checks with the same viewing angle, are also listed. Contrast rendition
factors (CRF) for three representative checks were
0.84, 0.83 and 0.89 (samples from sets 1,
7
and 10respectively).
Each set of 40 checks was divided into four subsets of ten randomly ordered checks. Response sheets were made for each subset with errors (a single incorrect numeral) located randomly in the list and within the numbers. Zero, one, two or three errors were put in different response sheets with a distribution frequen-
cy of 1, 2, 2, and 1 respectively. Thus, the average
number of errors to be searched for per trial was 1.5. Response sheets were made of #20 white mimeo bond paper 4-114 inches wide by 5-112 inches high. They were mimeographed (with black ink) using stencils typed with an IBM Selectric Dual Gothic element (12 pitch) to produce a doublespaced column of ten four- digit numbers representing dollar and cents amounts
ranging from $10.00 to $99.99. Figure
2
shows how thenumbers were arranged on the response sheets. Apparatus
A specially designed apparatus was used for check presentation. Its purpose was a) to assure a constant presentation location, b) to permit the subject to quickly and easily handle the checks without soiling or damaging them and c) to automatically time each trial. The apparatus consisted of a low platform on which ten checks, each in a separate holder, could be stacked. Removal of a white plate covering the first (top) check tripped a microswitch starting a timer. Flipping the last (tenth) check holder tripped another microswitch stopping the timer. The check holders had staggered tabs to facilitate turning the checks rapidly.
b t h k r apparatus was the same as that used for the
previous exeriments!~~ The viewing chamber con-
sisting of three walls, a floor and a luminous ceiling was 32-inches (0.813 meter) high, 40-inches (1.02 meters) wide and 36-inches (0.914 meter) from front to rear. The floor and walls were matte white. The chamber floor was 30 inches (0.76 meter) above the room floor permitting the subject (sitting on an ad- justable chair with wheels) to pull up to the viewing chamber comfortably as to a desk or table. Illumina- tion was provided by nineteen CWX (cool white deluxe) fluorescent lamps wired in six circuits. These lamps were in a cavity above two diffusers. There was space between the lamp and the top diffuser for a filter (opaque sheet with small holes). The lower dif- fuser, which was 9-112 inches (0.241 meter) below the upper one, served as the luminous ceiling, Turning various lamps off and adding filters reduced the level of luminous output without altering the spectral com- position or geometry of the lighting.
'hble 1-Illuminance, average readability ratings of check sets, and luminance and visibility level values of representative checks1
Light Level
I I1 111 IV
(0.92 fc (11.7 fc (95 fc (454 fc Check horiz.) horiz.) horiz.) horiz.)
s e t R L V L L V L L V L L V L
'R, Average readability rating (see text); L, luminance (foot- lamberts) of area surrounding numbers; VL, visibility level (see Reference 4).
Combinations of lamp circuits and filters were selected to produce four specific light levels. Horizon- tal illumination was measured at the task location, i.e.,
centered twelve inches (0.305 meter) from the front, and flat on the floor of the viewing chamber. Light levels were monitored throughout the experiment. Procedures and Experimental Design
All sessions were the same except for the order of presentation of light levels, check sets and checks within sets. Each of the four light levels was used once per session during one of four equal time periods (blocks). Each subject served in four sessions. Light level presentation order was counterbalanced over blocks and sessions, and for subjects. Check (and set) presentation sequence was the same for all subjects, thus it was also counterbalanced for light level.
Each trial consisted of the presentation of ten ran- domly ordered checks and a corresponding response sheet. Each block contained ten trials, one for each check set. Check sets were ordered randomly within blocks. Each of the 40 subsets of checks was presented once during each session. Checks, subsets of checks and check sets, were ordered differently for each ses- sion. Thus, each subject had 160 trials (40 under each light level, of which four were from each check set). All subjects read the same instructions that explain- ed the purpose of the experiment, the stimulus mater- ials (including possible errors and their distribution characteristics), procedures, features of the experi- mental design and details of the pay incentive system. Several preliminary trials were presented to acquaint subjects with the task, procedures, scoring system, stimulus materials and lighting.
At the beginning of each session the subject com- pleted a questionnaire while adapting to the first light level. The subject was then given a practice trial before proceeding with the ten trials of the first block. The light level was changed, and after a period of adapta- tion and a practice trial, the subject was given the se- cond block of ten trials. The same procedure was followed for the third and fourth blocks of trials. Per- formance time and errors were reported to subjects immediately after each trial.
Pay was based on performance as indicated in Table
2
(for definition of terms see Results), with each point-
worth 0.25 cent. The score for a trial was the sum of
the values for time and accuracy. The zero value for
,
times less than five seconds discouraged subjects from
skipping difficult trials
(e.g.,
ones involving difficult toread checks at low illumination levels).
a b l e 2-Scoring system Time
(seconds) Value Response Value
0-4.99 0 Hit
+
1 5.9.99 5 Miss - 10.14.99 4 False alarm - 1 15-19.99 3 Correct rejection+
1 20-24.99 2 25-29.99 1 2 30 oSubject's task
The subject's task was to read each set of ten checks as rapidly and accurately as possible to maximize score (and consequently pay). Subjects were instruct- ed to indicate errors by rapidly making a slash mark through each number on the response sheet contain- ing an error. This minimized response time.
Subjects
Four young adults (ages 18 to 22) having normal vi- sion (good near and far binocular visual activity without correction and no known or obvious visual defects) served in the experiment. Two subjects (nos. 1 and 4 were female college freshmen and the other two (nos. 2 and 3) were male college graduates. The two females had served as subjects in the two prior ex- periments of this series; 2 the males had each served in one (a different one) of the prior experiments.
Results and discussion
The time taken to verify each set of ten checks was recorded by the experimenter. Hits (number of errors found and marked by the subject), misses (errors not marked), false alarms (correct numbers marked as wrong) and correct rejections (correct numbers not marked) were determined and recorded. Score was calculated as described in reference to Table
2.
Perfect check value verification for a trial consisted of marking all numbers on the response sheet con- taining an error, and no others. This produced a score of 10. When the task was performed in 5 to 10 seconds, a time score of five was added, making 15 the max- imum possible score per trial. Maximum scores were achieved on 125 of the 640 trials of the experiment (68 by Subject 1 and 57 by Subject 3). Although the mini- mum possible score was minus 10, there were only six trials with scores less than plus 10 (one plus 5, one plus 8, and four plus 9s). The average score for all sub- jects and conditions was 13.72. Average scores for in- dividual subjects were 14.09, 13.41, 13.98 and 13.41 for subjects 1, 2, 3 and 4 respectively.
Table 3 contains the performance data for the major
variables; light level and check group. Miss rate and correct rejection rate can be obtained by subtracting hit rate and false alarm rate respectively from 1.00.
Analyses of variance show that the Light Level term was statistically significant for Time (p
<
0.001), False Alarms (p = 0.01) and Score (p<
0.001), but not for Hits ( p2
0.1). The Check Group term was statistically significant (p2
0.001) for Time, Hits, False Alarms and Score. The Light Level-Check Group interaction term was not statistically significant (p2
0.1) for any of the performance measures).In general, performance improved as illumination increased; time and false alarm rate decreased while hit rate remained approximately constant. It is in- teresting to note that the small reversal in perfor-
mance time for light levels I1 and I11 (average time per trial was 0.14 second longer for light level I11 than for light level 11) was more than compensated for by a slightly higher hit rate and lower error rate, producing a higher performance score for light level 111. This il- lustrates the importance of assessing both speed and accuracy; an erroneous conclusion could be drawn about relative task performance for the two light levels if speed alone is used. Figure 3 shows the overall rela- tionship between performance score and light level for this experiment. (In this report all curves were fit- ted to data points visually. Brackets represent plus and minus one standard error of the mean.) Figure 4
shows the performance-light level relationship for checks of different visual-perceptual quality: (1) check sets 1 and 2 (rather poor quality handwritten numbers, average readability rating 2.25), (2) check sets 3 to 8 (good quality numbers, average readability rating 3.6) amd (3) check sets 9 and 10 (excellent quali- ty numbers, average readability rating 4.5). Perfor- mance scores were substantially lower for the poor quality checks at all light levels. Performance was little affected by the check quality differences of the other grouped sets.
Figure 5 shows in more detail the relationship bet-
ween performance score and check quality (average readability rating). In general, performance improved as readability increased. The data for check set 1, however, are aberrant. Performance was considerably worse for set 1 than for set 2 although average reada- bility values for the two sets were nearly the same (ac- tually slightly lower for set 2). The main difference between the two sets was that most of the checks with poor handwriting (poorly formed numerals) were put in set 1, whereas the low readability ratings for set 2 were mainly due to numerals of low contrast, small size or thin strokes. Apparently this difference affect- ed task performance more strongly than it affected readability rating. This interpretation is substantiated by an analysis of the data for check set
5.
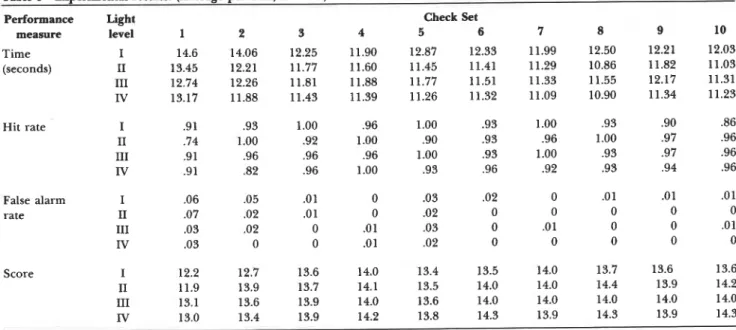
That set had a relatively high false alarm rate. A single check of the 40 in set 5 accounted for seven of the twelve false alarm errors of that set (that check had the highest false alarm rate of any of the 400 checks used in the experiment). Upon inspection it was clear that the handwritten number "73.41" was formed in a way that could easily be interpreted as "73.44." During the readability scaling most observers probably saw it as one number or the other without realizing that it could be interpreted a second way (actually one observer rated it 1, four rated it 4 and one rated it 5). It should have been rated much lower and assigned to set 1. Re-scoring by allowing both interpretations of the numeral (i.e., eliminating the 7 false alarms) pro- duces a score of 13.80 instead of 13.58 for set 5. The score corrected in this way is indicated by the solid point in Figure 5.Table 3-Experimental results. (Average per trial; n = 16,)
Performance Light Check Set
measure level 1 2 3 4 5 6 7 8 9 10
Time I 14.6 14.06 12.25 11.90 12.87 12.33 11.99 12.50 12.21 12.03 (seconds) I1 13.45 12.21 11.77 11.60 11.45 11.41 11.29 10.86 11.82 11.03 I11 12.74 12.26 11.81 11.88 11.77 11.51 11.33 11.55 12.17 11.31 IV 13.17 11.88 11.43 11.39 11.26 11.32 11.09 10.90 11.34 11.23 Hit rate I .91 .93 1 .OO .96 1 .OO .93 1.00 .93 .90 .86 I1 .74 1.00 .92 1 .OO .90 .93 .96 1 .OO .97 .96 111 .91 .96 .96 .96 1.00 .93 1.00 .93 .97 .96 IV .91 .82 .96 1 .OO .93 .96 .92 .93 .94 .96 False alarm I .06 .05 .O 1 0 .03 .02 0 .O 1 .01 .01 rate I1 .07 .02 .01 0 .02 0 0 0 0 0 11 I .03 .02 0 .O 1 .03 0 .O 1 0 0 .01 IV .03 0 0 .O 1 .02 0 0 0 0 0 Score I 12.2 12.7 13.6 14.0 13.4 13.5 14.0 13.7 13.6 13.6 I1 11.9 13.9 13.7 14.1 13.5 14.0 14.0 14.4 13.9 14.2 I11 13.1 13.6 13.9 14.0 13.6 14.0 14.0 14.0 14.0 14.0 lV 13.0 13.4 13.9 14.2 13.8 14.3 13.9 14.3 13.9 14.3
REALISTIC COMPLEX VISUAL TASK
IERI
-
IRV 1974
/$AuL-
DOLLARS
Anywhere, U.S.A. W R77b
V O I D
V O I D
<*."-."...-.
..,,, .,,Figure I-Reproduction of a sample check.
Figure 2-Example of number arrangement on response sheets.
9
-
S T A N D A R D ERROR O F M E A N 7-
-
-
N = 1 6 0 T R I A L S PER P O I N T-
A L L 4 S U B J E C T S A L L 1 0 C H E C K G R O U P S-
1 3 10 3 0 100 300 1000 H O R I Z O N T A L I L L U M I N A T I O N , f c ( I N A D I F F U S I N G W H I T E C U B I C L E ) C H E C K G R O U P S 9 - 1 0-
C H E C K G R O U P S 3 - 8+--=-
A 1 A - C H E C K G R O U P S 1 - 2 / .:
-
A L L 4 S U B J E C T S N F O R A A N D = 3 2 T R I A L S PER P O I N T-
N F O R 0 = 9 6 T R I A L S PER P O I N T H O R I Z O N T A L I L L U M I N A T I O N , f c ( I N A D I F F U S I N G W H I T E C U B I C L E ) A L L 4 L I G H T L E V E L S . = C O R R E C T E D S C O R E 1 (SEE T E X T ) 3 4 5 R E A D A B I L l T Y R A T I N G Figure 3 Figure 4 Figure5
For the ten check sets, the Spearman Rank Correla- ZES
Lighting Handbook, 5th ed.
pp. 3-14 to 3-16, New tion (Q) between readability ratings and visibility (c? York: Illuminating Engineering Society.is 0.576 (significant at p 5 0.05), between performance
.
score and readability it is 0.661 (significant at p 5 0.05) and between performance score and visibility it is 0.345 (not statistically significant, p>
0.05). Although visibility measurements were made on only a single check from each set and they, as well as the readability ratings and task performance data, are subject to normal variability, there seem to be impor- tant potentially identifiable variables that differential- ly affect these three methods of scaling stimuli. The discussion in the preceding paragraph could serve as a guide for further investigation of this hyposthesis.Additional analyses indicate that light level and check quality affected the full range of performance,
e.g,
the number of trials for which performance was maximum (score was 15) increased with light level (19, 34, 34, and 38 for light levels I, 11, I11 and IV respec- tively) and with check quality (from 3 for check set 1, to 19 for check set lo), and minimum scores increased with light level (5, 9, 10 and 11 for light levels I, 11, I11 and IV respectively) and with check quality (four of the six score below 10 were for check set 1 and the others for check set 2). There was a practice effect (the combined average scores for individual sessions were 13.22, 13.74, 13.94 and 13.99 for sessions 1, 2, 3 and 4 respecively). It does not, however, alter the conclu- sions reached about the effects of light level and check quality.Summary and Conclusions
The subjects' task in this experiment involved com- paring four-digit handwritten numbers on personal checks with typed numbers on a response sheet. Errors (numbers on the response sheet that did not correspond to those on the checks) were to be found and marked. Task performance speed and accuracy were recorded. Four young (ages 18 to 22) subjects served in the experiment. Handwriting quality and illumination level affected performance sigificantly. Poor handwriting affected performance more than did visibility variables (contrast, size, stroke width, etc.) which were rated the same on a "readability" scale. Performance improved with increased illumina- tion, rapidly at low levels and more gradually at high levels (up to 454 fc).
References
1. Smith, S. W. and Rea, M. S. 1978. Proofreading under different levels of illumination. J
of
ZES 8:l.2. Smith, S. W. and Rea, M.S. 1982. Reading test per- formance under different levels of illumination. J of
IES 12:l.
3. Blackwell, H. R. 1970. Development of procedures and instruments for visual task evaluation.
Zlluminut-
ing Engineering
65:4.4. Kaufman,