Publisher’s version / Version de l'éditeur:
Vous avez des questions? Nous pouvons vous aider. Pour communiquer directement avec un auteur, consultez la première page de la revue dans laquelle son article a été publié afin de trouver ses coordonnées. Si vous n’arrivez pas à les repérer, communiquez avec nous à PublicationsArchive-ArchivesPublications@nrc-cnrc.gc.ca.
Questions? Contact the NRC Publications Archive team at
PublicationsArchive-ArchivesPublications@nrc-cnrc.gc.ca. If you wish to email the authors directly, please see the first page of the publication for their contact information.
https://publications-cnrc.canada.ca/fra/droits
L’accès à ce site Web et l’utilisation de son contenu sont assujettis aux conditions présentées dans le site LISEZ CES CONDITIONS ATTENTIVEMENT AVANT D’UTILISER CE SITE WEB.
ASTM Special Technical Publication, 660, pp. 211-233, 1978-12
READ THESE TERMS AND CONDITIONS CAREFULLY BEFORE USING THIS WEBSITE. https://nrc-publications.canada.ca/eng/copyright
NRC Publications Archive Record / Notice des Archives des publications du CNRC :
https://nrc-publications.canada.ca/eng/view/object/?id=ca849ef8-ef6f-4cba-86c1-269a8ca1fb08 https://publications-cnrc.canada.ca/fra/voir/objet/?id=ca849ef8-ef6f-4cba-86c1-269a8ca1fb08
NRC Publications Archive
Archives des publications du CNRC
This publication could be one of several versions: author’s original, accepted manuscript or the publisher’s version. / La version de cette publication peut être l’une des suivantes : la version prépublication de l’auteur, la version acceptée du manuscrit ou la version de l’éditeur.
Access and use of this website and the material on it are subject to the Terms and Conditions set forth at
Influence of moisture and moisture gradients on heat transfer through
porous building materials
Reprinted from
Arner~can Soc~ety for Test~ng and Materials Spec~al Techn~cal Publ~cat~on 660 December 1978. 23p
I
I' I Ser6477
1
TA1
N21dI
1National Research Council of Canada
lo. 819
20p. 2
Conseil national de recherches du Canada
mlJ*O
7
INFLUENCE OF MOISTURE AND
MOISTURE GRADIENTS ON HEAT
I~
TRANSFER THROUGH POROUS
BUILDING MATERIALS
by M. Bomberg and Shirtliffe
DBR Paper No 819 Dlvlslon of Bu~ldlng Research
Pr~ce 50 cents NRCC 17138
SOMMAIRE
La transmission de chaleur Zolala dans des rnateriaux de constructiun humtdes et poreux resulte dc nornbreux phenoMnesde transm~ssron de ctialsur Le prkssnt artlsle Zourn~! les rPsullals d'esSaS SUr la trznmiss~bn de chajeur dans des &hanillIons Y~urn~dcs de beton .- eellula~re - et
--
de panneal~x de Irbres-- - --.-
m~nbals. Les Bchani~llons de k t @ -
-
on1 eleoxposi.~ & une augmentation d~ de
I'hurnrdlt8, changmnr ains~ la 1 etC
d&el@s I ['aide de sondes ther us
On B compare les rfisr~lfots ad
r n m r r s prlsss par d'aulref cr(
p,s
Une deuxrem s&rle d'emls, Ies
en vue de dernontrer la depend - -
--
InsM . Bombergl and C . J . Shirtliffel
Influence of Moisture and Moisture
Gradients on Heat Transfer Through
Porous Building Materials
REFERENCE: Bomberg, M. and Shirtliffe, C. J., "Influence of Moisture and Mois- ture Gradients on Heat Transfer Through Porous Building Materials," Thermal Transmission Measurements of lnsularion, ASTM STP 660, R. P . Tye, Ed., Amer-
ican Society for Testing and Materials, 1978, pp. 21 1-233.
ABSTRACT: The total heat transfer through molst, porous budding materials is the sum of a number of heat-transfer phenomena. T h ~ s paper presents exper~mental data on heat transfer through specimens of moist aerated concrete and mineral fiberboard.
The ~erated concrete specimens with known initial moisture distributions were
exposed to a temperature pndicnt. T h i ~ temperature gradlent caused a red~stri- bution of moisture which in turn changed the heal flow through the materia1. The
changes were monitored by means of thermal probes, heat flowmeters, and ther- mocouples. The results o f measurements were compared w ~ t h calculations based on a simplified analy tical model and with meawrements made by other ~nvestipators.
A second series uf tests was made on a moist specimen rrf high-density m~neral fiberboard to demonstrate the extent of the dependence of the tolal thermal re- sistance on the distnbution of molsture in the matenal.
KEY WORDS: thermal conductivity, thermal resistance, heat transfer, heat trans- mission, porous material, fibrous material, glass fiber, aerated concrete, moisture, moisture gradient, moisture effects, thermal conductivity probe, heat flowmeters
The primary objective in the solving of most thermal problems is to determine the heat flow through a given material or structure. To determine the rate of heat flow through a dry, one-dimensional solid material, the
rhermal
conductivity is multiplied by the average temperature gradient.For
fibrous or porous thermal insulations. in which mdiation or convection playsa
significant role in heat transfer, the rate of heat flow is calculated by dividing the temperature difference by the thermal resistance. The heat transferred through moist materials must be calculated as the sum of a 'Research officers, National Research Council of Canada, Division of Building Research, Ottawa.2 12 THERMAL TRANSMISSION MEASUREMENTS OF INSULATION
number of components. In addition to transfer through the solid and gaseous phases of the material, heat is transferred through the liquid phase and by the movement of moisture in either the liquid or vapor phase [ I
-
31.' If evaporation and condensation occur within the material, large ex- changes of heat are involved. Thermal energy is stored or released by the solid phase and by air and also by liquid or gaseous water. The moisture is forced to move by the processes of evaporation, condensation, or cap- illary action.
Equations describing the simultaneous heat and mass transfer in porous bodies can be written, but they involve many physical properties of the material [ 4 ] . For specific boundary conditions and materials, some of the terms in these equations can be neglected. In some cases two terms can be grouped or approximated by a single term involving material charac- teristics. Few methods have been developed to measure these character- istics and, where they d o exist, many measurements are required to de- termine one set of simplified characteristics for a single material. This has limited the use of the equations, especially for thermal insulating materials. The simplified moisture flow equations have been verified for transient flows through building materials by Van der Kooi [ 5 ] , Jenisch [ 6 ] , Hens [71, Sandberg [ 8 ] , and Bomberg [ 9 ] . Investigators have had less success in using simplified equations to predict heat flow through moist materials with either known moisture gradients or known average moisture contents. This paper describes an attempt to use a particular set of simplified equations and to predict the heat flow through moist porous building materials with closed boundaries. The materials selected for study were an aerated concrete and a high-density mineral fiberboard. The aerated concrete was dense, which eliminated complicated radiation effects. It had a uniform cell structure and a high open cell content; the cell walls supported capillary action. This material represents a type of building material that is widely used in Europe and, to a lesser extent, in Canada. More important, it has been investigated extensively and many of its physical hygroscopic properties are well known. The mineral fiberboard represents a fibrous thermal insulation commonly used in roofs.
A closed system for moisture was used in tests on the two selected materials. The average moisture content of the specimens remained un- changed. Application of a thermal gradient caused redistribution of mois- ture which was initially placed in a part of the specimens. The experiment involved both a transient and a steady-state phase. Heat flow into each specimen of aerated concrete was measured with a heat flowmeter placed on the warm side. The apparent thermal conductivity3 was measured at
ZThe italic numbers in brackets refer to the list of references appended to this paper. 3The capability for heat transfer through moist, porous materials, usually obtained from measurements, is called either the apparent thermal conductivity [ l o ] or the effective thermal conductivity [11,12].
B O M B E R G A N D S H l R T L l F F E ON I N F L U E N C E O F M O I S T U R E 21 3
seven locations in this material with a double probe arrangement. Heat transfer across this material and at the seven points within it was calculated and compared with the measurements.
The dual system of measurement made it relatively simple to determine whether the discrepancies between the calculations and measurements were due to errors in the measurements or limitations in the model. The limitations of the simplified set of equations as well as the limitations of the dual probe method were illustrated by this study.
In the experiment on mineral fiberboard, two heat flowmeters were used, placed on both the cold and warm sides of the specimen.
Measurement of Simultaneous Heat and Moisture Transfer
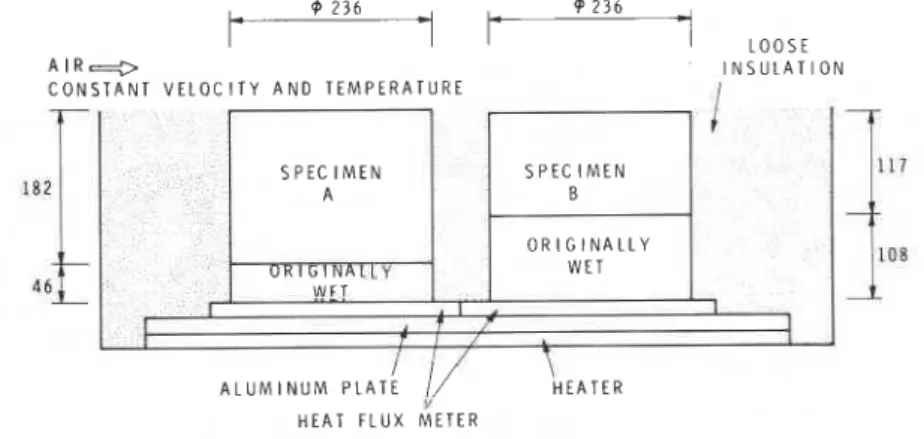
The apparatus was designed to show how redistribution of moisture influences heat transfer through a specimen of porous material. Two cy- lindrical specimens of aerated concrete were tested. Each had a slightly different level of average moisture content and initial moisture distribution, and each consisted of two layers of aerated concrete (Fig. l ) , with carefully ground surfaces ensuring good contact. The upper parts of the specimens were initially oven dry; the lower were initially water saturated. The dry and wet sections of each specimen were placed together and the assembly covered with an impermeable sealed membrane.
A temperature difference was imposed across the specimens by placing a heater under them and controlling the air temperature and heat-transfer coefficient above the top surface. The heat flow through the hot surface of each specimen was measured by an Organization for Industrial Research
t
d 2 3 61
t-
1
L O O S E d 2 3 6 AIR- C O N S T A N T V E L O C I T Y A N D T E M P E R A T U R E S P E C I M E N S P E C I M E N / N s U L A T l O N A B O R I G I N A L L Y WET 4 6,
,
O R I Z F L Y ; I,,/ ; I,
i 1 A L U M I N U M PLATE'//
H E A T E R H E A T F L U X M E T E R N O T E A l l d l m e n s l o n s a r e g l v e n I n m mFIG. 1-Test setup.
21 4 THERMAL TRANSMISSION MEASUREMENTS OF INSULATION
(TN0)-produced heat flowmeter which consisted of a thermopile imbed- ded in polyvinyl chloride. The thermopile was formed from a helical coil of constantan wire, in which half of each wire was plated with copper. The helical coil was then spirally wound to produce a circular metered area. The windings of the coil produced high conductance paths from one surface of the metered area to the other.
The temperature gradient across the specimen accelerated the moisture equalization process and increased the rate of moisture flow from the bottom to the top section. Moisture could not escape from the upper surface or the sides of the specimens a s these were sealed. Condensation therefore occurred in the cooler regions of the top section. Eventually a dynamic equilibrium was established: the flow of liquid in the downward direction counterbalanced the flow of vapor upward.
The heat flow in the specimen and through the hot and cold surfaces of the specimen was affected by the moisture redistribution process. The changes of heat flow and ability to transfer heat were measured by heat flowmeters, placed between the heater and specimens, and by the probes. Two double-line thermal conductivity probes developed by Van Minnen and Vos [13] were inserted vertically in each specimen as described later, more or less symmetrically around the axis of revolution, and sufficiently distant from each other so that measurements could be made simulta- neously without mutual interference. Each probe had two identical line sections. Thermocouples in one line section were used as temperature references. The other section acted as a line heat source for measuring the apparent thermal conductivity of the specimen at several points. The effect of the vertical temperature gradient imposed on the specimen in the testing apparatus was eliminated by this arrangement. The second set of probes was used to check the reproducibility of the measurements. The probes were inserted by drilling holes 4.5 mm in diameter through the specimens. A 4-mm glass tube was covered with adhesive and slipped into the hole. The probe, consisting of the heating wire and plastic shield (diameter 2.5 mm), was placed into the glass tube.
Owing to the small cross-sectional area of metal and glass in the probes, it was assumed that the heat flow along the probes would not introduce significant errors in the heat flowmeter measurements.
Thermocouples were placed on the sides of the specimens to measure the temperature at the surface and thus estimate the horizontal component of heat flow. Heat also flowed from the heater and aluminum plate to the surrounding insulation and then into the sides of the specimens. The net heat flow into the sides of the specimens was calculated from knowledge of the properties of this insulation. The airflow over the upper surfaces of the specimens was maintained at a temperature of approximately 25°C and a velocity of about 0.5 mls. The temperature at the lower surface depended on the average heat flow through the specimen.
BOMBERG AND SHlRTLlFFE O N INFLUENCE OF MOISTURE 21 5
The dry density of the aerated concrete averaged 650 kg/m3. The mois- ture contents of the lower sections of the specimens were 250 and 280 kg/m3 (25 and 28 percent by volume) for Specimens A and B respectively.
Tests similar to those on aerated concrete were made on a specimen of a mineral fiberboard with a density of about 160 kg/m3. The specimen, 50 mm thick and 300 mm square, had an average moisture content of 19.1 percent by weight. The specimen was enclosed in polyethylene film and placed between two heat flowmeters in a standard heat flowmeter appa- ratus to determine its apparent thermal resistance. The probes were not used in these tests because of the possibility of larger longitudinal heat flows.
Results of Tests on Aerated Concrete
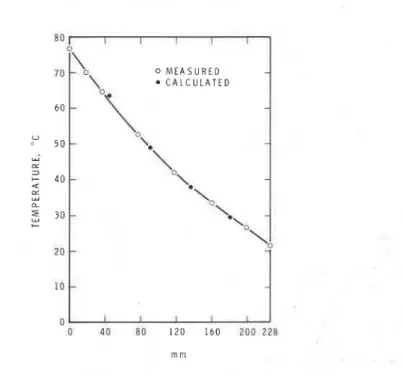
The temperature and moisture distributions in the specimens changed after the two sections were placed in the apparatus. The rate of temperature change decreased with time. During the last two weeks of the test the temperature distribution changed very little. The temperature distribution on the sides at the end of the tests is shown in Fig. 2. Each point represents the average reading for two thermocouples. The temperature profile is nonlinear because of the nonuniform moisture content.
Each specimen was assumed to be composed of nine layers of material. Layers 2 through 7 were 20 mm thick and were centered about the cor- responding thermocouple in the probe; Layers 1 in Specimens A and B were 58 and 55 mm thick, respectively, and Layer 9 was 30 mm thick. The thermocouples were off-center in each of these layers. Each ther- mocouple was assumed to measure the temperature of that layer. The readings from the thermocouples at Layers 3 and 9 were erroneous and were discarded. The thicknesses of Layers 2, 4, and 8 were adjusted to account for the missing results from Layers 3 and 9.
The resistance of each layer was calculated from the thickness divided by the apparent thermal conductivity measured for that layer by the probe. The thermal resistance, R , of the total specimen was calculated as a sum of resistances of the layers
where A, to A, were measures of the ability to transfer heat in each of the layers. Layer 1 was the layer closest to the heater.
There was a large scatter in the probe measurements during the initial stages of the tests but this decreased after a considerable portion of the moisture had redistributed. About the 12th day of the test, the thermal resistance of the specimens could be calculated with some certainty. Fig- ure 3 shows the readings from Points 1, 5, and 8 of Probe 1 in Speci- men A. Point 1 was closest to the heater. The ability to transfer heat after 12 days was already close to the final value for that section of the specimen. The measurements from Point 8, which was next to the upper surface, show that the ability to transfer heat at that section remained almost constant during the whole test. Moisture had been forced to move away from the heater and condensation occurred nearer to the cold upper sur- face. Equilibrium also developed rapidly near the upper surface. The results from Point 5 in the middle of the specimen show that the amount of heat transferred was high at the beginning but decreased during the test due to moisture redistribution.
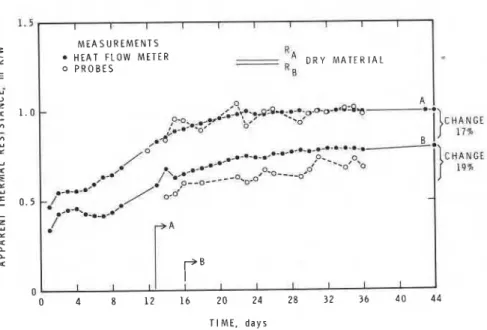
The overall thermal resistance of the specimen, calculated from the probe measurements, was comparable to the value obtained from the heat flowmeter measurements.
The total thermal resistance for Specimens A and B determined by both measuring methods is shown in Fig. 4. After about two weeks, the thermal resistance of both Specimens A and B as determined by the probe method was approximately the same as that determined with the heat flowmeter.
BOMBERG A N D SHlRTLlFFE ON INFLUENCE O F MOISTURE 21 7 PROBE 1 POINT 1 POINT 5 POINT 8 T I M E , d a y s
FIG. 3-Apparent thermal conductivity measured on aerated concrete Specimen A with Probe I . Point 1 is near the heater, Point 5 in the middle, Point 8 near the cold surface.
FIG. 4-Thermal resistance determined by the two methods on aerated concrete, Spec- imens A and B . (Results of the heatjowmeters must be corrected for edge heat gains.)
1.5 1 . 0 0 . 5 0 I I I 1 I I 1 1 I I MEASUREMENTS
HEAT FLOW METER
-
DRY MATERIAL0 PROBES 6 A
-
/~:'..s~-.<.;.-*.obo--~~% '~.:*&-- b** -0' La- H f 7 ~ L ,*a/"
,A.*r4.*--- ,.r.*.c.-.-*.a--*A+** d ?-- --o' 0 ' 0 )cti:qtGE
,
/'I..-*"
p-*o---
-*o.ro~o-o--~- .--a** - /-
/ * 4 - a * -% . . / ' / A 0 4 I 8,
12T r B l
16 20 24 28 32 36 4 0 44 T I M E , d a y sThe scatter in measurements from single points on the probes was con- siderably larger than for the measurements made by the heat flowmeters. Daily variation in the total thermal resistances determined with the probes was large; for example, a 13 percent difference was found between the averages for Days 22 and 23 of the tests. The total thermal resistance determined with the heat flowmeters varied by less than 2 percent from day to day.
Average readings at Point 7 in the two probes placed in Specimen A differed by 16 percent in the period from Day 32 to Day 40. The difference
between the two readings on any day during this period varied from 2 to
35 percent.
Each of the probe measurements was averaged over several days and the overall thermal resistance of the specimen was calculated. The av- eraged values agree reasonably well with the measurements made by the heat flowmeters.
The following were the averaged resistance values for Specimen A for the period between Days 34 and 40 of the tests
Probe 1 0.99 m2-K/W
Probe 2 1.03 m2.WW
Heat flowmeter:
uncorrected 1.00 m2.K/W
corrected 0.95 m2. WW
The overall thermal resistance for Specimen B during this period was
Average from probes 0.70 m2. K/m
Heat flowmeter:
uncorrected 0.80 m2. K/m
corrected 0.76 m2. K/m
Figure 4 shows the ratio of the difference between the surface temper- atures and the rate of heat flow at the lower surface of Specimens A and
B measured with the heat flowmeter, as a function of time. When the heat
transfer through the specimen reached a quasi-steady state, this ratio
became equal to the apparent thermal resistance. Solvason [I41 showed
that after a sudden increase in the temperature of the hot surface of a moist material, the rate of heat flow at that surface might exceed the steady-state value. This effect increases the time required to establish the quasi-steady-state condition. The heat flow rate recorded for Specimen
A reached a peak of 85.5 W/m2 on the 4th day of investigation and de-
creased to 61.6 W/m2 on the 14th day. For specimen B, it was 111.7
W/m2 on the 7th day and decreased to 84.1 W/m2 on the 14th day. (The tables of results can be obtained, on request, from the Division of Building Research, National Research Council of Canada.)
BOMBERG A N D SHIRTLIFFE ON INFLUENCE O F MOISTURE 219
Results of Tests on Mineral Fiberboard
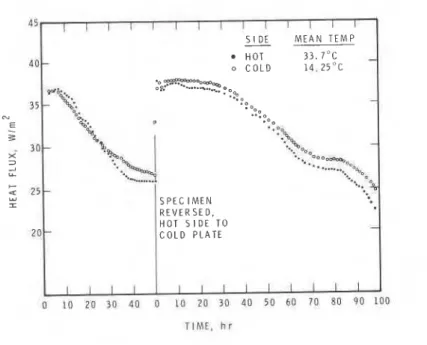
The specimen had a dry density of about 160 kg/m3 and a thermal resistance R = 1.424 m2. WW. Moisture was added to the level of 19.1 percenr by weight. that is. 30.5 kg/ml. and the specimen was enclosed in sealed polyethylene film. The specimen was then left in the laboratory for a few days to allow the moisture distribution to hecome uniform; it was then placed into the heat flowmeter apparatus and heat fluxes recorded. The results are shown in Fig. 5 and Table 1.
After most of the moisture had been moved toward the cold side of the specimen, the specimen was reversed and the cold side placed in contact with the hot plate. The heat flowmeters remained at the same positions, and the temperatures of the plates were maintained constant throughout the test.
Heat fluxes at the surfaces were disrupted, but within half an hour came as close as 10 percent to each other. Within 2 h the difference in heat flux entering and leaving the specimen was less than 1 percent. This condition in which the level of mean heat flux passing the specimen was steady persisted for a few hours.
Inexperienced laboratory personnel might call this stage an established steady state. Later measurements showed that the thermal resistance of
S l DE M E A N T E M P
-
H O T 3 3 . 7 " C o C O L D 1 4 . 2 5 " C S P E C I M E N R E V E R S E D . 7 0 C O L D P L A T E H O T S I D E T OI
T I M E , h rFIG. 5-HearJEuxes as indicated by heatJEowmeters placed on both sides of the moist,
220 THERMAL TRANSMISSION MEASUREMENTS O F INSULATION
TABLE I S e l e c t e d results from a test with a heat jlowmeter placed on each side of the rigid, high-density mineralJiberboard insulation. (Thermal resistance of the dry
specimen, R = 1.424 m2.KIW; thickness 50 m m . )
Total Thermal Time from Start of Tests Heat Flux, W / m 2 , at Surface Resistance
h min hot cold difference m2 . KIW
25 45 35.83 36.13 0.30 . .
.
27 25 36.17 36.15 -0.02 27 55 36.24 36.06 -0.22 0.447 28 25 36.16 35.98 -0.18...
51 30 28.90 29.22 0.32 52 30 28.61 29.12 0.51 0.559 71 00 25.88 26.43 0.55 71 30 25.83 26.40 0.57 0.619Hot and cold sides of the tested specimen reversed
0 00 46.47 32.47 - 14.0
. . .
0 30 39.47 35.70 -3.77...
2 00 36.29 36.94 0.65...
4 00 36.29 36.43 0.14...
8 00 36.55 37.20 0.65...
25 00 36.03 36.82 0.79 0.444 47 00 32.84 33.36 0.52 0.489 96 00 22.54 24.66 2.12 98 00 22.29 24.47 2.18 0.686the specimen varies due to changes in moisture distribution and therefore this stage is only a quasi-steady state.
During the quasi-steady state, the heat flow recorded by the meter placed on the cold side was larger than that recorded by the meter on the hot surface. The difference between the two heat flows was about 2 percent during the later part of the first day and about 10 percent at the end of the test. The reason for this increase is probably due to the effect of condensation close to the windings on the thermopiles. Other experience with heat flowmeters having metal running through the metered area in- dicates that, when heat flowmeters are placed on the cold surface, a thermal damper such as a sheet of a dry standard thermal insulation a few millimeters thick must be placed between it and the surface to break the
high-conductance paths.
I
The total thermal resistance of the high-density mineral fiberboard var- ied during the quasi-steady state. The thermal resistance at the end of the test was 50 percent higher than the value of the initial plateau. This demonstrates the extent of the dependence of the total thermal resistance on the distribution of moisture in the material.
BOMBERG AND SHlRTLlFFE O N INFLUENCE OF MOISTURE 221
Calculations of Simultaneous Heat and Moisture Transfer
The calculation of moisture flow due to a temperature gradient and heat flow due to a moisture gradient is discussed elsewhere [15, 161. The fol-
lowing set of equations for heat and moisture flow, each being the sum of a moisture gradient and a temperature gradient term, were derived
where
qe = rate of heat flow, W/m2, q m = rate of moisture flow, kg/m2s,
T = temperature, K,
pc = capillary suction, Pa,
A = thermal conductivity, W/(mK),
k = moisture conductivity, s,
KT = moisture conductivity due to temperature gradient, kg/(m.K.s), and
Am = heat conductivity due to moisture gradient, J.s/(kgm). Transport coefficients in Eqs 1 and 2 hold the following relations to the phenomenological coefficients used in the theory of irreversible thermodynamics
where p is the pore-water density in kglm3.
Onsager's reciprocal relation for the transport coefficient states that LmQ
= LQm. This allows calculation of the Am-coefficient from the K T when all other gradients and transport coefficients are known.
The term describing the energy flow due to a moisture gradient was calculated and its magnitude shown to be negligible under the conditions of these tests.
The computer program used for the calculation of moisture transport in porous materials has been described by Bomberg [ 9 ] . The temperature field was calculated from a heat flow model in which the thermal capacity effects were neglected. The calculated temperature gradients were used as driving forces in calculating the moisture flow, which was made using a transient-state flow model.
Eliminating the thermal capacitance from the heat-transfer calculations resulted in a rapid establishment of the final temperature gradient for given steady boundary conditions. As a result, the calculated moisture flows
222 THERMAL TRANSMISSION MEASUREMENTS OF INSULATION
I
should be somewhat greater than the actual moisture flows. The errors in the calculation of moisture movement caused by neglecting the short- term temperature gradients were found by Sandberg [8] to be negligible. Other researchers [5, 171 have also used this simplification with success. In general, this means that it is the difference in temperature between the two boundaries that has the major effect on the local moisture and thermal flows.
Heat flow and moisture transport in a porous body can be calculated only if the approximate dependence of the material properties on the moisture content is known. The thermodynamic potential for moisture, the moisture conductivity, and the apparent thermal conductivity must be known for all values of moisture content. The material characteristics of aerated concrete used for the computer calculation are discussed in the Appendix.
Comparison of Calculations with Measurements (Aerated Concrete) The temperature gradient in the thermal insulation surrounding the tested specimens was almost linear. The temperature gradient measured at the side of the specimens was nonlinear because the apparent thermal conductivity varied from point to point in the concrete. The difference in gradients caused an exchange of heat between the specimens and the surrounding insulation. The heat flows through the side of the cylinder and the temperature gradient were computed with the finite-element pro- gram described by Konrad and Silvester [18]. Figure 2 shows that there was good agreement between the calculated and measured temperature gradients. The effect of lateral heat flow on the heat flow through the hot surface of the specimens was calculated and this value was used to correct the measurements of the steady-state flux through the hot surface obtained with the heat flowmeters. The correction for Specimen A was only 5.6 percent (any error in this estimate would be of second-order magnitude).
The distribution of moisture in the specimens was measured at the beginning and end of the test series and was also calculated with the program. Figure 6 shows that there is good agreement between the meas- ured and calculated distribution of moisture content at the end of the test. EC.ch point in the figure represents the mean of four measurements. The apparent thermal conductivity measured by the two probes in the spec- imens is also plotted in Fig. 6. The curve has the same shape a s the curve for moisture content.
The main components of heat and moisture transfer in Specimen A determined with the computer program are given in Table 2. The results given for ten equal layers, different from those assumed in the probe measurements, are
BOMBERG AND SHlRTLlFFE ON INFLUENCE O F MOISTURE 223
i
FIG. 6-Measured and calculated moisture content distribution in aerated concrete Spec- m mI
imen A and the apparent thermal conductivity measured with the two probes at the jinalstages of the tests.
2. apparent thermal conductivity calculated for the specified mean moisture content and the moisture gradient.
3. apparent thermal conductivity calculated for the specified mean moisture content and no gradient of moisture, and
4. mean moisture content of the layer.
The quantity of heat transported by moisture flow can be significant when heat is extracted from one place, carried through a significant dis- tance, then released. Table 2 and Fig. 7 give the results of the calculations for the quantity of heat transported by moisture flow. In the 4th layer, the heat flow caused by the moisture content gradient alone during the 1st day was about 30 percent of the heat flow during the steady state. The flow decreased rapidly and in the later stage of the test was in the opposite direction. In the final stage of the measurements, the heat flow caused by the moisture gradient in Layers 7 and 8 was about 10 percent of the level measured with the heat flowmeter placed at the surface. These flows occur only within a narrow portion of the material and do not cause significant errors in the calculation of the overall thermal resistance. The difference between the local apparent thermal conductivities was slight, whether moisture gradients had been taken into account in calculations or not, and the total thermal resistance may be calculated without regard to heat flow caused by moisture gradients.
TABLE Z-Calculated properties: (a) Heat jlux due to moisture content gradients, (b) apparent thermal conductivity, ( c ) apparent thermal conductivity in absence of the moisture gradient, and ( d ) mean moisture content for consecutive layers.
1 a W/m2 0.0 0.1 0.3 16.0 0.5 0.0 0.0 0.0 0.0 -0.1 b W/(m.K) 0.387 0.362 0.230 0.189 0.180 0.180 0.180 0.180 0.180 0.182 c W/(m.K) 0.372 0.352 0.306 0.200 0.186 0.182 0.182 0.182 0.184 0.189 d kg/m3 175 158 118 21 8 4 4 4 5 10 3 a w/m2 0.0 0.1 0.2 7.8 5.4 0.3 0.0 -0.1 -0.6 -1.0 b W/(m.K) 0.345 0.331 0.294 0.181 0.175 0.183 0.182 0.183 0.188 0.198 d kg/m3 150 138 108 39 14 9 7 8 12 22 5 a w/m2 0.1 0.1 0.2 4.1 7.4 0.3 -0.1 -0.4 -1.4 -3.9 b W/(m.K) 0.327 0.313 0.283 0.205 0.167 0.186 0.186 0.190 0.200 0.221 d k g 3 135 124 99 45 15 11 11 13 20 34 7 a w/m2 0.1 0.1 0.3 3.6 8.5 0.3 -0.2 -0.8 -2.4 -7.9 b W/(;.K) 0.313 0.301 0.273 0.210 0.165 0.188 0.189 0.185 0.209 0.259 d kg/m 123 113 90 46 16 13 14 17 26 48 13 a w/m2 0.1 0.3 0.6 7.6 5.6 0.1 -0.7 -2.5 -6.1 -4.4 b W/(m.K) 0.281 0.267 0.242 0.188 0.176 0.194 0.198 0.215 0.246 0.305 d kg/m3 95 85 63 32 21 18 20 27 42 104 I5 a w/m2 0.1 0.2 1.5 10.6 2.0 0.2 -1.2 -2.9 -6.4 -3.4 b W/(y.K) 0.270 0.258 0.230 0.171 0.187 0.194 0.202 0.219 0.251 0.329 d kg/m 87 76 55 26 21 20 22 29 46 127 I 1 a w/m2 -0.1 2.2 7.7 3.9 0.2 -0.7 -1.6 -5.4 -5.6 -1.0 b W/(m.K) 0.241 0.221 0.183 0.181 0.194 0.199 0.207 0.238 0.277 0.373 d kg/m3 60 49 28 21 19 20 26 37 71 177 28 a w/m2 1.7 0.2 0.5 -0.2 -0.2 -1.1 -3.4 -6.2 3 8 -0.3 b W/(m.K) 0.194 0.193 0.192 0.192 0.195 0.199 0.219 0.249 0.319 0.413 d kg/m3 20 18 17 16 17 21 28 44 117 208 35 a w/m2 0.9 -0.1 -0.4 -0.4 -0.9 -1.7 -5.6 -6.2 -1.3 -0.1 b W/(m.K) 0.181 0.185 0.188 0.190 0.196 0.205 0.236 0.271 0.352 0.379 d kg/m3 8 9 10 12 16 22 34 62 152 181 a4 a w/m2 0.6 -0.3 -0.1 -0.5 -0.9 -1.7 -6.4 -5.8 -0.9 -0.1 b W/(m.K) 0.180 0.185 0.185 0.190 0.196 0.205 0.243 0.278 0.349 0.372 c W/(m.K) 0.185 0.185 0.188 0.191 0.195 0.202 0.238 0.252 0.345 0.376 d k g 3 7 7 9 12 16 23 36 69 152 177 - . I.aycrr 1 2 3 4 5 6 7 8 9 10 Calollatcd Property Iynlt Urn? Designation
20 I I I I I 1 1 1 I
N
E D A Y O F C A L C U L A T I O N
FIG. 7--Calculated distribution of the heat flows due to moisture gradient in aerated
concrete Specimen A .
The heat flow caused by transient moisture flows may result in significant errors in values of the apparent thermal resistance measured by heat flowmeters placed next to the condensation zone [19]. It will not cause errors in the measurements made by the heat flowmeters placed on the hot side of the specimen. After a sudden temperature change, however, the heat flux measured at the hot surface may greatly exceed the heat flux that would occur under steady-state conditions. In these tests the heat flux measured by the heat flowmeter placed at the hot surface did not equal the average value of heat flux through the specimen during the first two weeks.
Prediction of Heat Flow Through a Porous Material with Known Moisture Distribution
1
In calculating the heat flow during the period of quasi-steady state, the flow of moisture through a closed system can be disregarded. The presence of moisture increases the heat conduction in the specimen. The equation for heat flow can be approximated by the first term of Eq 1 for q, and an apparent thermal conductivity can be used to calculate heat flow.Figure 8 illustrates a simple model of the interactions between the different modes of conductive heat transfer in a porous body based on
226 T H E R M A L T R A N S M I S S I O N M E A S U R E M E N T S O F I N S U L A T I O N
T
I
G A S C O N D U C T I V I T Y h a S O L I D C O N D U C T I V I T Y M O L E C U L A R G A S C O N D U C T I V I T Y V A P O U R D I F F U S I O N L I Q U I D W I T H M A T E R I A L W I T H S O L 1 D E N T R A P P E D C O N D U C T I V I T Y A I R B U ~~ ~ F ~ ~ / { ~ ~ ~ ~
~ ~ ~" ~ I I L l O U l D C O N D U C T I V I T YFIG. 8-Model of interaction of different modes of conductive heat transfer in a porous body.
work of Verschoor and Greebler [20], Krischer 1211, Pelanne [221, and Bankvall [23]. Heat can be conducted either in a single phase, or it can be transferred from one phase to another and back again-for example, from the solid phase to the pore air and back to solid phase. Simple apparent thermal conductivities can be used to describe the flow of heat
1. conducted through the solid phase only,
2. conducted through the continuous gas phase only, or 3. conducted through the continuous liquid phase only.
"Composite" thermal conductivities can be used to describe the heat 1. transferred from the solid to the gas phase and back to the solid phase, or
2. transferred from the solid to the liquid phase and back to the solid phase.
The thermal conductivity of the gas phase is the sum of the apparent gas conductivity and the energy that is transferred by the diffusion of water vapor.
The thermal conductivity of the liquid phase can be treated as a sum of series and parallel paths. Heat will be transferred both through a water film adsorbed by the pore walls and a series-transport through the en- trapped air bubbles. It can flow from the liquid phase to the gas phase and back to the liquid phase. The contribution of the absorbed and ad- sorbed water to the transfer of heat depends on the moisture content of the material. The heat flow occurs through both liquid and solid; that is,
a "composite" solid and liquid heat transfer mechanism occurs. The apparent thermal conductivity of the aerated concrete was calculated using such models. A series model was used to calculate the thermal conductivity of that portion of the material with a continuous gas phase; that is
Acg = A,
.
A,/ [A, E+
A, (1 - E)] (3)Using a total open porosity, E, of 0.70, an air conductivity A, = 0.026
W/(m- K), and
a solid phase conductivity
As
= 2.5 W/(m. K), yields a ACgof 0.037 W/(m.K). Equation 3 does not include effects of evaporation, diffusion, and condensation on the thermal conductivity of air [12].
The calculated thermal conductivity will be low for the range of moisture contents where phase changes play an important role in the total moisture transfer. The quantity of heat transferred through the air phase is negligible even though the porosity of the aerated concrete is 70 percent. The dif- ference between the measured thermal conductivity of a dry material and the series conductivity of that portion of the material containing the con- tinuous air phase is the solid-phase conductivity
= 0.037 W/(m. K), Ac"
bry
- ACg = 0.139 W/(m .K)The solid phase conductivity is not influenced by the moisture content. The effect of the moisture can be added to the series conductivity by using the conductivity of the air-water mixture for the gas conductivity. The thermal conductivity of the continuous water phase with entrapped air bubbles can be calculated using Maxwell's model [241
where
Am = conductivity of the mixture,
A,, Ad = conductivity of continuous and disperse phases, respectively,
and Pd = volume fraction of the disperse phase.
The following example will illustrate how this formula can be used in calculations for an aerated concrete with the following properties: moisture
content, w = 180 kg/m3 (18 percent by volume); total porosity, E = 0.70;
and degree of saturation, S = 0.257 (P, is 0.743). The thermal conductivity
of the continuous water phase with a disperse air phase becomes Am =
Acw = 0.132 W/(m. K).
The apparent thermal conductivity of the system can be calculated from
or substituting in Eq 6
228 THERMAL TRANSMISSION MEASUREMENTS O F INSULATION
The results of the calculations for Specimen B are given in Table 3a. The corrected value of the total thermal resistance of the specimen de- termined by the heat flowmeter was 0.76 m2-KIW. The probe measure- ments gave a thermal resistance about 8 percent lower. The thermal re- sistance determined from the calculated apparent thermal conductivity was about 8 percent higher (Table 36).
The model of apparent thermal conductivity used in these calculations does not accurately describe the moisture-air interaction. The effects of evaporation, diffusion, and condensation have also been neglected. As a result, the calculated thermal resistance is somewhat higher than it should be, but even this crude model gives an accuracy comparable to the measurements made by the probe. More refined computational models could be used for apparent thermal conductivity determination and would doubtless give even better results.
TABLE 3a-Thermal resistance of Specimen B calculated on the basis of measured moisture content distribution and calculated apparent thermal conductivity.
Layer, mm Moisturea Content, kg/m3 Thermal Resistance, m2 K/W Total 0.82
'"Moisture content 1 percent by volume = 10 kg/m3.
TABLE 3b-Thermal resistance of Specimen B determined by different methods.
Total Ratio to
Resistance Corrected HFMa
Calculated (Table 3a) 0.82
Probe measurements 0.70
Heat flowmeter 0.80
measurements
Corrected heat flowmeter 0.76
measurements "Heat flow measurements.
BOMBERG A N D SHlRTLlFFE ON INFLUENCE O F MOISTURE 229
The computational model developed has been used also to calculate the thermal resistance of the aerated concrete under the same conditions as were found in measurements made by Kiinzel[25]. H e measured a thermal conductivity of 0.14 W/(m. K) for dry aerated concrete and 0.74 W/(m. K) for the same material with a moisture content of 820 kg/m3. Measurements by Kiinzel showed that the thermal conductivity of the material increased linearly with the moisture content and that a t a moisture content of 160
kg/& the thermal conductivity was 0.24 Wl(m-K). Using Eqs 3-6, an apparent thermal conductivity. A,,, = 0.78 WI(m+
K)
was calculated fora moisture content of 820 kg/m3 and a value of A,, = 0.24 W/(m-K) for
a moisture content of 160 kglm3. The difference between the measured and calculated values is 5.4 and 0 percent, respectively. these values further validate these equations.
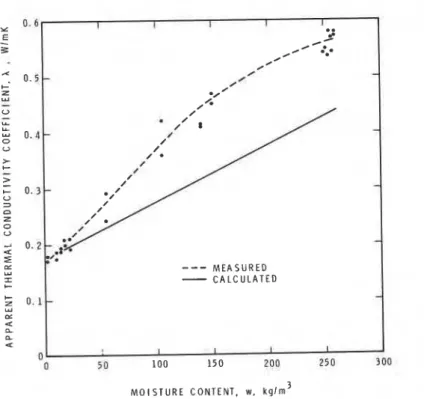
The apparent thermal conductivity of the aerated concrete used in this test was calculated with Eq 6 and is plotted versus moisture content in Fig. 9. The results of the probe measurements are also shown. The ac- curacy of the probe measurement is good at low moisture contents but poor a t high moisture contents.
MOISTURE C O N T E N T , w , k g l r n 3
FIG. 9--Comparison of apparent thermal conductivities measured with the probe tech- nique with calculafed values.
230 THERMAL TRANSMISSION MEASUREMENTS OF INSULATION
Conclusions
A number of conclusions regarding the effects of moisture on heat
transfer in a closed system can be made. The heat flows due to moisture gradients are significant during the initial stages of the moisture redistri- bution process. When moisture is prevented from leaving the material, condensation will usually occur at the colder surfaces. The vapor that is transferred to and condenses in this region carries heat with it. This reduces the temperature gradient through a part of the specimen during the moisture redistribution process and thereby temporarily reduces the heat conduction component of the total heat flow.
Increasing the moisture content increases the time required to reach the quasi-steady-state condition, that is, the condition where heat flow meas- ured at the hot surface would equal the mean heat flow through the spec- imen. Only after the quasi-steady state in heat flow is reached do the measurements from both the heat flowmeters and probes give values of the average heat flow through the specimen and therefore of the average apparent thermal conductivity. The results show that under quasi-steady- state conditions the net effect of the moisture gradient on heat transfer through a closed system becomes negligible, and that the total thermal resistance depends on the distribution of moisture in the material. Changes in the total thermal resistance of aerated concrete as large as 19 percent occurred between Day 13 and Day 44 for Specimen A and between Day
16 and Day 44 for Specimen B because of the moisture redistribution.
Measurements taken during this period using both techniques agreed rea- sonably well.
The apparent thermal conductivity of moist aerated concrete can be calculated on the basis of the interactions of different modes of heat transfer and material structure to an accuracy comparable with that ob- tained with current measurement techniques. Such calculations require the knowledge and use of material properties that are not usually measured by material manufacturers.
The apparent thermal conductivity indicated by the probe changes with the magnitude of the temperature and moisture gradients in the material surrounding the probe. When used in the normal manner, probes are not an accurate means of measuring apparent thermal conductivity when large thermal and moisture gradients are present. The conclusions of this study are in agreement with those of Joy [ 2 6 ] .
The observations made from this study are valid only for aerated con- crete and mineral fiberboard, the materials tested. Aerated concrete was specifically chosen for investigation since it had one of the worst com- binations of factors influencing the time to establish quasi-steady-state conditions. The material is dense, has a high open micropore and macro- pore content, and a high capability for capillary liquid transport to coun- teract the moisture transported in the vapor phase.
Acknowledgments
The authors wish to express their appreciation to Dr. Bob H. Vos of the Institute for Building Materials and Building Structures, the Organi- zation for Industrial Research (TNO) in Rijswijk, Holland, who initiated and acted as consultant on the series of tests discussed in this paper. They were performed by M. Bomberg when he held a fellowship at the TNO laboratory in 1967. Thanks are also accorded to Dr. Charles P. Hedlin for comments and discussions of the problem and to Dr. A. (Bela) Konrad who modified one of his element computer programs to make it applicable to this research.
This paper is a contribution from the Division of Building Research, National Research Council of Canada, and is published with the approval of the director of the Division.
APPENDIX
Hygrothermal Characteristics of Aerated Concrete
The following material properties were used in the calculations:
I . The moisture retention curve, which describes the variation of thermody- namic moisture potential with moisture content, was taken from Van der Kooi [5] for equilibria conditions below 98 percent and from Bomberg [9] for equilibria at higher moisture contents.
2. The moisture diffusivity curve, which describes the variation of the dynamic transport coefficient for moisture flow within a porous body, was derived from two sources: The isothermal moisture diffusivity curve was taken from the drying experiments of Van der Kooi [S]. This curve is discussed by Nielsen [17]. The thermal moisture diffusivity was assumed constant at 0.32 x kg/(m.s.K) when the moisture content was between 20 and 260 kg/m3. At moisture contents below and above this region, it decreased to a nonsignificant level. (A detailed discussion is included in Ref 9,)
3. The thermal conductivity for the dry material was assumed to be 0.176 W/(m.K). The apparent thermal conductivity of the wet material was calculated using a series and parallel heat flow model of the air, water, and solid phases. A term was added to account for the energy flow due to the moisture gradient. The following values were used in the calculations of the dry and wet thermal conductivities:
A, = 2.5 W/(m.K) for solid phase of the material
A, = 0.026 W/(m. K) for moist air in pores, that is, the gaseous phase
A, = 0.58 W/(m K) for water, that is, the liquid phase
The average density of the material was 650 kg/m3; the total open porosity was not measured but could safely be assumed to be 70 percent.
Hygrothermal properties of aerated concrete have been reported by Sandberg [81, Vos [27], Lund-Hansen [28], Nicolajsen [29], and Kiinzel [30,31]. Paljak [32] measured the apparent thermal conductivity of moist materials by transient and steady-state methods.
References
[ I ] Hutcheon, N,B. and Paxton, J.A., Heating, Piping and Air Conditioning, April 1952,
pp. 113-121.
[2] Kuzmak, J.M. and Sereda, P.J., Soil Science, Vol. 84, No. 4, 1957, pp. 291-299, and
NO, 5, 1957, pp. 419-422.
[31 Woodside, W. and Kuzmak, J.M., Transactions, American Geophysical Union, Vol. 39, No. 4, 1958, pp. 676-680.
[41 Comini, G. and del Giudice, S., "Finite Element Analysis of Heat and Mass Transfer
in Buildings," International Centre for Heat and Mass Transfer, Dubrovnik, Yugoslavia, Session 1 , 29 A u g . 3 Sept. 1977.
[5] Van der Kooi, J., "Moisture Transport in Cellular Concrete Roofs," Ph.D. Thesis,
Delft University, Wahlman, Delft, The Netherlands, 1971,
[6] Jenisch, R., "Beitrag zum Problem der wasserdampfdiffusion durch Aussenwande von
Gebauden (Kondensations- und Austrockgungs-verhaltnissc abhangig vom Aussenk- lima)," On the Problem of Water Vapor Diffusion Through Exterior Building Partitions (Condensati~n and Drying Behaviour in Relation to the Outdoor Climate), Ph.D. Thesis. University of Stuttgart , West Germany, 1970.
[7l Hens, H., "Teoretische en Experimentele Studie van het Hygrotermisch Gedrag van bouw- an Isolatiematerialen
. .
." (Theoretical and Experimental Study of the Hy- grothermal Behavior of Building and Thermal Insulating Materials in Internal Conden- sation and Drying Processes with Application to Flat Roofs), Ph.D. Thesis, University of Leuven (KUL), 1976. (A detailed summary, in English, regarding condensation problems, is obtainable from the Laboratory for Acoustics and Heat Transfer, KUL, Leuven, Belgium.)[8] Sandberg, P.I., "Byggdelars Fuktbalans i Naturligt Klimat (Moisture Balance in Build-
ing Elements Exposed to Natural Climatic Conditions)," Report 43, Division of Building Technology, Lund Institute of Technology, Sweden, 1973.
[9] Bomberg, M., "Moisture Flow Through Porous Building Materials," Report 52, Di-
vision of Building Technology, Lund Institute of Technology, Lund, Sweden, 1974.
[ l o ] Harrnathy, T.Z., I & EC Fundamentals, Vol. 8, No. 1 , Feb. 1969, pp. 92-103.
[ I l l Palosaari, S.M., "Steady State Effective Thermal Conductivity of Wetted Closed Po-
rous Systems," Ph.D. Thesis, London University, Department of Chemical Engi- neering, Imperial College of Science and Technology, London, 1972.
[I21 Palosaari, S .M. and Cornish, A.R.H., Acta Polytechnica Scandinavica , Helsinki, Chap-
ter 125, 1975, pp. 1-34; Chapter 126, 1975, pp. 1-24; and Chapter 128, 1975, pp. 1-38.
[I31 Van Minnen, J. and Vos, B.H., "Determination of Water Content, Water Distribution
and Heat Resistance of Walls," Report 11-4123N5, Organization for Industrial Research, Institute for Building Materials and Building Structures, Delft, The Netherlands, 1965.
[I41 Solvason, K.R., ASHAE Journal, Section, Heating, Piping and Air Conditionifig,
American Society of Heating and Air Conditioning Engineers, Vol. 27, No. 1 1 , 1955, pp. 137-142.
[I51 de Groot, S.R., International Journal of Heat and Mass Transfer, Vol. 4, 1961, pp. 63 -70.
[I61 Cary, J.W. and Taylor, S.J., in Proceedings, Soil Science Society of America, 1862,
pp. 413-416.
[I71 Nielsen, A. F., "Fugtfordelinger i Gasbetong under Varme- og Fugttranspoyt" (Moisture
Distribution in Cellular Concrete During Heat and Moisture Transfer), Meddelelse, No.
29, Thermal Insulation Laboratory, Technical University of Denmark, 1974.
[I81 Konrad, A. and Silvester, P., in Computer Physics Communications 5 , North Holland
Publishing Co., 1973, pp. 437-455.
[I91 Samuelsson, I . , "Fukt: Utvandigt Isolerade Plottak" (Moisture Transfer in Steel
Decks), Report 67, Division of Building Technology, Lund I n s t i t ~ t e of Technology, Sweden, 1975.
[20] Verschoor, J.D. and Greebler, P., Transactions, American Society of Meckmic;ll ER-
gineers, Vol. 74, No. 6, Aug. 1952, pp. 961-968.
[211 Krischer, O., Die Wissenschafrlichen Grundlagen der Trocknungtechgik (The Scientific
BOMBERG AND SHlRTLlFFE ON INFLUENCE OF MOISTURE 233
[22] Pelanne, C.M., in Proceedings, Eighth Conference on Thermal Conductivity, Plenum Press, New York, 1969, pp. 897-911.
1231 Bankvall, C.G., Journal of Testing and Evaluation, Vol. 1, No. 3, May 1973, pp. 235- 243.
[24] Cbeng, S.C. and Vachon, R.I., International Journal of Heat and Mass Transfer, Vol. 13, 1970, pp. 537-546.
1251 Kiinzel, H., "The Dependence of Thermal Conductivity on Moisture Content," Com- munication to CIB W-40 Working Group, Institute fur Technische Physik, Stuttgart, West Germany, 1969.
1261 Joy, F.A. in Symposium on Thermal Conductivity Measurements and Applications of Thermal Insulations, ASTM STP 217, American Society for Testing and Materials,
1957. pp. 66-79,
1271 Vos, B.A.. Geslrndhei!a-ltigenieitr. Vol. 1 1, 1969, pp. 334-342.
1281 Lund-Hansen. P.. "Fugttransport i Byg&materialerV (Moisture Transfer in Building Materials). Meddelelse
.
No. 25. Technical University of Denmark. 1%7.[29] Nicolajsen, A.. "Fugttransportkoefficienter for Gasbeton" (Moisture Transfer Cuef- ficients of Cellular Concrete), Medilelelse. No. 25. Thermal Insulation Laboratory. Technical University of Denmark, 1973.
[30] Kiinzel, H., Gasbeton, Warme- und Feuchtigkeitsverhalten (Aerated Concrete, Heat and Moisture Aspects), Bauverlag GmbH, Wiesbaden and Berlin, 1971.
1311 Schiile, W. et al, Gesundheits-Ingenieur, 112 Jan./Feb. 1976, pp. 17-18, 23-26. 1321 Paljak, I., Swedish Journal of Building Technology, No. 6, 1973, pp. 20-22.