READ THESE TERMS AND CONDITIONS CAREFULLY BEFORE USING THIS WEBSITE. https://nrc-publications.canada.ca/eng/copyright
Vous avez des questions? Nous pouvons vous aider. Pour communiquer directement avec un auteur, consultez la première page de la revue dans laquelle son article a été publié afin de trouver ses coordonnées. Si vous n’arrivez pas à les repérer, communiquez avec nous à [email protected].
Questions? Contact the NRC Publications Archive team at
[email protected]. If you wish to email the authors directly, please see the first page of the publication for their contact information.
NRC Publications Archive
Archives des publications du CNRC
This publication could be one of several versions: author’s original, accepted manuscript or the publisher’s version. / La version de cette publication peut être l’une des suivantes : la version prépublication de l’auteur, la version acceptée du manuscrit ou la version de l’éditeur.
Access and use of this website and the material on it are subject to the Terms and Conditions set forth at
Long-term settlements on sensitive clay
Crawford, C. B.; Burn, K. N.
https://publications-cnrc.canada.ca/fra/droits
L’accès à ce site Web et l’utilisation de son contenu sont assujettis aux conditions présentées dans le site
LISEZ CES CONDITIONS ATTENTIVEMENT AVANT D’UTILISER CE SITE WEB.
NRC Publications Record / Notice d'Archives des publications de CNRC:
https://nrc-publications.canada.ca/eng/view/object/?id=6398f0e0-990b-40c7-8f2e-8b8ad32e7d12 https://publications-cnrc.canada.ca/fra/voir/objet/?id=6398f0e0-990b-40c7-8f2e-8b8ad32e7d12Un bgtiment trss lgger d'un Stage reposant sur un remblai granulaire sur une argile 16gPrement surconsolidde s'est enfonc6 d'approximativement 0.3 mStres depuis sa construc- tion il y a vingt ans. Des observations du tassement en fonction du temps suggsrent que la consolidation dans le sous-sol est presque terminde. Des mesures piszom6triques indiquent que les contraintes rgelles dans la couche comprimable sous le bgtiment ont atteint un niveau de seuil environ Ggal 5 la pression mesurge dans le labora- toire avant la consolidation et s'est maintenue 5 une valeur constante pendant plusieurs annges alors que la consolidation continuait. Cette observation s'avsre consgquente avec quelque autres cas 00 les contraintes rEelles sur place avaient 6t6 mises en rapport avec des mesures de compression en laboratoire. Cette observation soutient le concept que les pressions interstitielles sont produites par l'affaissement de la structure de l'argile 1
une vitesse Gquivalente 5 la vitesse de dissipation de la pression interstitiekle par drainage.
Long-Term Settlements
on
Sensitive Clay
BY
C. B. Crawford
Director, Division of Building Research. National Research Council of Canada, Ottawa and
K. N. Burn
Research Officer. Geotechnical ~ e c d i n , Division of Building Research, National Research Council of Canada, Ottawa
Synopsis
A very light, single-storey building resting on a granular fill over slightly over-consolidated sensitive clay has settled approxi- mately 0.3 metres s i n e it was built 20 yean ago. Time-settlement observations suggest that the consolidation in the subsoil is almost completed. Piezometric measurements indicate that the effective stresses in the compressible layer under the building reached a threshold level about equal to the laboratory-measured preconsolidation pressure, and remained at an almost con- stant value for many years while consolidation continued. This observation is shown to be consistent with several other case records where effective stresses in the field have been related t o laboratory measurements of compression. It provides further support for the concept that pore pressures are generated by the collapsing clay structure at a rate equivalent to the rate of pore pressure dissipation by drainage.
Laurits Bjerrum took a special interest in all efforts to observe the full-scale performance of structures in re- lation to laboratory tests. The authors have therefore chosen, as a contribution to this special memorial volume, to describe a long-term case record of settlement observ- ations and to compare it with several other similar observations of foundations on soft, sensitive clays.
Bjermm also took a general interest in the properties of sensitive Canadian clays, noting their similarities to and differences from Scandinavian clays. In his com- prehensive report on soft clays for the Eighth Inter- national Conference on Soil Mechanics and Foundation Engineering, Bjerrum (1973) described "two significant differences between the two types of clays: (1) the cohesive bonds in the Canadian clays are more resistant against a disturbance than those in a non-cemented clay with the same plasticity, and (2) the over-consolidated Canadian clays, have during the unloading retained the strength and the preconsolidation pressure gained under the maximum load to a degree which is unknown in a comparable non-cemented clay". He attributed the cohesive bonds to a uniform 'smear' of precipitated cal- cium carbonate on the surface of the mineral particles. The bending has also been attributed to the formation of hydrous and anhydrous oxides of iron, aluminum and manganese a t points of particle-to-particle contact (Sangrey, 1972).
Although there may be uncertainty with respect to the exact nature of the bonds, there is no doubt about their existence and importance. Their influence on the interpretation of laboratory test results is well r w n i z e d , but their influence on field performance is not so well
known or appreciated. This is understandable because of the long time required to gather a significant number of field observations, but such observations are essential to the development of improved engineering analyses.
Character of the clay
The sensitive clays of the Ottawa area are similar to those that occur widely throughout the St. Lawrence and Ottawa River valleys. These clays are generally called Leda clays or Champlain Sea sediments although they are sometimes referred t o by local geographical names. Their geological history, composition, structure and engi- neering characteristics have been reviewed (Crawford, 1968). Test results from several sites in and around the City of Ottawa (Crawford and Eden, 1965) shew that the degree of overwnsolidation is generally related to the surface elevation of the site; clays at a high elevation are almost n o d l y consolidated and those a t lower elev- ations may be overconsolidated up to about 4 kglcm2. Owing to this variation in overconsolidation, it is pos- sible to apply heavy loads at some sites without causing much settlement, but a t other sites application of a small load will cause large movements. Although it is not certain that the measured preconsolidation pressures are due entirely to their geological stress history, there is sufficient evidence to suggest that this is a major factor. The case record described in this paper involves a uni- form loading just a little greater than the measured pre- consolidation pressure of the subsoil.
Fig. 1 . Aerial view of Accommodation Block (A) and test fill (B) at CFS Gloucester.
Observations on CFS Gloucester accommodation block
A single-storey Accommodation Block was built at the Canadian Forces Station (CFS) Gloucester, near Ottawa, in 1954. The site is a flat, poorly drained area consisting of about 18 m of marine clay. The building is L-shaped, approximately 90 m long in one direction and 45 m long in the other. The aerial view of Fig. 1 shows the building (A) as well as a special test fill (B) that was placed in 1967 and described by Bozozuk and Leonards (1972). The single-storey building is of very light construction, weigh- ing on the average about 0.02 kglcm2 (including live load). T o provide proper drainage the concrete floor slab was placed on a gravel fill 1.4 m higher than the original ground surface thus adding another 0.34 kg/cm2 to the
load on the subsoil. The initial load of 0.36 kgIcm2 has decreased t o 0.32 kg/cm2 due to settlement of part of the fill below the groundwater table. A cross-section through the building and its foundations is shown in Fig. 2.
The method and sequence of construction was as fol- lows. In August 1954 the surface soil was removed to a depth of about 1 m and footings were placed (Fig. 2).
Through September and October foundation walls and piers were built and the space between filled with sand and gravel. This was topped with 20 cm of crushed stone and a 7.5-cm rough concrete floor slab. The light steel and wood framing was erected during November and the building was closed in by mid-December. A further layer of concrete, 7.5 cm thick, was then added to the floor slab, interior partitions installed and the floor tiled
-
P O
-
-
I5 m b 8 8 --
a 6-
-
WEST 15 c m CONCRETE EAST u rr 8 4-
C u - C R l G l N A L C u u L 4 8 0-
u u 7 8-
-
COMPRESSIBLE LAYER 76-
-
7 4-
I +. a. - u 0Fig. 3. Total settlement contours (a), October 1973.
before the first level survey was conducted on 3rd March 1955.
Level surveys referenced to a deep benchmark have been carried out periodically since 1955 on pins set around the outside of the foundation wall and in the sur- face of the concrete floor slab. In October 1973 level readings were made on all accessible pins and also on a close grid over the entire floor area of the long wing. From these measurements the contours of settlement shown in Fig. 3 were drawn. The solid dots indicate points on the 1973 grid survey; the open circles represent permanent survey points.
Settlement curves for typical observation points are shown on an arithmetic time base in Fig. 4. These curves include an allowance of 3 cm for consolidation during the loading period, a value estimated by back extrapol- ation. Following the observations and calculations of Bozozuk and Leonards (1972) it was estimated that 2 cm of immediate settlement occurred under the building (also shown in Fig. 4). The curves in Fig. 4 have been extended by estimation to 40 years; this extension is included in the semi-log plot of Fig. 5. Settlements plotted against the square root of time in Fig. 6 show a linear relationship during the first 14 or 15 years of observ- ations. During the last 5 or 6 years the rate has been decreasing.
Soil conditions
Soil samples were obtained at the building site in 1956 using a 75-mm piston sampler and a few years later several vane borings were made. A much more extensive investigation was made for the nearby t a t fill in 1967. It included three in situ vane borings and two undisturbed sample borings. Samples were obtained with both the 54-mm NGI sampler (Bjerrum, 1954) and the 125-mm Osterberg sampler (Osterberg, 1952). The test results obtained from these samples (described by Bozozuk and Leonards, 1972), are considered to be superior to the
earlier tests and they are used therefore in the analysis of the settlements of the Accommodation Block.
The preconsolidation stress curve to a depth of 6 m shown in Fig. 7 is based on 11 consolidation tests using a load increment ratio of
x.
At stresses below the pre- consolidation stress the loads were generally applied for 2 h and above it for one day. Specimens were 2 m high and 20, 40 or 60 cn? in area. The higher values of pre- consolidation stress were given preference in drawing the curve on the assumption that disturbance would tend to decrease the measured value. According to Fig. 7 the soil is overconsolidated by 0.18 k g l c d . This small over- consolidation is probably due to chemical changes rather than to previously existing overburden.Piezometric observations
The general surface elevation at CFS Gloucester is about 81 m above sea level and the groundwater table is at or near the surface throughout the winter and spring sea- sons. When settlement observations were begun on the Accommodation Block in 1955, the importance of piezo- metric measurements was not appreciated. In 1965 four vertical piezometers were installed adjacent to the build- ing at elevations of 78.9, 75.8, 69.7, and 63.2 m and two were installed at an angle to extend under the building at elevations of 77.7 and 75.8 m (Fig. 2). In 1967 four reference piezometers were installed at elevations of 78.0, 75.5, 72.4, and 68.8 m near the special test fill mentioned earlier, but outside the influence of any surface loads.
The reference piezometers show that the piezometric level in the compressible layer (elevation 79.1 to 75.5 m) varies from the surface at elevation 81.0 in the spring to a minimum at elevation 79.2 m in late summer. The piezo- meters under the building show that the piemmetric level in the compressible layer varies only about 1.2 m season- ally (from elevation 80.3 to 81.5 m) and is always higher than the reference levels by 0.6 to 1.2 m. The piezometers adjacent to the building show average piezometric Ievels
T I M E , YEARS 0 5 1 0 15 2 0 25 3 0 35 40 I I I I 1 I I I
-
b I M M E D I A T E S E T T L E M E N T-
-
-
-
-
-- --
-
---
---
7---__
-
----
---
-
4---
----__
-
----_
--
---_
5 3----___
-
F L O O R A N D STRUCTURE-
-
" F O U N D A T I O N S A N D F I L L I N G E X C A V A T I O NFig. 4. Relationship between settlement and time.
T I M E , YEARS 0 . t 0 . 3 0 . 5 0 . 7 1 .O 3 . 0 5 . 0 7 . 0 1 0 . 0 3 0 5 0 '70 1 0 0 0 1 I I I I 1 1 1 I I I
-
I M M E D I A T E S E T T L E M E N T 5-
-
VI 1 0-
#--
Y I-
C Z 1 5 ' Y-
u Ct
2 05
2 C---
C 25.
-
*\* 5 3--
-.
3 0-
.\
.
-
**.-
.
3 5 I I I 1 I I I I I I IT I M E , YEARS had decreased to 0.3 m above the original ground sur-
0 I 4 9
16
0 , 2 3
I I 1 I I
" face and in less than one year had decreased to surface
\ level. The pore pressure near the bottom of the com-
'I
5 -
T\
pressible layer also decreased rapidly during the first two
-
months, but it was almost 3 years before the piezometer
-
u
b..
u
-
level had decreased to the original surface elevation
-
I 0-
(Bozozuk and Leonards, 1972). After 7 years the two piewmeters in the compressible layer were still reading
I
; I S z U
-
kKi:\--
1
at metric the original levels are surface almost elevation constant of while 81.0 the m. These levels piezo- in the-
2 0-
nearby reference piezometers vary from the surface in.A
'\.
-.
spring to a depth of 1.8 m in summer. In effect, there-?
:*\\.:
----
fore, the excess pore pressures under the fill varies annu-2 5
-
-
-
-
.
ally from zero to about 1.8 m of water."! --*
\\53
--
On the basis of these observations it is apparent that3 0
-..
--.
-
the average excess pole pressures under the Accommod--
ation Block would have dropped almost to their present3 5 I I I I I values about 2 years after the load was applied. It is
possible, therefore, to estimate the effective stress varia-
Fig. 6. Relationship between settlement and square root of tion beneath the building since the load was applied and time.
to correlate these stresses with the compression of the subsoil.
a few centimetres lower than those under the building. The pore pressures under and adjacent to the building,
when compared with the levels in the reference piezo- ~ ~ l ~ t i ~ ~ ~ h i ~ between effective stresses meters, show that an average excess of about 0.9
m
of and compressionwater exists under the building.
The maximum vertical effective stress at the centre of the compressible layer (elevation 77.3 m) before construction of the Accommodation Block was about 0.43 kglcm2.
Stresses beneath the building
The original vertical effective stresses at the site, shown in Fig. 7, are estimated from soil density measurements and the lowest observed groundwater table. The maxi- mum possible vertical effective stresses will occur when all excess pore pressures have dissipated. The present vertical effective stresses vary seasonally between curves A and B as indicated by piezometric observations under and adjacent to the building.
The measured preconsolidation stress curve C is taken from Bozozuk and Lwnards (1972). It is seen from Fig. 7 that preconsolidation stresses will be exceeded between elevations 79.1 and 75.5 m when the excess pore pressures are dissipated, but the soil in the compressible layer has probably not yet been stressed beyond its preconsolid- ation stress. This important observation will be discussed more fully in relation to several other case records.
Since 1965, when piezometers were installed, there has been no noticeable tendency for the excess pore pressures to dissipate. It would obviously have been wise to mea- sure pore pressures in situ from the beginning, but since this was not done it is necessary to estimate their varia- tion with time from other evidence.
It is reasonable to assume that the pore pressure varia- tion under the adjacent test fill would be similar to that under the Accommodation Block because the loads are approximately equal and the subsoils are virtually identical. Under the test fill the pore pressure near the top of the compressible layer increased rapidy when the load was added. Within 2 months, the pkmmeter level
6 1 8 0 7 9 . A La li. t- u z ; 7 8
-
t- 4t
La 7 7 7 1 7 s Fig. 7. M I N . GROUNDWATER LEVEL UNDER THEa BUILDING
-
Y ," b..-
EFFECTIVE STRESSES-
0 PRESENT M I N I M U M &- h. w n \1 \ \ EVENTUAL W X I M U M EFFECTIVE STRESSES
-
MAXIMUM I N SITU \u
EFFECTIVE STRESSES-
\ I \ \ - 1 s-
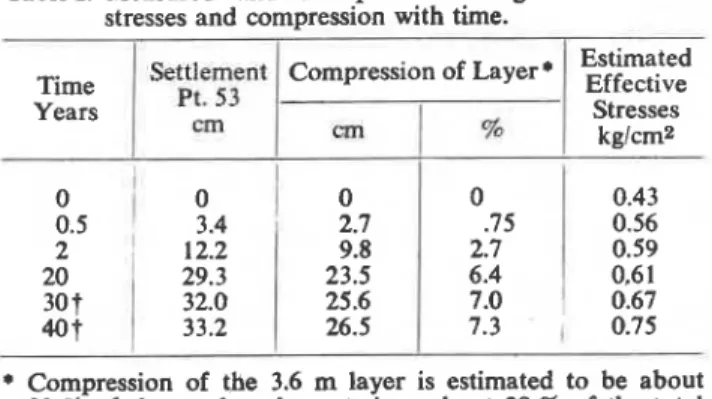
STRESS VARIATION CAUSED BY 0 0 . 5 I . Oaccording to Fig. 7. The maximum value for pore pres- Table I. Measured and extrapolated changes in effective
sure conditions that have existed since 1968 under the stresses and compression with time.
E F F E C T I V E V E R T I C A L S T R E S S , L ~ / ~ ~ ~
0 . 1 a . z 0 . 7 1 . o 2 . 0 4 . o
building is approximately 0.61 kglcm2, which is essentially
Time
equal to the measured preconsolidation stress of 0.62 Years
kg/cm2. The maximum value when the excess pore pres-
0 7
I
AVERAGE O F I YR
-
z KARS MIDGE ARROACU
0 3
VI -MAXIMUM OF
- 4
-W LABORATORY TESTS, KARS
w
L
L
0
u ACCOMMODATION BLOCK
c (MINIMUM STRESSES) 4 V; FINAL AVERAGE O F
-
z
w LABORATORY TESTS, KARS
U e w L V; FINAL ; 15 YRS I
-
'.
9 U ~ F I N A L-
1 0 1 I I I I ISettlement Compression of Layer*
Pt. 53 cm
I r n P
Estimated Stresses kglcmz1
. otest results. It is seen that the 3.6-m layer of soil under at 30t 33.2
0.59 0,6 1
0.67
Fig. 8. Stress-compression in the field and laboratory.
-
122-
26.5 7.3 0.75
sures have dissipated will be about 0.75 kglcm2.
The estimates of stress level and per cent compression
I
the building has undergone most of its compression under
a relatively constant vertical effective stress that is
*
Compression of the 3.6 m layer is estimated to be about80 % of the total settlement since about 20 % of the total approximately equal '0 its measured
rec consolidation
settlement under the test fill occurred in the lower clay, pressure. Most of the compression is therefore of the below elevation 75.5.
so-called "secondary" type. Although this conclusion is
t
Extrapolated values. based on estimates of the effective stresses, it is thoughtthat these estimates are realistic and consistent with full- settlement gauges at the test fill, the measured layer under
scale observations at other locations. the fill does not correspond exactly with the compressible
It is not possible at this time to predict when the excess layer under the building.
pore pressures will disappear. The rate of settlement of A third case record is available from the same general point 53 has, however, decreased to about 4 mm per year; area (at Kars, Ontario) where a 7.9-m high bridge the settlement during the next 20 years will probably be approach fill was placed over compressible clay (Eden less than 15 per cent of the settlement during the first and Poorooshasb, 1968). In this case the applied load
20 years. substantially exceeded the measured preconsolidation
The relation between vertical effective stress and per pressure and the pore pressures in the compressible layer cent compression under the adjacent test fill is also shown increased rapidly to more than 7.6 m of water. Within in Fig. 8; once again it is obvious that most of the com- 2 years after loading the average excess pressure had pression has occurred under a relatively constant vertical decreased to less than 3.0 m of water. After 7 years the effective stress. Although the load applied by the test fill average excess pore pressure in the layer was about 1.8 m is greater than that of the Accommodation Block, the of water and the excess was reasonably constant through- expected compression in the subsoil is slightly less. This out the layer. This excess pore pressure had decreased to
may be due to error in estimating compression under the about 1.5 m of water 12 years after loading.
building, assumed to be 80 per cent of the total settle- Pore pressure variations at Kars were somewhat irregu- ment, or to soil variations. Fig. 3 shows that variations lar in the early stages of observation due to construction should be expected. In addition, due to the positions of activities such as pile driving and stockpiling of construc-
are shown in Table I and their relationship is plotted in 12.2
29.3
Fig. 8 together with an average of several laboratory 20
32.0
9.8 2.7 23.5 6.4 25.6 7.0
tion material. In addition the fill was built in two stages with a 6.1 m height acting for about 1% years before the final layer of 1.8 m was added. These irregularities are apparent in the plot of per cent compression in relation to vertical effective stresses, also shown in Fig. 8. Two curves are shown for laboratory tests on soil samples from Kars. The lower curve shows average test results and the upper curve maximum values. In view of the slightly higher values of preconsolidation pressure re- ported for this site by Raymond (1972), the upper curve probably gives a more correct representation.
It appears that the field compression curve for Kars would have had a relationship to the laboratory curves similar to those at CFS Gloucester if the load had not been increased well beyond the preconsolidation pres- sure. At the higher load the field curve is more nearly parallel to the laboratory curve.
Another dramatic case record showing the relationship between loads, pore pressures and settlements of soft clays was presented by C h u g et al., (1973) at the Eighth International Conference. The site is at Vasby in Sweden and the load was applied by a square (30 by 30 metres) fill under the direction of Terzaghi in 1946. Some pore pressures were measured at the time, but the most signifi- cant observations were made when a set of new piezo- meters was installed between 1966 and 1968. Twenty-two years after construction the fill had settled 1.5 metres and the loading was reduced from 0.40 kglcm2 to 0.27 kglcm2 as the gravel fill began to settle below the groundwater table. The piezometers revealed, in 1968, that the excess pore pressure at the centre of the compressible layer (approximately 9 m thick) was still equal to the applied vertical pressure. This means that the loading had not yet influenced the effective stress at this point. The Swedish observations support the mncept of pore pressure genera- tion by structural collapse at a rate equal to the dissipa- tion rate.
Comparisons with other field studies
The pore pressures at both CFS Gloucester and Kars decreased rapidly immediately dafter the loading ceased but after a few years the excess pressures remained relatively steady although the compression continued. This phenomenon has also been observed at other loca- tions.
For example, extensive observations of pore pressures under a stage-loaded embankment over varved clay at New Liskeard in Northern Ontario (Stermac et al., 1967) showed that where the undrained shear strength of the subsoil was low (0.15 to 0.30 kglcm2) high values of pore pressure persisted throughout the compressible layer until the load was decreased 2% years later. This excess pore pressure was unexpected and the use of the stage loading technique had to be abandoned. It should also be noted that at the same construction site, but where the shear strength was generally higher (0.30 to 0.40 kglcmz), the induced excess pore pressures were only half as great.
In their discussion of this valuable case record, Craw- ford and Eden (1967) noted that most of the consolid- ation occurred in a 3.0-m layer of sensitive varved clay that had been stressed approximately to the measured preconsolidation pressure. It was observed at the Kars fill that no increase in vane shear strength could be detected after more than 3% years of loading when com- pression of the clay layer had reached about 4 per cent. Based on this experience, it was suggested that, owing to structural breakdown in the natural soil, the pore pres- sures were increasing as quickly as they could be relieved by drainage.
Furthermore, it was noted at New Liskeard that when part of the surcharge was removed after 2% years, the pore pressures decreased to less than half the previous values and, despite the resulting drop in the hydraulic gradient, the observed rate of dissipation increased. This suggested that the relief of overburden had stopped the strain mechanism that was creating pore p r e s m a .
Conclusions
Full-scale observations show that the relation between virgin compression and effective stress in the field can be quite different from that measured in the laboratory. In the sensitive clays near Ottawa the effective stress induced by surface loading quickly reaches a threshold value which remains essentially constant but compression con- tinues for many years. This is most evident when the applied stress is in the vicinity of the preconsolidation stress determined by ordinary laboratory tests. When the applied stress substantially exceeds the preconsolidation stress the effective stresses appear to increase continu- ously during the long-term compression.
Plots of settlement against the logarithm of time and the square root of time, obtained by extrapolating arith- metic plots, suggest that most of the consolidation settle- ment occurred in the "primary" phase, but detailed knowledge of the effective stresses suggests that it occurred as "secondary" consolidation. Consequently, the basic concept of dividing consolidation into two phases in this type of soil is again questioned.
Extrapolation of the arithmetic time-settlement plots for the three case records near Ottawa indicates that most of the compression in the subsoil has already occurred. It is concluded, therefore, that the excess pore pressures will soon dissipate and the effective stresses will increase to their final values with little additional settlement. Some further years of observations are needed to prove the final part of the field compression-stress
C U N e S .
Perhaps the most significant conclusion is that pore pressures appear to be generated by the collapsing clay structure at a rate equivalent to their dissipation by drainage and this results in a substantial compression under constant effective stress conditions. This concept is supported by all five case records.
Acknowledgements
The authors are indebted to many of their colleagues in the Division of Building Research for assistance in gather- ing the material for this paper.
Mr.
W. J. Eden and Dr. M. Bozozuk have been especially helpful. Two former members of staff, Dr. P.M. Jarrett and Dr. R.J. Mitchell, also made valuable contributions while at the Division. Mr. G. C. McRostie of McRostie, Genest, Middlemiss and Associates Ltd. was instrumental in arranging for the study which has had the full co-opera- tion of the Department of National Defence.References
Bjerrum, L. (1954): Geotechnical properties of Norwegian
marine clays. GBotechnique 4:2, 49-69.
Bjerrum, L. (1973): Problems of soil mechanics and con-
struction on soft clays. Proc. 8th Int. Conf. Soil Mech. Found. Eng. Mosww. 3:llI-159.
Bozozuk, M. and Leonards, G. A. (1972): The Gloucester
test-fill. Proc. Am. Soc. Civil Engrs. Spec. Cod. Performance of Earth and Earth-Supported Structures. 1 :1,299-317.
Chang, Y. C .E., B. Broms and R. B. Peck (1973): Relation-
ship between the settlement of soft clays and excess pore pressures due lo imposed loads. Proc. 8th Int. Conf. Soil Mech. Found. Eng. Moscow. 1 :1,93-96.
Crawford, C. B. (1 968): Quick clays of eastern Canada.
Eng. Geol. 2:4, 239-265.
Crawford, C. B. and W. J. Eden (1965): A comparison o f laboratory results with in situ properties of Leda clay. Proc. 6th Int. Conf. Soil Mech. Found. Eng., Montreal. I: 31-35.
Crawford, C. B. and W. J. Eden (1967): Discussion of "The
performance o f an embankment on a deep deposit o f varved clay". Can. Geotech. J . 4:1,63-64.
Eden, W. J. and H. B. Poorooshasb (1968): Settlement
observations at Kars bridne. - Can. Geotech. J. 5:1,29-45. Osterberg, 3. 0. (1952): New piston type soil sampler. Eng. News-Rec. 148: 77-78.
Raymond, G. P. (1972): The Kars (Ontario) embankment
foundation. Proc., Am. Soc. Civil Engrs., Special Conf. on Performance of Earth and Earth-Supported Structures. 1 :I,
319-340.
Sangrey, D. A. (1972): On the causes o f natural cementa-
tion in sensitive soils. Can. Geotech. J . 9:1, 117-1 19.
Stermac, A. G., K. Y. Lo and A. K. Barsvary (1967): The
performance o f an embankment on a deep deposit o f varved clay. Can. Geotech. J . 4:1,4561.