HAL Id: hal-01624648
https://hal-univ-rennes1.archives-ouvertes.fr/hal-01624648
Submitted on 26 Oct 2017
HAL is a multi-disciplinary open access
archive for the deposit and dissemination of
sci-entific research documents, whether they are
pub-lished or not. The documents may come from
teaching and research institutions in France or
abroad, or from public or private research centers.
L’archive ouverte pluridisciplinaire HAL, est
destinée au dépôt et à la diffusion de documents
scientifiques de niveau recherche, publiés ou non,
émanant des établissements d’enseignement et de
recherche français ou étrangers, des laboratoires
publics ou privés.
Reliable gradient search directions for kurtosis-based
deflationary ICA: Application to physiological signal
processing.
M Saleh, Ahmad Karfoul, A. Kachenoura, L. Senhadji, Laurent Albera
To cite this version:
M Saleh, Ahmad Karfoul, A. Kachenoura, L. Senhadji, Laurent Albera. Reliable gradient search
directions for kurtosis-based deflationary ICA: Application to physiological signal processing.. 39th
Annual International Conference of the IEEE Engineering in Medicine and Biology Society (EMBC),
Jul 2017, Jeju Island, South Korea. pp.2790-2793, �10.1109/EMBC.2017.8037436�. �hal-01624648�
Reliable gradient search directions for kurtosis-based deflationary ICA :
Application to physiological signal processing
M. Saleh
∗†, A. Karfoul
∗†, A. Kachenoura
∗†, L. Senhadji
∗†and L. Albera
∗†∗Inserm, UMR 1099, Rennes, F-35000, France; †LTSI, Université de Rennes 1, F-35000, Rennes France.
Abstract— Efficient gradient search directions for the optimi-sation of the kurtosis-based deflationary RobustICA algorithm in the case of real-valued data are proposed in this paper. The proposed scheme employs, in the gradient-like algorithm typically used to optimise the considered kurtosis-based ob-jective function, search directions computed from a more reliable approximation of the negentropy than the kurtosis. The proposed scheme inherits the exact line search of the conventional RobustICA for which a good convergence property through a given direction is guaranteed. The efficiency of the proposed scheme is evaluated in terms of estimation quality, the execution time and the iterations count as a function of the number of used sensors and for different signal to noise ratios in the contexts of non-invasive epileptic ElectroEncephaloGraphic (EEG) and Magnetic Resonance Spectroscopic (MRS) analysis. The obtained results show that the proposed approach offer the best estimation performance/iterations count and execution time trade-off, especially in the case of high number of sensors.
I. INTRODUCTION
Independent Component Analysis (ICA) is extensively used for Blind Source Separation (BSS) [3] where the aim is to infer P statistically independent sources contributing to a potentially noisy mixture of them received on an array of N sensors. In some biomedical applications, this mixture can be linearly modelled as follows:
x[m] = As[m] + ν[m] (1) where m is a natural number and x[m] is a realization of an N -dimensional random vector process {x[m]} of the observations, A (N × P ) denotes a tall mixing matrix, s[m] stands for a realization of a P -dimensional random process of sources {s[m]}, with components assumed to be statistically independent, and ν[m] denotes a realization of an N -dimensional process of Gaussian noise assumed to be independent from the source. Note that all processes considered in this paper are real-valued. As shown in [2], extracting statistically independent sources using ICA, in the case of model 1, is always possible when at most one source is of Gaussian distribution. Thus, the estimation of these sources can be done by maximizing some measure of non-Gaussianity such as the negentropy obtained from differential entropy and defined as:
F (x) = H(g) − H(x) (2) where g is a gaussian random vector of the same covariance matrix as x and H stands for the entropy. However, the negentropy is computationally very difficult since estimating it requires an estimate of the probability density function. To cope with this drawback, simpler approximations of
the negentropy are used such as higher order-cumulants, especially the fourth order one, well-known as the Kurtosis. Thanks to the attractive properties enjoyed by the Kurtosis, a multitude of ICA algorithms are based on this latter as a measure of the non-gaussianity [1], [2], [5], [6], [9], [10] to cite a few. In addition, some ICA approaches [1], [9], called symmetric methods, recover independent sources in one single-step. Others, referred to as deflationary approaches extract one source at a time [2], [5], [6], [10]. The key advantage of the deflationary scheme is that contrasts for single-source extraction can easily be proven to be free from spurious local solutions, so that all their local optima are associated with valid solutions [3], [5], [6], [10]. Besides, deflationary scheme can be stopped early once the sources of interest has already been extracted.This characteristic is very interesting in some biomedical applications, such as dense ElectoEncephaloGram (EEG) denoising (i.e. 257 sen-sors) and Magnetic Resonance Spectroscopic (MRS) signals analysis, where the number of all sources is higher than the number of sources of interest. Among the deflationary ICA algorithms, the RobustICA [10] stands for the very efficient one in terms of numerical complexity and estimation quality. Note that this method is originally proposed for both real and complex-valued data but only real-valued case is considered throughout this paper. The RobustICA method maximizes the kurtosis-based objective function in an efficient way using a gradient-ascent algorithm with exact line search scheme [10]. However, the strategy proposed in the RobustICA method could be considerably improved especially by improving the gradient search direction in the used gradient-like method. This problem is tackled in this paper and a new scheme to efficiently maximize the kurtosis-based cost function consid-ered in the deflationary RobustICA method is proposed. Con-trary to the conventional RobustICA method, the proposed approach employs a gradient direction that is computed from a nonlinear approximation of the negentropy which is more reliable than the one computed using the kurtosis. A comparative study, between the proposed solutions and the conventional deflationary RobustICA method, is proposed in the contexts of non-invasive epileptic dense-EEG signals denoising and MRS analysis. The obtained results show the good behaviour of our proposed method.
II. THE ROADMAP
A. The RobustICA method
Basically, the RobustICA algorithm solves the real-valued ICA problem (1) by maximizing the following kurtosis-based
objective function as an approximation of the negentropy [10]: ˜ F1(w(p)) = |C4(yp)| E[y2 p]2 = |E[y 4 p] E[y2 p]2 − 3|, ∀1 ≤ p ≤ P (3)
where ˜F is a kurtosis-based approximation of the negentropy F (2), C4(yp) denotes the fourth-order cumulant (kurtosis) of the p-th estimated source, yp, such that yp= w(p)
T
x where w(p)is the associated p-the separation vector, E[.] stands for the mathematical expectation and |.| denotes the absolute value of its argument. It is noteworthy that when the sign of the kurtosis is known, it is used instead of the absolute value of the kurtosis in equation (1). Although the data pre-whitening is not mandatory for RobustICA, employing it would improve its convergence property, especially when high-dimensional data is considered [7]. Therefore, if the observations are supposed to be pre-whitened, the contrast function in equation (3) can be written as:
˜
F1(w(p)) = |E[y4p] − 3|, ∀1 ≤ p ≤ P (4) where E[(w(p)Tx)2] = kw(p)k2. RobustICA maximizes the objective function ˜F1(w(p)), ∀1 ≤ p ≤ P using a gradient-ascent method with an exact line search plane using the following update rule [10]:
w(p)k+1← w(p)k + µ(k)opth(p)k (5) where h(p)k = hKURT(w
(p)
k ) is a given search direction at the k-th iteration associated to the p-th source. and where hKURT is computed as the gradient of ˜F1. Besides, the optimal step size, µ(k)opt, associated to the considered direction h(p)k is computed algebraically as following:
µ(k)opt= argmax µk ˜ F1(w (p) k + µkh (p) k ) (6) Note that the optimal computation of the stepsize µ showed a robustness to the presence of spurious local extrema and saddle points in addition to a remarkable improvement in the convergence speed [3], [10]. Once the p-th source is estimated, its contribution to the mixture is removed for an estimation of a new source (deflationary scheme).
B. The proposed scheme
As mentioned above, the RobustICA algorithm is, natu-rally, based on a search direction defined, at the k-th iteration, as h(p)k = ∇w(p) k ˜ F1(w (p) k ), ∀1 ≤ p ≤ P in the gradient-ascent algorithm (5), with the exact line search according to equation (6). Indeed, the kurtosis-based objective function allows easily for the exact computation of the stepsize µ (6) since it is polynomial in this latter. However, despite the attractive properties of the kurtosis, it is well-known to be sensitive to outliers because it may depend on only few observations in the tail of the distribution. Therefore, a search direction based on the kurtosis to approximate the negentropy, seems to be suboptimal. The key question at hand is how to provide a better search direction for the gradient-ascent algorithm (5) while maintaining the optimal computation of the stepsize similarly as in (6)?. To answer such a question the proposed solutions consist in employing,
at the k-th iteration of the gradient-ascent algorithm (i.e. equation (5)), a new gradient search direction, h(p)k , ∀1 ≤ p ≤ P computed from more reliable negentropy approx-imations than the kurtosis. Better approxapprox-imations of the negentropy can be obtained by generalizing the higher-order cumulant approximation using expectations of an appropriate non-quadratic function, g, as follows [6], [7]:
˜
F2(w(p)) = |E[g(y(p))] − E[g(`)]| ∀1 ≤ p ≤ P (7) where ` is a Gaussian variable. Both ` and y(p), ∀1 ≤ p ≤ P , are standardized. Note that for g = y4, the cost function (7) leads to ˜F1(w(p)) (4). Choosing a non-quadratic function g that does not grow too fast would lead to a more robust estimator of the negentropy than the kurtosis [7]. A good choice of such a function is given by [7]:
gLCH(y) = log cosh(y) (8) gGAUS(y) = −e−
y2
2 (9)
The gradient of ˜F2 (7) with respect to w(p)is then given as: ∇w(p)F˜2= sign(E[g(y)] − E[g(`)]) × E[x∇w(p)g(y)]
(10) where sign is the sign function. According to the above equation and to the definition of the non-quadratic functions gGAUS (9) and gLCH (8), two new more reliable gradient directions can be employed:
hLCH(w) = ∇w(p)F˜2= E[x tanh(wTx)] (11) hGAUS(w) = ∇w(p)F˜2= E[x(wTx)e−
(wTx)2 2 ] (12)
In addition, it is noteworthy that the use of either hLCH(w) or hGAUS(w) in equation (5), while maximizing the kurtosis-based objective function ˜F1 (4), maintains the possibility for an optimal stepsize computation. This is since the kurtosis-based function ˜F1 is still polynomial in the stepsize even if hKURT is replaced with hLCH(w) or hGAUS(w).
III. EXPERIMENTALANALYSIS
This section is devoted to evaluate the performance of the two proposed variants of the RobustICA method [10], denoted by RobustICALCH when the non-quadratic func-tion gLCH is considered to compute the gradient direction, and RobustICAGAUS when gLCH is used instead. The first experiment concerns the extraction of interictal epileptic spikes from physiologically plausible simulated surface EEG observations (non-invasive context). In the second experi-ment, we aim to extract two metabolites (Creatine and Myo-inositol) from their noisy mixture using realistic synthetic invivo MRS data. The two proposed RobustICA variants were compared with the conventional RobustICA method in terms of execution time, iteration count and the Normalized Mean Square Error (NMSE) as a function of the number of used sensors and for several Signal-to-Noise Ratios (SNRs). Note that the NMSE criterion is defined by: NMSEre =
PI i=1
PM
m=1(re[m]−ˆre(i)[m])2
LPM
m=1(re[m])2 where {re[m]} is the original
EEG/MRS signal of the e-th sensor/source, {ˆr(i)e [m]} is the reconstructed signal after denoising obtained from the i-th Monte Carol (MC) run, I and M stand for the number of MC
and the sample size, respectively. Note that all the reported results in this section were averaged over 40 MC realisations.
A. Electorencephalographic signals
1) Data Generation: A realistic head model (brain, skull and scalp) was used to generate the considered realistic EEG data. This head model was obtained after a segmen-tation of a 3D-T1 MRI. In order to evaluate the behaviour of RobustICALCH and RobustICAGAUS methods, four EEG channel configurations were set up, 32, 65, 110 and 257 electrodes. The EEG data were simulated from a single distributed source or patch, of 5 cm2 located in the right inferior temporal gyrus. A boundary Element Method (BEM) was used to compute the propagation medium connecting the source space to the observation one. Interictal spike-like activity generated by a neural mass model [4] was assigned to the patch. 40 trials with different spike-like signals were generated (10 seconds at 512 Hz i.e. 5120 samples). These signals corresponded to "clean" data. Regarding the noisy data, 40 epochs of real EEG muscle activity extracted from real 32, 65, 110 and 257 data and normalized with respect to channel with maximal power, were added to the simulated interictal spike activity with different levels of amplitude to get several SNR values: −20, −15, −10, −5, 0 and 5 dB.
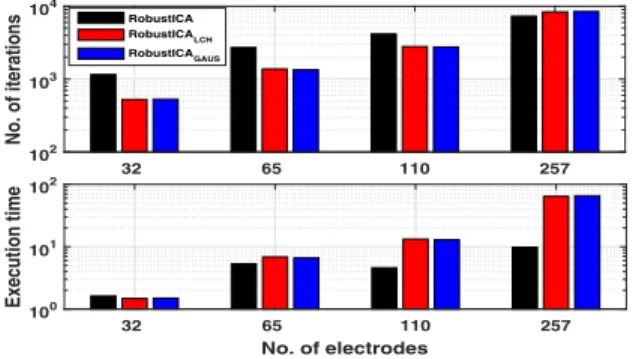
2) Numerical results: The denoising quality of the two proposed methods, namely RobustICAGAUS and RobustICALCH, compared to the conventional RobustICA in terms of the NMSE, is depicted in figure 1. For relatively small number of electrodes (i.e. 32 and 65), the two proposed schemes outperform the conventional RobustICA especially for very low SNR values (i.e. −20 and −15 dB) whereas similar behaviour was noted for higher SNR values. Re-garding the case of high number of electrodes (i.e. 110 and 257), a higher performance was noted for RobustICAGAUS and RobustICALCHcompared to the conventional RobustICA whatever the SNR value is, as depicted in figure 1. The performance of the proposed techniques is assessed in fig-ure 2 where a higher denoising quality was obtained for RobustICALCH over the conventional RobustICA. Note that, for the lake of place and since the two proposed meth-ods, RobustICALCH and RobustICAGAUS, showed similar behaviour, only the results of RobustICALCH were given in figure 2 for two among the considered 110 channels. It is noteworthy that the same behaviour of the proposed RobustICALCHand RobustICAGAUSwas obtained in the case of dense EEG settings (i.e. 257 electrodes) whereas the conventional RobustICA failed to correctly denoise interictal epileptic spikes as it could be seen from figure 1. As far as the execution time is considered, the conventional RobustICA method showed, as expected, less values compared to the proposed variants regardless the considered number of elec-trodes (i.e. 32, 65, 110 and 257), according to figure 3. However, thanks to the improved gradient search direction provided by a more accurate approximation of the negentropy as the way described in this paper, RobustICALCH and RobustICAGAUSrequired generally less number of iterations to get a solution than the RobustICA. This is true whatever the number of used electrodes is excepted for 257 electrodes where a slight superiority of the latter over the formers is
−200 −15 −10 −5 0 +5 1 2 SNR (dB) NMSE RobustICA RobustICALCH RobustICA GAUS −200 −15 −10 −5 0 +5 0.5 1 1.5 SNR (dB) NMSE −200 −15 −10 −5 0 +5 1 2 SNR (dB) NMSE −200 −15 −10 −5 0 +5 1 2 SNR (dB) NMSE 32 Electrodes 110 Electrodes 65 Electrodes 257 Electrodes
Fig. 1. NMSE vs. SNR for the proposed schemes, RobustICALCH and
RobustICAGAUScompared to the conventional RobustICA for 5
configura-tions of non-invasive EEG recordings.
TP8h TTP8h Time Channels Denoising by RobustICA TP8h TTP8h Noisy EEG (−20 dB) TP8h TTP8h Channels Clean EEG TP8h TTP8h Time Denoising by RobustICA LCH
Fig. 2. Denoising of interictal EEG data using 110 electrodes (selected from 257 ones); clean epoch (top left); noisy data with SNR= −20dB (top right); Denoising using i) RobustICA (bottom left); ii) RobustICALCH
(bottom right). 32 65 110 257 No. of iterations 102 103 104 RobustICA RobustICALCH RobustICA GAUS No. of electrodes 32 65 110 257 Execution time100 101 102
Fig. 3. No. of iterations required for the convergence and execution time vs. number of electrodes for the proposed, RobustICALCHand RobustICAGAUS
schemes compared to the conventional RobustICA in the context of iterictal spike denoising.
noticed as depicted in figure 3, but at the expense of the denoising quality (see figure 1).
B. Magnetic resonance spectroscopic data
1) Data generation: Synthetic in vivo MRS data were acquired using an array of N ∈ {16, 32, 64, 128} sensors. Particularly, a realistic MRS of two metabolites (Creatine and Myo-inositol) was generated using Lorentzian and Gaussian functions [8]. Then a linear noisy mixture of the latter is build according to equation (1) for which noise is adjusted accord-ing to the considered SNR values, i.e. −20, −10, 0, 10, 20 and 30 dB.
Original sources Extraction using RobustICAGAUS
0 350 700
Extraction using RobustICA
0 350 700
Extraction using RobustICA LCH
Noisy mixture (Channel #32) Noisy mixture (Channel #1)
Myo−inpsitol Creatine Myo−inpsitol Creatine Myo−inpsitol Creatine Myo−inpsitol Creatine
Fig. 4. Top: two from 64 observations of the mixture of two metabolites (Creatine and Myo-inositol) for SNR= 10 dB. Middle: original sources (left) estimated sources using RobustICAGAUS (right). Bottom: estimated
sources by RobustICALCH(left) and by RobustICA (right).
−200 −10 0 10 20 30 0.5 1 1.5 SNR (dB) NMSE −200 −10 0 10 20 30 0.5 1 1.5 SNR (dB) NMSE −200 −10 0 10 20 30 0.5 1 1.5 SNR (dB) NMSE −200 −10 0 10 20 30 0.5 1 1.5 SNR (dB) NMSE 128 Sensors 32 Sensors 16 Sensors 64 Sensors RobustICA RobustICA LCH RobustICA GAUS
Fig. 5. NMSE vs. SNR for the proposed schemes, RobustICALCH and
RobustICAGAUScompared to the conventional RobustICA in the context of
MRS source extraction.
2) Numerical results: Figure 4 shows a mixture of the two above metabolites for SNR equal to 10 dB (figure 4 (top)) and the estimated sources using both the proposed schemes, namely the RobusICAGAUS(figure 4 (middle-right)) and the RobusICALCH (figure 4 (bottom-left)) compared to the conventional RobustICA (figure 4 (bottom-right)). We note form the latter figure the higher estimation quality of the proposed schemes over the conventional RobustICA. Besides, according to figure 5, the proposed schemes showed similar extraction results compared to the conventional RobustICA method for all the SNR values in the case of 16 sensors. However both the proposed RobustICALCH and the RobustICAGAUSmethods showed higher extraction quality in terms of NMSE than the one of the conventional RobustICA when both the SNR and the number of sensors increases. Regarding the case of N = 64 and N = 128 sensors, a decrease in the estimation quality of all the considered methods compared to the case of N = 16 and N = 64 sensors is to be noted. Despite this behaviour, the pro-posed schemes still outperform the conventional RobusICA method as depicted in figure 5 (bottom). Besides, figure 6 shows generally that the conventional RobustICA is still less demanding in terms of the execution time compared to RobustICALCH and RobustICAGAUS. However, the latter schemes required generally fewer iterations to converge than the former except for the case of 128 sensors where the conventional RobustICA seemed to be less demanding.
IV. CONCLUSION
In this paper, an approach to improve the behaviour of the RobustICA as a deflationary kurtosis-based algorithm
No. of sensors 16 32 64 128 Execution time 10-1 100 16 32 64 128 No. of iterations 102 103 104 RobustICA RobustICALCH RobustICA GAUS
Fig. 6. No. of iterations and execution time vs. number of sensors for the
proposed schemes, RobustICALCH and RobustICAGAUS compared to the
conventional RobustICA in the context of MRS source extraction.
was presented. The proposed scheme employs a new search direction in the gradient-ascent algorithm while maximising the considered kurtosis-based objective function to identify the stepsize. Instead of a search direction typically computed as the gradient of the kurtosis-based objective function, the proposed scheme provides a gradient search direction computed using a nonlinear approximation of the negen-tropy which is more reliable than the kurtosis. Experimental results in the context of epileptic EEG denoising and MRS sources extraction were conducted showing the higher perfor-mance of the proposed scheme compared to the conventional RobustICA one.
V. ACKNOWLEDGEMENT
Authors would like to thank Isabelle Merlet, a full-time researcher at the LTSI-Inserm U1099, for providing the EEG data.
REFERENCES
[1] J.-F. Cardoso and A. Souloumiac. Jacobi angles for simultaneous
diagonalization. SIAM Journal Matrix Analysis and Applications,
17(1):161–164, 1996.
[2] P. Comon. Independent component analysis - a new concept? Signal Processing, 36:287–314, 1994.
[3] P. Comon and C. Jutten, editors. Handbook of Blind Source Separa-tion. Academic Press, New York, 2010.
[4] D. Cosandier-Rimélé, I. Merlet, J. Badier, P. Chauvel, and F. Wendling. The neuronal sources of EEG: Modeling of simultaneous scalp and intracerebral recordings in epilepsy. NeuroImage, 42(1):135–146, April 2008.
[5] N. Delfosse and P. Loubaton. Adaptive blind separation of independent sources: a deflation approach. Signal Processing, 45:59–83, 1995. [6] A. Hyvärinen. Fast and robust fixed-point algorithms for
indepen-dent component analysis. IEEE Transactions on Neural Networks, 10(3):626–634, May 1999.
[7] A. Hyvarinen, J. Karhunen, and E. Oja. Independent Component
Analysis. John Wiley & Sons, New York, 2001.
[8] S. Moussaoui and D. Brieand C. Carteret. Non-negative source
separation using the maximum likelihood approach. In IEEE Work-shop on Statistical Signal Processing (SSP05), pages 1114 – 1119, Novosibirsk, 2005.
[9] E. Oja and Z. Yuan. The fastica algorithm revisited: convergence analysis,. IEEE Transactions on Neural Networks, 17(6):1370?1381, November 2006.
[10] V. Zarzoso and P. Comon. Robust independent component analysis by iterative maximization of the kurtosis contrast with algebraic optimal step size. IEEE Transactions on Neural Networks, 21(2):248–261, 2010.