Analysis of Lubricant Film Thickness and Distribution along the
Piston/Ring/Liner Interface in a Reciprocating Engine
by Steven M. Casey B.S., Mechanical Engineering
University of Illinois at Urbana-Champaign, 1995
Submitted to the Department of Mechanical Engineering in Partial Fulfillment of the Requirements for the Degree of
Master of Science in Mechanical Engineering at the
MASSACHUSETTS INSTITUTE OF TECHNOLOGY February 1998
© 1998 Massachusetts Institute of Technology All Rights Reserved
Signature of Author:
/7
Dentent of Mechanical Engineering
D/1 ~o Deormhor 16 1997
Certified by:
Certified by:
Certified by:
victor W. Wong Lecturer, Department of Mechandcal Engineering
thesis Supervisor
Douglas P. Hart Assistant Professor, Department of Mechanical Engineering Thesis Supervisor
Ain A. Sonin Professor, Department of Mechanical Engineering Chairman, Committee for Graduate Students
Analysis of Lubricant Film Thickness and Distribution along the Piston/Ring/Liner Interface in a Reciprocating Engine
by Steven M. Casey
Submitted to the Department of Mechanical Engineering
on December 16, 1997 in Partial Fulfillment of the Requirements for the Degree of Master of Science in Mechanical Engineering
ABSTRACT
Acquired from a mono-cylinder, gasoline engine using Laser-Induced Fluorescence (LIF), lubricant film thickness and distribution data were analyzed along the piston/ring/liner interface. The magnitudes and trends are shown and interpreted for five selected lubricants tested at different engine operating conditions including liner temperatures, speeds, and firing and motoring operation. Effects along a stroke and azimuthally around midstroke were also captured by the four operable LIF windows within the liner. For model validation and assistance in interpretation, FRICTION-OFT and RINGPACK-OC models were applied where appropriate.
Oil film thickness (OFT) under the rings reveals only stroke-by-stroke differences for the oil-control (OC) ring. Along the free liner, only small stroke differences on the major-thrust side are observed and primarily caused by piston tilt effects on the scraper ring's relative profile. For the fired cases, OFT magnitudes and trends depend predominantly upon lubricant viscosity and agree both with approximate analytic scaling and more exact numerical predictions from the FRICTION-OFT model. Strong and weak exceptions include SAE-50 and SAE-1OW/50n, respectively, whose OFTs start to decrease in the neighborhood of 30 cSt. (Although less clear and for more lubricants, motored data reveals this reversed OFT-viscosity trend starting around 30 cSt as well.) Speed effects from engine speeds from 1800 to 2500 rpm and instantaneous piston speeds along a stroke on the major-thrust side are characteristic of hydrodynamic lubrication where measured OFT increases with sliding speed comparable to analytical scaling with the square root of speed and more exact numerical calculations. For the multigrades, shear thinning is directly observed, and OFTs even near BC at window 6 are only dependent upon the high-shear viscosity (and insensitive to low-shear viscosity). Proper ring conforming to bore distortion is observed from azimuthal measurements.
Although oil distributions show no clear trends with lubricant viscosity within the ring pack, lubricant behavior along the piston skirt indicates significant thrust-side oil transport. Oil distributions increase with speed along all regions but only within the ring pack for load changes from firing to motoring. Results from speed and load effects as well as pattern similarity among the first three lands support first and second ring gap-and-groove oil transport between the regions. Oil dragging from gas flows, oil displacement from inertial effects, oil squeezing between rings and grooves, and ring scraping are also shown to affect the amount and spatial distributions of oil within regions.
Thesis Supervisors:
Victor W. Wong Douglas P. Hart
Lecturer, Department of Mechanical Engineering Assistant Professor, Department of Mechanical Engineering
ACKNOWLEDGMENTS
This thesis would have not been completed without the support of some very important people who I would like to thank and acknowledge. Dr. Victor Wong, who employed me as a research assistant in the Lubrication Consortium, provided helpful advice regarding technical issues and especially oral and written communication. Through our relationship, I have become a better leader and manager for future technical projects. Professor Douglas Hart, who is my other advisor and first introduced me to the Lubrication Consortium, provided specific technical guidance on certain experimental issues and looked out for my interests as a student here at MIT. To Doug and Dr. Wong, thank you.
In addition to their sponsorship, industrial participants of the Lubrication Consortium provided insightful feedback and input during my research. Consortium members include Dana Corporation, MAHLE GmbH, Peugeot, Renault, Shell Oil Company, and Volvo. Discussions with Dr. Richard Tucker from Shell Oil Company concerning lubricant behavior were valuable. In addition to giving important engineering advice, Remi Rabute from Dana Corporation provided detailed measurements of the new ana worn ring geometries.
Fortunately, I have been able to work with some wonderful people who are very talented and have made my stay at MIT an enjoyable experience. A gifted engineer, Tian Tian taught me how to properly apply mathematical models and provided important insights to the experimental data. In addition to Tian, I would like to thank Bertrand Lecointe, Benoist Thirouard, and Bouke Noordzij for their friendship and good times as office mates. Goro Tamai answered my many detailed questions and provided valuable input concerning the experimental data and its acquisition. I would also like to thank Carlos Herrera, Peter Menard, Brian Corkum, and Mark Kiesel for their comradeship in and outside the lab and Norm Peralta whose positive and passionate attitude seemed to rub off on everyone. Additionally, the friendships with my buddies at the apartment including Michael Shelby, Brad VanDerWege, and Mark Dawson were encouraging and supportive.
I would like to thank the following list of fellow graduate students, undergraduate students, and visiting scholars in the Sloan Automotive Laboratory: Ertan Yilmaz, Jose Sanchez-Martinez, Kuo-Chun Wu, Helen Liu, Michaela Wiegel, David Kayes, Denis Artzner, Issam Lakkis, Robert Meyer, Chris O'Brien, Alan Shihadeh, Pierre Mulgrave, Wolf Bauer, Jon Fox, Peter Hinze, Younggy Shin, and John Rae. Additionally, I would like to thank Nancy Cook for all her help and pleasantness.
Finally, the wise advice and love from my parents back in Illinois cannot be understated. Their commitment to integrity and high standards have taught me many important lessons which have helped me become successful.
Steve Casey November 1997
TABLE OF CONTENTS Abstract 3 Acknowledgments 5 Table of Contents 7 List of Figures 11 List of Tables 16 Chapter 1 INTRODUCTION 17 1.1 Background 17 1.2 Previous Work 19 1.3 Project Objectives 21
1.3.1 Oil Film Thickness (OFT) under Rings and along Free Liner 21 1.3.2 Oil Distribution Along the PRL Regions within Ring Pack and
along the Piston Skirt 22
1.3.3 Comprehensive Compilation of Accurate OFT Data 22
Chapter 2 TEST LUBRICANTS 24
2.1 Temperature Dependence of Viscosity 24
2.2 Shear Dependence of Viscosity 26
2.3 Oil Degradation 31
Chapter 3 ENGINE AND TEST MATRIX 32
3.1 Test Engine and Windows 32
3.2 Operating Conditions and Test Matrix 34
Chapter 4 OIL FILM THICKNESS (OFT) ALONG FREE LINER AND
UNDER THE RING 35
4.1 Data Reduction for Ring Fitting and Free-Liner OFT 36
4.2 Baseline Results 41
4.2.1 Analysis of Film Thickness under Different Rings and Along the
Free Liner 48
4.2.2 The Lubricant Effect 50
4.2.3 Stroke-by-Stroke Differences 55
4.2.3.1 The OC Ring -- the Upper and Lower OC Segments 56
4.2.3.2 The Top and Scraper Rings 62
4.2.3.3 The Free Liner 63
4.2.3.3.1 Piston Tilt Effects 63
4.2.3.3.2 Land Pressure and Twist Effects 72
4.2.3.4 Stroke-By-Stroke Summary 77
4.3 Results off Baseline -- Effects of Lubricants, Liner Temperature, and
Load 78
4.3.1 Fired Cases for Different Lubricants at Moderate Liner
Temperatures -- 60, 80, and 1 00°C 79
4.3.1.1 Lubricant Effect 79
4.3.1.1.1 1800 rpm 80
4.3.1.2 Cylinder Liner Temperature Effect at 2500 rpm 85 4.3. i.3 Fired Viscosity Effect -- Combined Lubricant and
Temperature Effects 92
4.3.2 Motored Cases for Different Lubricants at Low Liner Motored
Temperatures -- 40 and 60°C at 2500 rpm 96
4.3.2.1 Lubricant Effect 96
4.3.2.2 Liner Temperature Effect 99
4.3.2.3 Motored Viscosity Effect -- Combined Lubricant and
Temperature Effects 102
4.4 Speed Effects 104
4.4.1 Engine Speeds at 1800 and 2500 rpm 104
4.4.2 Instantaneous Piston Speed Along a Stroke 111 4.5 Shear Thinning and Thickening of Multigrade Lubricants 117 4.6 Azimuthal Effects at Midstroke from Bore Distortion 119
4.7 OFT Summary 126
4.7.1 Experimental Findings 126
4.7.2 Extent of Agreement between OFT Measurements and Predictions
from the FRICTION-OFT Model 129
Chapter 5 OIL DISTRIBUTION WITHIN THE RING PACK AND ALONG
THE PISTON SKIRT 135
5.1 A Detailed Oil Distribution Summary 136
5.1.1 Experimental Findings 137
5.1.2 Model Verification of Ring Boundary Conditions and Predicted Scraper Down-Scraping from the FRICTION-OFT Model and
Predicted Top Ring Lift from the RINGPACK-OC Model 149 5.2 Data Reduction Along Different Regions of the Piston Assembly for
Different Azimuthal and Axial Window Locations 150
5.3 Baseline Results 155
5.3.1 The Lubricant Effect 167
5.3.2 Stroke-by-Stroke Differences 178
5.3.2.1 Within the Ring Pack 178
5.3.2.1.1 Crown and Second Land Regions -- ARTs and
Oil Squeezing in Grooves 180
5.3.2.1.2 Third Land Region 186
5.3.2.1.3 Region Between the Upper and Lower
OC Rails 187
5.3.2.2 Below the OC Ring Including Oil Transport along the
Skirt on the Major-Thrust Side 189
5.3.2.2.1 Major-Thrust Side -- Midstroke and Near
Bottom Center (Windows 1 and 6) 190
5.3.2.2.2 Off the Major-Thrust Side at Midstroke
(Windows 2 and 4) 199
5.4 Results of Parametric Studies -- Effects of Lubricants, Liner Temperature,
and Load 199
5.4.1 Fired Cases for Different Lubricants at Moderate Liner
Temperatures -- 60, 80, and 1000C 201
5.4.1.1 Lubricant Effect 201
5.4.1.1.2 2500 rpm
5.4.1.2 Cylinder Liner Temperature Effect at 2500 rpm 5.4.2 Motored Cases for Different Lubricants at Low Liner
Temperatures - 40 and 60°C at 2500 rpm 5.4.2.1 Lubricant Effect
5.4.2.2 Liner Temperature Effect
5.4.3 Load Effects -- 2/3 Load versus Motored WOT at 60°C 5.5 Engine Speed Effects -- 1800 Versus 2500 rpm
5.6 Azimuthal Effects around Midstroke
5.7 Direct Observation of Oil Transport Mechanisms 5.7.1 Oil Squeezing between Top Ring and Groove 5.7.2 Down-Scraping of Scraper Ring along a Stroke 5.7.3 Lubricant Dragging from Gas Flow
5.7.4 Inertial Forces and Viscosity Restriction on Oil Flow
5.7.5 Oil Behavior along the Piston Skirt -- Thrust-Side Oil Transport Chapter 6: CONCLUSIONS AND RECOMMENDATIONS
References APPENDICES
Appendix A OVERVIEW OF PISTON-RING-LINER (PRL) SYSTEM AND GOVERNING MOTIONS OF LUBRICANT BEHAVIOR A. 1 Lubrication between Rings and Liner
A.2 Ring Axial and Angular Dynamics, Gas-Flow Oil Dragging, and Inertia of Oil Masses
A.3 Piston Secondary Motion Appendix B EXPERIMENTAL APPARATUS
B. 1 The Modified Engine
B. 1.1 Window Location and Installation Procedure B.1.2 Retrofitted Water Jacket
B.1.3 Thermocouples
B. 1.4 Cylinder Pressure Transducer B.1.5 Shaft Encoder
B.2 One-Dimensional (-D) LIF Diagnostic System B.2.1 Precision and Accuracy
B.2.2 Viscosity and Temperature Effects on Fluorescent Efficiency
B.3 The Data Acquisition System
Appendix C MEASUREMENTS OF ENGINE COMPONENTS C. 1 The Piston -- Macro-Geometry
C.2 Micro-Measurements -- The Bore and PRL System C.2.1 The Rings
C.2.2 The Piston
C.2.2. 1 Land Machining Mark Profiles on Major-Thrust Side C.2.2.2 Upper Piston Machining Mark Profiles on Major-Thrust
C.2.3 Bore and Window-to-Liner Flushness 312
C.2.3.1 Bore Distortion 312
C.2.3.2 Window-to-Liner Flushness 313
Appendix D DATA PROCESSING 317
D. 1 Engine Kinematics and Dynamics 318
D.2 Calibration 323
D.2.1 Method 3f Calibration 323
D.2.2 Calibration Coefficients for Cases Within Test Matrix 326 D.3 Piston Temperature Effects on Fluorescent Efficiency and Measured Oil 329 Appendix E NUMERICAL MODELS USED FOR DATA ANALYSIS AND
INTERPRETATION 331
E.2 FRICTION-OFT 331
E.3 RINGPACK-OC 333
Appendix F: STANDARD DEVIATION AND UNCERTAINTY FORMULAS 334
Appendix G: ANALYTICAL ARGUMENT FOR MEASURED OFT HIERARCHY WITHIN ANY LUBRICANT CASE AND CRITERIA FOR LOCALLY FULLY-DEVELOPED FLOW, NEGLIGIBLE ENTRANCE LENGTH AND SQUEEZING, AND MOFT DEPENDENCE ON VISCOSITY AND SPEED FOR MIDSTROKE AND NEAR-BC LOCATIONS
WITHIN THE KOHLER ENGINE 335
Appendix H: OFT-VISCOSITY EFFECT AT WINDOW 4 FOR THE 343
FIRED CASES
Appendix I: ENGINE SPEED EFFECTS FOR CASES WITH LOW CALIBRATION
ACCURACIES AT MIDSTROKE AND NEAR-BC 344
Appendix J: REFUTED ARGUMENTS FOR FREE-LINER STROKE-BY-STROKE
TRENDS 349
Appendix K: STROKE-BY-STROKE DIFFERENCES IN OIL DISTRIBUTION BELOW THE OC RING OFF THE MAJOR-THRUST SIDE AT
LIST OF FIGURES
Figure 2-1 Viscosity Versus Temperature for Four Selected Lubricants 25
Figure 2-2 Kinematic Viscosity Versus Average Shear Rate for SAE-10W/50n and -10W/50k from
the Cross Equation 28
Figure 2-3 OFT Insensitivity to Low-Shear Viscosity of SAE-IOW/50n. (a) Viscosity Versus
Shear (b) Predicted OFT Insensitivity for Free Liner and Top Ring at Midstroke 30
Figure 3-1 LIF Probe/Window Locations and Number Convention of Kohler Engine 33
Figure 3-2 Test Matrix for Kohler Engine with Four Operable LIF Windows 34
Figure 4-1 Ring Fitting and Free-Liner OFT for Intake Stroke at Window 4. (a) Actual Ring and
Segment Geometries Fit Within an OFT Trace (b) Free-Liner OFT and Ring MOFTs 37
Figure 4-2 Covariance Correlation: Standard Deviation Versus MOFT from Window I from Two
Independent Studies (a) Lubricant Set One (the current test set) (b) Lubricant Set Two 40
Figure 4-3 Stroke-Averaged OFT for the Five Lubricants at the Baseline Condition from Windows
(a) 1, (b) 2, (c) 4, and (d) 6 43
Figure 4-4 Intake Stroke OFT for the Five Lubricants at the Baseline Condition from Windows
(a) 1, (b) 2, (c) 4, and (d) 6 44
Figure 4-5 Compression Stroke OFT for the Five Lubricants at the Baseline Condition from
Windows (a) 1, (b) 2, (c) 4, and (d) 6 45
Figure 4-6 Expansion Stroke OFT for the Five Lubricants at the Baseline Condition from Windows
(a) 1, (b) 2, (c) 4, and (d) 6 46
Figure 4-7 Exhatst Stroke OFT for the Five Lubricants at the Baseline Condition from Windows
(a) 1, (b) 2, (c) 4, and (d) 6 47
Figure 4-3 Baseline OFT Measurements and Model Predictions from Windows
(a) 1, (b) 2, (c) 4, and (d) 6 54
Figure 4-9 Stroke MOFTs at Baseline from Window 1 for (a) Upper OC Segment
and (b) Lower OC Segment 57
Figure 4-10 Midstroke Window Locations: Stroke-Averaged Upstroke Versus Downstroke MOFTs of the Lower OC Rail at 1800 and 2500 rpm for (a) SAE -10W, (b) -10W/50n,
(c) -50, and (d) -OW/S0k 58
Figure 4-11 Window 6: Stroke-Averaged Upstroke Versus Downstroke MOFTs of the Lower OC Rail at 1800 and 2500 rpm for (a) SAE-1OW, (b) -10W/50n, (c) -50, and
(d)- 10 W/50k 61
Figure 4-12 Stroke MOFTs at Baseline from Window I for (a) Top Ring and (b) Scraper Ring 63
Figure 4-13 Stroke Free-Liner OFT for the Baseline Condition at Window 1 for Highly
Accurate Cases 64
Figure 4-14 Percent Increase in Free-Liner OFT from First Two to Last Two Strokes at Midstroke at Major-Thrust Side for Liner Temperatures of(a) 100, (b) 80, and (c) 60°C
Measurements Off the Major-Thrust side at 1000C for windows (d) 2 and (e) 4 66
Figure 4-15 Piston, Ring, and Groove Interaction. (a) Effect of Piston Tilt on Scraper Ring
Face Relative to Line. (b) Possible Ring Tilt Relative to Groove 68
Figure 4-16 Percent Increase in Free-Liner OFT from First Two to Last Two Strokes from
(a) Experiments and (b) Model Predictions for Five Lubricants at Major-Thrust Side 71
Figure 4-17 Ring Position with Exaggerated Twist at Midstroke Position During the Expansion Stroke -- 740 ATC (a) Axial Forces from Ring-Liner Friction, Land Pressures, and
Inertia. (b) Radial Forces from Lubricant, Ring Tension, and Land and Groove
Pressures 74
Figure 4-18 RINGPACK-OC Results for (a) Land Pressure Predictions and (b) Top and Scraper
Ring Relative Lift within Their Grooves for 2/3 load, 2500 rpm, and 1000C Liner
Midstroke Temperature 75
Figure 4-19 CA-Resolved Predicted MOFTs from FRICTION-OFT Model for Top, Scraper, and
OC Ring 77
Figure 4-21 Free-Liner OFT and Ring MOFTs for the Lubricant Effect of SAE-IOW, -1OW/50n, -30, and -50 for the (a) Downstrokes of the Lower OC Segment, (b) Upstrokes of the Lower OC Segment, (c) Upper OC Segment, (d) Scraper Ring, (e) Top Ring, and
(f) Free Liner 84
Figure 4-22 Free-Liner OFT and Ring MOFTs at Different Liner Temperatures at Window 1 for
(a) SAE-1OW, (b) -10W/SOn, and (c) -50 87
Figure 4-23 Free-Liner OFT and Ping MOFTs for the Temperature Effect of SAE- OW, -10W/50n, and -50 for the (a) Downstrokes of the Lower OC Segment, (b) Upstrokes of the Lower OC Segment, (c) Upper OC Segment, (d) Scraper Ring, (e) Top Ring, and
(f) Free Liner 91
Figure 4-24 Free-Liner OFT and Ring MOFTs for the Viscosity Effect of SAE- OW, -10W/50n,
-30, and -50 for Liner Temperatures of 100, 80, and 600C from (a) Window 1,
Co) Window 2, and (c) Window 6 95
Figure 4-25 Free-Liner OFT and Ring MOFTs for the Motored Lubricant Effect for all Five Lubricants at 40 and 60°C for (a) Downstrokes of the Lower OC Segment,
(b) Upstrokes of the Lower OC Segment, (c) Upper OC Segmenc, (d) Scraper Ring,
(e) Top Ring, and (f) Liner 99
Figure 4-26 Free-Liner OFT and Ring MOFTs for the Lubricant Effect of SAE-10OW, -1 0W/50n,
-30, and -50 for (a) Downstrokes of the Lower OC Segment, (b) Upstrokes of the Lower OC Segment, (c) Upper OC Segment, (d) Scraper Ring, (e) Top Ring, and
(f) Free Liner 102
Figure 4-27 Free-Liner OFT and Ring MOFTs for the Viscosity for the Five Lubricants for Liner
Temperatures of 40 and 60°C 103
Figure 4-28 Engine Speed Effect from 1800 to 2500 rpm Measured from Window 1 for
(a) SAE- IOW, (b) -10W/50n, and (c) -50 106
Figure 4-29 Engine Speed Effect (1800 Vs. 2500 rpm) Measured from Window 6 for
SAE- 10W/50n 108
Figure 4-30 Instantaneous Speed Effect along a Stroke from Window 1 to Window for
(a) SAE-1OW, (b) -10W/50n, and (c) -50 114
Figure 4-31 Instantaneous Speed Effect along a Stroke from Window 1 to 6 for
(a) SAE-1OW (800C, 2500 rpm), (b) -10OW (600C, 2500 rpm), and (c) -10W/50n 116
Figure 4-32 Top Ring MOFT for SAE-1 OW, -10 OW/50n, and -50 at Midstroke for
(a) 1800 and (b) 2500 rpm 118
Figure 4-33 Top Ring MOFT for SAE-IOW, -10W/50n, and -50 from Midstroke to near BC 119
Figure 4-34 Azimuthal OFT Measurements at Windows 1, 2, and 4 for Selected Lubricants and Operating Conditions for (a) Free Liner, (b) Top Ring, (c) Scraper Ring,
(d) Upper OC Segment, (e) Lower OC Segment, Upstrokes, and
(f) Lower OC Segment, Downstrokes 122
Figure 4-35 Bore Distortion with Non-Conformed Ring 124
Figure 4-36 Possible Local Ring Pressure Load on Lubricant Film 125
Figure 5-1 Region Assignments for the Free Liner and Ring Pack 151
Figure 5-2 Region Assignments below the OC Ring for the Azimuthal Locations at
(a) Windows 1, (b) 4 (and 2), and the Near-BC Location at (c) Window 6 154
Figure 5-3 Baseline Average Region Thicknesses (Stroke-Averaged) for Regions 3 - 8 from
Windows (a) 1, (b) 2, (c) 4, and (d) 6 157
Figure 5-4 Baseline Average Region Thicknesses (Stroke-Averaged) for Free Liner and First and
Second Land Regions from Windows (a) 1, (b) 2, (c) 4, and (d) 6 158
Figure 5-5 Baseline Average Region Thicknesses for the Intake Stroke for Regions 3 - 8 from
Windows (a) I, (b) 2, (c) 4, and (d) 6 159
Figure 5-6 Baseline Average Region Thicknesses for the Intake Stroke for Free Liner and First and
Second Land Regions from Windows (a) 1, (b) 2, (c) 4, and (d) 6 160
Figure 5-7 Baseline Average Region Thicknesses for the Compression Stroke for Regions 3 - 8 ]
from Windows (a) 1, (b) 2, (c) 4, and (d) 6 161
First and Second Land Regions from Windows (a) 1, (b) 2, (c) 4, and (d) 6 162 Figure 5-9 Baseline Average Region Thicknesses for the Expansion Stroke for Regions 3 - 8 from
Windows (a) 1, (b) 2, (c) 4, and (d) 6 163
Figure 5-10 Baseline Average Region Thicknesses for the Expansion Stroke for Free Liner and
First and Second Land Regions from Windows (a) 1, (b) 2, (c) 4, and (d) 6 164
Figure 5-11 Baseline Average Region Thicknesses for the Exhaust Stroke for Regions 3 - 8 from
Windows (a) 1, (b) 2, (c) 4, and (d) 6 165
Figure 5-12 Baseline Average Region Thicknesses for the Exhaust Stroke for Free Liner and First
and Second Land Regions Windows (a) 1, (b) 2, (c) 4, and (d) 6 166
Figure 5-13 Baseline Average Region Thicknesses (Stroke-Averaged) from Window 1 for
Regions (a) 1, (b) 2, (c) 3, (d) 4, (e) 5, (f) 6, and (g) 7 170
Figure 5-14 Baseline Average Region Thicknesses (Stroke-Avg) from Window 4 for Regions 1 - 7 171
Figure 5-15 Baseline Average Region Thicknesses (Stroke-Averaged) from Window 6 for
Regions (a) 2, (b) 3, (c) 4, (d) 5, (e) 6, (f) 7, and (g) 8 174
Figure 5-16 Stroke-By-Stroke, Average Region Thicknesses from the Ring Pack for the (a) Crown Land Region, (b) Second Land Region, (c) Third Land Region, and
(d) Region between the Upper and Lower OC Rails 180
Figure 5-17 Oil Distribution Along Second Land Region During the Expansion Stroke for
(a) SAE-50 and (b) -10OW 181
Figure 5-18 Stroke-by-Stroke Top Ring Squeezing at Midstroke for (a) Bottom and
(b) Top Channel Squeezing and near BC for (c) Bottom Channel Squeezing 183
Figure 5-19 Schematic of Oil Squeezing within Channels during an Latter Half of an
(a) Expansion Stroke and (b) Intake Stroke 184
Figure 5-20 Top Ring Position within Its Groove at (a) Midstroke Windows, from (b) Predicted
Top and Scraper Ring Lift from RINGPACK-OC, and at (c) Near-BC Window 6 185
Figure 5-21 Stroke-By-Stroke, Average Region Thicknesses for Region 4 from
(a) Window 2 and (b) Window 4 188
Figure 5-22 Motored Stroke-By-Stroke, Average Region Thicknesses for Region 4 from Window 1 189
Figure 5-23 Oil Distribution along the Skirt as the Piston Translates throughout a Cycle for (a) Intake Stroke at midstroke, (b) Intake Stroke near BC, (c) Compression Stroke
near BC, (d) Compression and Expansion Stroke at Midstrokes (e) Expansion Stroke near BC, (f) Exhaust Stroke near BC, and
(g) Exhaust and Intake Strokes at Midstroke 193
Figure 5-24 Volumetric Oil Transport along Piston Skirt as Piston Reciprocates through TC from
Compression to Expansion and Exhaust to Intake strokes 196
Figure 5-25 ARTs for Regions below the OC Ring on the Major-Thrust Side for (a) Groove and Chamfer Region -- Region 5,
(b) Upper Piston Skirt Region -- Region 6,
and (c) Lower Piston Skirt Region -- Region 7 198
Figure 5-26 ARTs along the Upper Piston Skirt Region -- Region 6 -- from Window 6 199
Figure 5-27 Average Region Thicknesses (Stroke-Averaged) at 1800 rpm from Window 1 for
Regions (a) 1, (b) 2, (c) 3, (d) 4, (e) 5, (f) 6, and (g) 7 204
Figure 5-28 Average Region Thicknesses (Stroke-Averaged) at Moderate Temperatures of 60, 80,
and 100°C from Window 1 for Regions (a) 1, (b) 2, (c) 3, (d) 4, (e) 5, (f) 6, and (g) 7 207
Figure 5-29 ARTs (Stroke-Averaged) for the Temperature Effect (Fired) at Moderate Temperatures of 60, 80, and 100°C from Window 1 for Regions (a) 1, (b) 2, (c) 3, (d) 4, (e) 5, (f) 6,
and (g) 7 211
Figure 5-30 ARTs (Stroke-Averaged) for the Temperature Effect (Fired) at Moderate Temperatures of 60, 80, and 100°C from Window 6 for Regions (a) 2, (b) 3, (c) 4, (d) 5, (e) 6, (f) 7,
and (g) 8 216
Figure 5-31 Average Region Thicknesses (Stroke-Averaged) for the Lubricant Effect (Motored) at
Low Temperatures of 40 and 600C from Window I for Regions (a) 1, (b) 2, (c) 3,
(d) 4, (e) 5, (f) 6, and (g) 7 220
of 40 and 60°C from Window 1 for Regions (a) 1, (b) 2, (c) 3, (d) 4, (e) 5, (f) 6,
and (g) 7 225
Figure 5-33 ARTs (Stroke-Averaged) for the Load Effect (Fired Versus Motored) from Window 1
for Regions (a) 1, (b) 2, (c) 3, (d) 4, (e) 5, (f) 6, and (g) 7 228
Figure 5-34 Ring-Pack Oil Distribution for SAE-1OW for the Load Effect (Fired Versus Motored)
for the (a) Intake and Compression Strokes and (b) Expansion and Exhaust Strokes 229
Figure 5-35 Ring-Pack Oil Distribution for SAE-lOW/50n for the Load Effect (Fired Versus Motored) for the (a) Intake and Compression Strokes and
(b) Expansion and Exhaust Strokes 230
Figure 5-36 Ring-Pack Oil Distribution for SAE-50 for the Load Effect (Fired Versus Motored) for
the (a) Intake aid Compression Strokes and (b) Expansion and Exhaust Strokes 231
Figure 5-37 Motored (WOT) RINGPACK-OC Results for (a) Land Pressure Predictions and
(b) Top and Scraper Ring Relative Lift within Their Grooves 234
Figure 5-38 Predicted Mass Flow Rates through Channels between Rings and Grooves During a Cycle for Fired and Motored Conditions from (a) Crown Land to Region Behind Top Ring, (b) Region Behind Top Ring to Second Land, c) Second Land to'Region
Behind Second Ring, and (d) Region Behind Second Ring to Third Land 236
Figure 5-39 Predicted Gap Mass Flow Rates During a Cycle for Fired and Motored Conditions for
the (a) Top and (b) Second Rings 236
Figure 5-40 Engine Speed Effect (1800 Versus 2500 rpm) at Midstroke on Major-Thrust Side
(Window 1) for (a) SAE-1OW, (b) -10W/50n, and (c) -50 241
Figure 5-41 Engine Speed Effect (1800 Versus 2500 rpm) near BC on Major-Thrust Side
(Window 6) for SAE-1OW/S0n 242
Figure 5-42 Engine Speed Effect (1800 (adjusted) Versus 2500 rpm) at Midstroke Off
Major-Thrust Side for SAE- 10W/50n at (a) Window 2 and (b) 4 243
Figure 5-43 Ring-Pack Oil Distribution for SAE- lOW for the Speed Effect (1800 Versus 2500 rpm)
for the (a) Intake and Compression Strokes and (b) Expansion and Exhaust Strokes 246
Figure 5-44 Ring-Pack Oil Distribation for SAE-10 OW/50n for the Speed Effect
(1800 Versus 2500 rpm) for the (a) Intake and Compression Strokes and
(b) Expansion and Exhaust Strokes 247
Figure 5-45 Ring-Pack Oil Distribution for SAE-50 for the Speed Effect (1800 Versus 2500 rpm)
for the (a) Intake and Compression Strokes and (b) Expansion and Exhaust Strokes 248
Figure 546 RINGPACK-OC Results at 1800 rpm for (a) Land Pressure Predictions and
(b) Top and Scraper Ring Relative Lift within Their Grooves 249
Figure 5-47 Predicted Mass Flow Rates through Channels between Rings and Grooves During a Cycle for 1800 and 2500 rpm from (a) Crown Land to Region Behind Top Ring,, (b) Region Behind Top Ring to Second Land, (c) Second Land to Region Behind
Second Ring, and (d) Region Behind Second Ring to Third Land 250
Figure 5-48 Predicted Gap Mass Flow Rates During a Cycle for 1800 and 2500 rpm for the
(a) Top and (b) Second Rings 251
Figure 5-49 Azimuthal ARTs at Windows 1, 2, and 4 for Selected Lubricants and Operating Conditions for the Ring Pack Including the (a) Free Liner (reference), (b) Crown Land Region, (c) Second Land Region, (d) Third Land Region, (e) Region between OC
Rails -- Upstrokes, and (f) Region between OC Rails -- Downstrokes 257
Figure 5-50 Azimuthal ARTs at Windows 1, 2, and 4 for Selected Lubricants and Operating Conditions for Regions Below the OC Ring Including the (a) Chamfer Region (Region 5) -- Upstrokes, (b) Region 5 -- Intake, (c) Region 5 -- Expansion, (d) Region 6 (Upper Piston Skirt for Major-Thrust Side) -- Upstrokes,
(e) Region 6 -- Downstrokes, and (c) Region 7 259
Figure 5-51 Down-Scraping of the Second Ring from (a) an Illustrated Schematic and
(b) Model Predictions of Approaching and Exiting Liner Oil Films 263
Figure 5-52 Measured Oil Down-Scraping Shown by (a) an Entire Oil Distribution Traces, (b) the Third Land Region, and (c) the ART in Third Land Region from Window 1 to
Figure 5-53 Oil Distributicn Comparison at Midstroke -- Downstrokes Versus Upstrokes 271
Figure 5-54 Oil Distribution Comparison at Midstroke -- Downstrokes Versus Upstrokes 271
Figure 5-55 Oil Distribution Comparison at Midstroke - Downstrokes Versus Upstrokes 272
Figure 5-56 Oil Distribution Comparison near BC-- Downstrokes Versus Upstrokes 272
Figure 5-57 Oil Distribution Comparison at Midstroke -- Downstrokes Versus Upstrokes 274
Figure 5-58 Oil Distribution Comparison near BC -- Downstrokes Versus Upstrokes 274
Figure A-i The PRL System -- the Ring Pack and Piston 291
Figure A-2 Top Compression Ring 291
Figure A-3 Scraper Ring -- Scraping and Negative Twist 291
Figure A-4 Gap and Groove Oil Transport 294
Figure B-1 Schematic of the LIF System, Configured Engine, and Data Acquisition System 296
Figure C-1 Selected Piston Dimensions and Window Locations Relative to Skirt 304
Figure C-2 Micro-geometry of ing Face Profiles 308
Figure C-3 Scraper Ring with Negative Static Twist under Tension with Minimum Point 309
Figure C-4 One Possible Configuration of the OC Ring Assembly Under Tension within Its
Groove 309
Figure C-5 Micro-Measurements of Selected Piston Regions on Major-Thrust Side -- Top and
Second Lands and Upper Piston Skirt (first five millimeters) 311
Figure C-6 Bore Distortion at Midstroke after Experiments 313
Figure C-7 Window 4 and Its Adjacent Liner (b) Before and (c) After Experiments 314
Figure D- Oil Film Thickness within the Ring Pack and Partially Along the Upper Skirt and
Free Liner at Window 1 317
Figure D-2 Schematic of PRL System with Window Locations for Kinematic Evaluation 318
Figure D-3 Piston Region and Ring Position Versus Crank Angle with Reference To
Midstroke Windows Along the Liner 319
Figure D-4 Instantaneous Piston Speed versus CA 319
Figure D-5 Piston Region and Ring Position Versus Crank Angle with Reference To
Window Location Along the Liner 321
Figure D-6 Instantaneous Piston Speed versus CA for an Entire Stroke 321
Figure D-7 Oil Film Thickness near BC at Window 6 (a) Within the Ring Pack and Partially
Along the Upper Skirt and (b) Along Entire Skirt and Free Liner Below Skirt 323
Figure D-8 Calibration to Upper Skirt Machining Marks During Compression Stroke 325
Figure D-9 Calibration to Upper OC Rail During Exhaust Stroke 325
Figure E Single-Piece Model Simplification of the Actual Three-Piece OC Ring 333
Figure G-1 Ring-Liner Lubrication with Sub-Ring Pressure Profile 336
Appendix H Free-Liner OFT and Ring MOFTs from Window 4 for the Viscosity Effect of
SAE-IOW, -10W/50n, -30, and -50 for Liner Temperatures of 100, 80, and 60°C 343
Appendix I Engine Speed Effects at Windows 2, 4, and 6 for Cases with Fair to Poor Calibration
Coefficients 344
Figure K-1 Oil Distribution below the OC Ring from Window 2 for (a) Intake and Compression
and (b) Expansion and Exhaust Strokes 352
Figure K-2 ARTs for Regions below the OC king from Window 2 for
(a) Groove and Chamfer Region -- Region 5, (b) Upper Piston Region -- Region 6, and
(c) Lower Piston Region -- Region 7 354
Figure K-3 Oil Distribution below the OC Ring from Window 4 for (a) Intake and Compression
and (b) Expansion and Exhaust Strokes 355
Figure K-4 ARTs for Regions below the OC Ring from Window 4 for
(a) Groove and Chamfer Region -- Region 5, (b) Upper Piston Region -- Region 6, and
LIST OF TABLES
Table 2.1 Kinematic Viscosity (cSt) Versus Temperature for All Five Lubricants 25
Table 4.1 Numbering Assignments for Lubricants 120
Table 4.2 Extent of Agreement between OFT Measurements and Predictions from the
FRICTION-OFT Model 131
Table 5.1 Measured and Calculated Oil Travel along the Third Land for 1800 and 2500 rpm for
SAE-1OW, -10W/50n, and -50 253
Table 5.2 Numbering Assignments for Lubricants 255
Table 5.3 Scraper Down-scraping from Window 1 to 6 -- Measurements and Predictions with and
without Expansion Tilt 265
Table B. 1 Kohler Engine Specifications and Modifications 297
Table C. 1 Surface Roughness and Protrusion of Operable LIF Windows Measured After the
Experiments 315
CHAPTER 1: INTRODUCTION
The understanding of lubricant behavior within the piston/ring/liner (PRL) system as affected by oil properties, ring and piston geometry, and engine operation is crucial for improving engine performance while mitigating costs. Reducing midstroke friction, endstroke wear, and oil consumption is a challenge in view of the modern engine and the increasing lubricant requirements demanded by future engine designs.
To study the complex lubricant behavior, the Laser Induced Fluorescence (LIF) system has proven to be a reliable and accurate diagnostic tool for measuring the oil film thickness (OFT) within the PRL system. The focus of this project is to study LIF OFT measurements acquired from a production spark-ignition (SI) engine. OFT along the free liner and under the rings and the oil distribution between the rings and along the skirt for several lubricants are studied at different liner temperatures, engine speeds, and load conditions and from different locations along the cylinder liner. In addition, to aid in the data analysis and interpretation, predictions from the most recent OFT model developed at MIT are compared to OFT measurements along the free liner and under the rings.
1.1 BACKGROUND
Oil properties, ring and piston geometry, and engine operation influence lubricant behavior within the PRL system which is intimately related to engine performance including friction, wear, oil consumption, and emissions; thus, understanding lubricant behavior in the PRL system of the engine is imperative. Friction generated from lubrication between the piston assembly -- namely, the rings and skirt -- and the cylinder liner generally account for about fifty percent of the total engine mechanical loss [1]. Estimated by Coy et al. [2], viscometric and boundary friction effects can reduce fuel consumption by 3 - 5 percent.
Wear, especially that occurring at top center (TC) of the late compression and early expansion strokes because of high pressures and temperatures, has shown to change
the original unworn ring geometry [3]. Thus, the rings' function for lubricant control is affected as well.
In addition to the relatively thin oil films under the rings, large oil volumes exist along the piston assembly between the rings and along the piston skirt. In some cases, oil movement and transport between the different regions of the PRL system has been shown to account for 80 - 90 percent of the total oil consumed by the engine [4]. The remaining oil is consumed through other routes such as the engine overhead system and positive crankcase ventilation (PCV) [5]. Additionally, the amount of oil film left on the free liner and recirculation of oil flow within the piston assembly is crucial for studying oil absorption/desorption of hydrocarbons from fuel [6].
In view of the modem engine, reducing midstroke friction, endstroke wear, and oil consumption is a challenge. Improvement becomes even a tougher task as lubricant requirements for future engine designs increase. The trend toward higher power density, higher engine speeds, reduced oil consumption, extended maintenance periods, reduced quantity of oil in the sump, and longer oil drain intervals impose severe oil stress and require outstanding lubricant performance.
To facilitate the design of the PRL system for improving engine performance, model development is important as well. In addition to validating model accuracy with consistent, reliable, and accurate film thickness data, extending the understanding of the mechanisms and processes involved in lubricant behavior to improve and build more robust and comprehensive predictive tools is a high priority for those in the industry.
The lubricant behavior within the PRL system is complex. Although oil flow under a ring can often be approximately modeled as locally fully developed flow at midstroke and may appear quite simple at a first glance, the boundary conditions (which often depend upon other rings' behavior), ring dynamics (including effective ring pressure, twist, and flutte- affected by gas flow, friction, and inertia), mixed
(hydrodynamic and boundary) lubrication, and piston tilt creating azimuthal differences severely complicate the understanding of lubricant behavior under and around the rings. Along the lands, predicting oil transport between local regions of the PRL system and, subsequently, oil consumption is even more complicated and is most likely even coupled
to ring-liner lubrication, at least for the oil control (OC) ring. Therefore, lubricant behavior is very intricate and engine-specific.
To study the complex lubricant behavior the Laser Induced Fluorescence (LIF) system has proven to be reliable and accurate and is widely used in the industry for measuring the oil film thickness (OFT) within the PRL system. The nonintrusive fluorescence technique can accurately measure oil thicknesses from tenths of a micron up to 100 microns -- tailored quite nicely for oil under the rings and between the piston lands and liner.
1.2 PREVIOUS WORK
This project is a continuation of the work performed at MIT by Goro Tamai (MS, '95) [7]. His experiments were carefully and consistently conducted on a SI engine using the 1-D LIF system. Diligent attention was given to window-to-liner flushness and a strong and an accurate LIF signal. Very few researchers have taken LIF OFT measurements in an engine at multiple window locations. Although six quartz windows were installed, only four windows were proven operable -- three at midstroke and one near bottom dead center (BDC).
The five lubricants -- three monogrades and two multigrades -- were selected with particular emphasis placed on the oil set spanning a wide range of viscosities. If the viscosity range is not wide enough, effects of incremental viscosity differences of test lubricants on OFT can be masked by the uncertainty of the LIF measurement technique. This problem was just one of the difficulties encountered by Deutsch [8], Tamai's predecessor, and helped hinder conclusive results.
After developing the test engine -- a one-cylinder, SI Kohler engine -- steady-state experiments were conducted with selected lubricants. OFT measurements within the PRL system were taken at the four operable windows. Cylinder liner temperatures, lubricants, and engine speed were varied. In addition to the measurements taken during firing conditions at moderate temperatures of 100, 80, and 60°C, motored data was
collected at low temperatures of 60 and 40°C. After a quick MOFT analysis of a fraction of the data collected, Tamai concluded with the following fired MOFT results.
· MOFT differences were significant among the three LIF windows at midstroke. MOFTs were greatest on the thrust side where the cylinder wear was found to be most extensive. (He claimed differences were primarily caused by bore distortion.)
* MOFT differences were significant along a stroke from midstroke to near BDC -- a factor of 1.5 times higher at midstroke.
* MOFT under the rings increased with viscosity.
* The shear-thinning effect under the rings is noticeable between the monograde SAE-50 and the multigrade 10wSAE-50 oils.
* With decreasing cylinder liner temperature, MOFT increases with the decrease in viscosity except for SAE-50. For this high-viscosity lubricant, the MOFT-temperature relationship is reversed compared to the trends of the other lubricants. (Tamai conjectured that this trend reversal could be caused by "oil pumping difficulty" because of the lubricant's high viscosity.)
· As engine speed increases from 1800 to 2500 rpm, MOFT increases as well.
These MOFT results were compiled from only a fraction of the data set -- less than 20 percent; unfortunately, Tamai did not have sufficient time to reduce, show, and interpret the MOFT data in depth, let alone the oil distribution within the ring pack and along the skirt. Also, no quantitative comparisons with OFT modeling was performed. This thesis attempts to confirm Tamai's OFT findings for the entire database in a more comprehensive manner including analytical and numerical analyses. Additionally, the oil distribution along regions of the ring pack and skirt is another major subject of investigation.
1.3 PROJECT OBJECTIVES
The central focus of this project is to accurately reduce and conduct an in-depth analysis of all the oil film measurements acquired from the one-cylinder, Kohler gasoline engine. Emphasis is placed on showing and interpreting the magnitudes and trends of the oil behavior under the rings (MOFT) and along the PRL regions between the rings and along the piston skirt and cylinder free liner. Assisting with the interpretation, MIT's
RINGPACK-OC and FRICTION-OFT models have been applied where appropriate, and
their accuracy and range of applicability have been assessed as well.
1.3.1 Oil Film Thickness (OFT) under the Rings and along the Free Liner
The minimum oil film thickness (MOFT) under the rings -- top and scraper rings and the upper and lower segments (or rails) of the OC ring -- and the OFT left by the rings on the cylinder free liner are the focus of this section. The objectives for the MOFT study for the experimental results accompanied by the model predictions from the
FRICTION-OFT model are to address the following topics.
1. Stroke-by-stroke differences
2. Cylinder liner temperature and lubricant effecis
a. Fired for moderate liner temperatures -- 60, 80, 1 00°C b. Motored for low liner temperatures -- 40 and 60°C 3. Speed effects
a. Engine speeds from 1800 to 2500 rpm b. Midstroke (win-l) to near BC (win-6) 4. Shear Thinning and Thickening
5. Azimuthal effects at midstroke
To aid in the interpretation of the data, the current FRICTION-OFT model developed at MIT [9] is applied. (As an input to this model, results from the
RINGPACK-OC model [10] which predict land pressures from the measured cylinder
As a natural outcome of the MOFT study, another objective is FRICTION-OFT model verification. Goals are to
1. confirm the physics captured by the model,
2. assess the model's accuracy -- both magnitudes and trends, and 3. assess the range of applicability.
1.3.2 Oil Distribution Along the PRL Regions within Ring Pack and along the Piston Skirt
A reasonable model predicting the oil distribution along the PRL system has not been developed yet. Thus, aside from applying an appropriate model, the objectives for the study of oil distribution along the PRL regions consist of those from the MOFT study and more. In addition to those MOFT topics 1-4, the objectives for oil distribution also include
6. Load effects between fired and motored at 60°C 7. Observing oil transport
a. Oil squeezing between rings and grooves b. Down-scraping of scraper ring
c. Oil behavior along the thrust-side of the piston skirt d. Inertial influences and viscosity restriction
Both models are applied to the oil distribution data where appropriate for interpretation and verification such as predicted ring lift from empirical oil squeezing in the grooves, gas flows on oil dragging (especially for oil movement within the grooves and along lands), and scraper down-scraping along a stroke.
1.3.3 Comprehensive Compilation of Accurate OFT Data
By careful record-keeping and comprehensive documentation, the author intends this thesis to be a valuable reference for current and future researchers in the field of engine lubrication. Especially for oil transport and consumption, the least understood
area in the PRL system, an explicit display of much of the data could assist the model developer to identify key oil transport and consumption routes and processes.
CHAPTER 2: TEST LUBRICANTS
Heavily influential on lubricant behavior within an engine are the lubricant properties. A lubricant within the PRL system is subjected to a the wide range of severe conditions. In addition to the high temperatures and their effects on viscosity variation and volatility, oils providing lubrication under the rings experience shear rates through a very wide range, from zero at the endstrokes up to magnitudes of 107 1/s at midstroke [11]. And depending on the lubricant formulation, a lubricant's behavior may not be Newtonian, but its viscosity may change above a critical shear rate. These special types of lubricants are called multigrades and are characterized by a less pronounced viscosity-temperature relationship compared to the monogrades.
The five tested lubricants consist of three monogrades and two multigrades. The three monograde lubricants are SAE-1OW, -30, and -50 and cover an expansive kinematic viscosity range from 6.3 to 19.4 cSt at 1000C. The two multigrades, SAE-10w50n and SAE-10w50k, have slightly different viscosities; 'n' and 'k' represent 'thin' and 'thick' viscosities, respectively, and only differ by 1.5 cSt (9.9 - 8.4 high-shear kinematic viscosity) at 100°C. However, their large difference is their shear stabilities;
SAE-10w50n and -Ow50Ok have critical shear rates of 40,730 and 93,325 l/s, respectively.
2.1 TEMPERATURE DEPENDENCE OF VISCOSITY
Most fluids change viscosity as temperature changes. For the engine lubricants used in this experiment, kinematic viscosities change exponentially with temperature and can be curve fit by the Vogel Equation (eqn 2.1 ) [12].
v = Kexp(
T)
(2.1)v is the kinematic viscosity (cSt). K (cSt) is an dependent constant. Other oil-dependent constants include 01 and 02 with units of °C. Lastly, T (C) is the lubricant temperature at which the viscosity is being evaluated.
1000 . .4-I .C a C. c, L C .0-E CL C · e . 100 ) 10 d 40 60 80 100 120 140 Temperature (C)
Figure 2-1 Viscosity Versus Temperature for Four Selected Lubricants.
Lubricant Temperature, T (C)
/000o 80°C 600C 400C
SAE-1OW 6.3 10.0 17.9 37.0
SAE-1OW/SOn 8.4 (17.1) 14.6 (29.6) 27.7 (56.2) 58.9 (119.4) SAE-1OW/50k 9.9 (19.1) (not tested) 35.8 (69.0) 80.2 (154.6)
SAE-30 11.6 (not tested) 41.3 98.6
SAE-50 19.4 36.9 81.1 216.1
II ~ ~ ~ .I
Table 2.1 Kinematic Viscosity (cSt) Versus Temperature for All Five Lubricants. (For the multigrades, viscosities in parentheses are low-shear values.)
The viscosity-temperature relationship for four of the five oils is shown Figure 2-1. (SAE-lOw5Ok was left out for clarity; its viscosity-temperature relationship is just slightly higher than SAE-lOw50n. Furthermore, only high-shear viscosity measurements were made at 150C; the remainder of the high-shear, viscosity-temperature curve is
estimated from the low-shear relationship.) Immediately following this figure is Table 2.1 showing all five lubricants and their high- and low-shear viscosities for all liner temperatures within the test matrix introduced in Chapter 3.
Several important observations can be made from this curve and corresponding table. First, for the multigrade 10W/50n at low-shear, notice the less pronounced viscosity-temperature relationship compared to SAE-50.
Secondly, over the array of lubricants at a particular temperature (defined as a lubricant effect), viscosities range fiom about 6 to 19 cSt at 1000C -- over a 200 percent increase from thin to thick lubricants; at 400C, the range is 37 to 216 cSt -- slightly less than a 500 percent increase. Therefore, differences due to changes in viscosity should definitely be noticed in the OFT measurements.
Lastly, over the array of temperatures for a particular lubricant (defined as the temperature effect), viscosity increases more rapidly with each decreasing step in temperature necessitating the log scale for the ordinate in Figure 2-1. Thus, greater OFT differences should occur at temperature steps for lower temperatures compared to higher temperatures.
2.2 SHEAR DEPENDENCE OF VISCOSITY
Although the main difference between multigrade and monograde lubricants is their viscosity-temperature relationship, they also differ in their viscosity dependence upon high shear. When multigrades are subjected to a shear rate higher than their critical rate, they experience shear-thinning -- a decrease in viscosity.
The shear stability of multigrade lubricants differ depending upon the types of VI improvers added to them [12]. Although their viscosities do not differ much, the two multigrades, SAE-1OW/50n and -O1W/50k, have critical shear rates, , of 40,730 and 93,325 /s, respectively -- an increase over a factor of two The critical shear rate is in the middle of the viscosity transition from low-to-high shear regime. Mathematically, the
local shear rate, y, is defined as the partial derivative of local fluid velocity with respect to the radial distance away from the cylinder liner.
au
Y = - (2.2)
0y
For ring/liner lubrication, this local shear rate can be approximated by an average shear rate,y, defined by the ring sliding speed divided by its MOFT. As the ring accelerates and the multigrade lubricant exceeds its critical shear rate, the oil experiences a decrease in viscosity. This viscosity transition to a lower viscosity is called shear-thinning which can be represented by the Cross Equation [12].
1+ Vo
V.I
I,v = o (2.3)
1+
The subscripts o and oo represent the low and high shears, respectively, and the exponent m is an oil-specific constant. As m increases, the viscosity transition from low to high shear decreases. This relationship between viscosity and shear rate for the two multigrades, SAE-lOW/50n and -10W/50k, is shown in Figure 2-2.
1.) 18 >x 16 o 14
,.
12 10 81E+02 1E+03 1E+04 1E+05 1E+06 1E+07
average shear rate, (l/s)
Figure 22 Kinematic Viscosity Versus Average Shear Rate for SAE10W/50n and -1 OW/50k from the Cross Equation.
During most of the piston motion, except around the endstrokes, the piston rings experience high shear rates on the orders of 106 and 107 -- shear rates definitely in the high-shear viscosity regime. Figure 2-3 shows the OFT insensitivity to low-shear viscosity during the majority of a stroke including midstroke (at window 1) and near BC (at window 6) for the Kohler engine. Incurring the lowest speed near BC (at window 6), the top ring still subjects the multigrades to shear rates well above any significant change in viscosity due to shear ex .nplified by SAE-lOW/50n in Figure 2-3 (a). (The actual shear behavior of SAE-1OW/50n corresponds to the solid curve for j = 0.49 =
(high-shear)/(low-shear viscosity). The dotted lines denote lower low-shear viscosities while keeping the high-shear value constant.) The lowest shear experienced near BC is 2.26x10⁶ 1/s -- well above any significant viscosity change from shear. (The top ring subjects SAE-10W/50n to the lowest shear when the top ring MOFT is high; the highest MOFT is 0.8 tm for 2/3 load at 60°C.)
Figure 2-3(b) shows the predicted OFT insensitivity of the free liner and top ring to the low-shear viscosity of SAE-1OW/50n from the FRICTION-OFT model. For any practical purposes, OFTs change negligibly with very large changes in low-shear
viscosity. This fact remains true for the remaining rings (which induce even higher shear rates) and is why the high-shear viscosities are used to analyze OFT magnitudes and trends in Chapter 4.
This high-shear, low-viscosity behavior is desirable for reducing friction around midstroke where lubrication is mostly hydrodynamic, if not all, and wear is not a problem. However, as piston and ring sliding speed decreases around the endstrokes, mixed and pure boundary lubrication often occur, and, here, a higher viscosity is desirable to maximize ring lift and minimize squeezing under the ring to reduce endstroke wear. A multigrade can provide this function as it shear-thickens transitioning below its critical shear rate. So a multigrade provides the best of both worlds -- reducing midstroke friction and endstroke wear.
10 10 17 16 C.) > 15 .n 14 U2 13 .o 12 _) 11 r4 10 9 8
1E+02 1E+03 IE+04 1E+05 I E+06 1E+07
average shear rate, (l/s)
(a) Viscosity Versus Shear of SAE-10W/50n
1 C 1.00 E 0.75 L. 0.50 0.25 0.00
-I---Free Liner Top Ring
Lubricant
Figure 2-3 OFT Insensitivity to Low-Shear Viscosity of SAE- 1 OW/50n. (a) Viscosity Versus Shear (b) Predicted OFT Insensitivity for Free Liner and Top Ring at Midstroke.
o (high-shear)/(Iow-shear) = 0.49 Il (hieh-shear)/(low-shear) = 0.75---i s a-- ./( \- ..-s .... (high-shear)/(ow-shear) = 1.00 1 1. j I I
_
I r _ .2.3 OIL DEGRADATION
Over extensive periods of engine operation, the quality of the oil deteriorates, whereby oil properties change and the oil's proper function to lubricate diminishes; this process is called oil degradation. Because of possible oil degradation -- from the harsh mechanical stresses and foreign debris such as fuel contamination and worn materials --and LIF dye, the lubricant properties could have changed during our experiments. However, the lubricants were analyzed before and after the experiments, and no changes were evident.
CHAPTER 3: ENGINE AND TEST MATRIX
The production SI engine was modified to incorporate six LIF windows and instrumentation for data acquisition and engine control over the extensive test matrix.
3.1 TEST ENGINE AND WINDOWS
The Kohler CH-14 single-cylinder SI engine was only modified by installing six windows, a retrofitted water jacket, two thermocouples in the cylinder liner, and one cylinder pressure transducer, and a shaft encoder. To allow optical access of the LIF system, the cylinder liner was machined for six fused quartz/silica windows: four installed about 90° azimuthally around midstroke and one near each endstroke on the major-thrust side. Figure 3-1 shows the exact location of the windows azimuthally and along a stroke.
(Further description of the complete experimental apparatus may be found in Appendix B and other theses [7, 8]. Detailed geometry and microgeometry of the PRL system may be found in Appendix C. Detailed engine kinematics and dynamics for the Kohler engine may be found in Appendix D. 1.)
Win. #1 Win. #2 +3
Thr
Win. Win. #3dimensions
inmilimeters
Fu
31
87.0
- --i
Figure 3-1 LIF Probe/Window Locations and Number Convention of Kohler Engine [8]
I I
3.2 OPERATING CONDITIONS AND TEST MATRIX
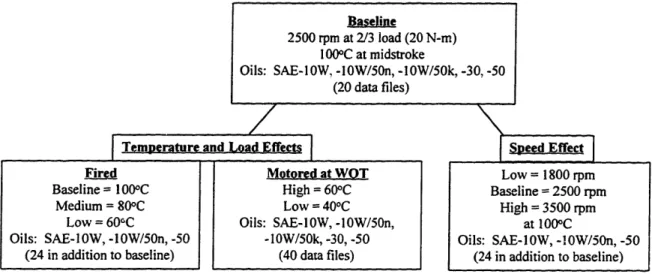
The test matrix shown in Figure 3-2 was designed to study temperature, lubricant, and engine speed effects on oil film thickness for an array of five lubricants spanning a wide viscosity range. Additionally, the fired and motored conditions (the load effect) can be compared at 600C. (Motored cases were run at wide-open throttle (WOT) for 2500 rpm.) For each test case, LIF measurements from the four operable windows also provide insight to azimuthal effects around midstroke and OFT differences along a stroke.z.
The baseline operating condition is fired at 20 N-m (approximately 2/3 of full load with a bmep of 631 kPa), 2500 rpm, and a midstroke liner temperature of 100°C. This load and speed were selected because the engine and dynamometer operated most smoothly and consistently at this condition. The midstroke temperature of 100°C was selected for two reasons. First, this temperature is representative of a typical engine in field use. Secondly, oil properties are conveniently measured at this temperature [7].
Baseline
2500 rpm at 2/3 load (20 N-m) 1 00"C at midstroke
Oils: SAE-1OW, -10W/50n, -IOW/50k, -30, -50 (20 data files)
Temperature and Load Effects Speed Effect
Figure 3-2 Test Matrix for Kohler Engine with Four Operable LIF Windows. (Three windows at midstroke and one near BDC.)
Fird___ Motored at WOT
Baseline = 1 00C High = 600C Medium = 800C Low = 400C
Low = 60°C Oils: SAE-1OW, -10W/50n,
Oils: SAE-I OW, -10W/50n, -50 -I 0W/50k, -30, -50
(24 in addition to baseline) (40 data files)
Low = 1800 rpm Baseline = 2500 rpm High = 3500 rpm at 100°C Oils: SAE-10W, -!0W/50n, -50 (24 in addition to baseline)
CHAPTER 4:
OIL FILM THICKNESS (OFT) ALONG THE FREE LINER AND UNDER THE RINGS
Lubrication under the rings not only generates close to half of the PRL-assembly friction and contributes to substantial wear but leaves an oil film on the free liner above the piston after it passes. The magnitudes and trends of the free-liner oil film thickness (OFT) and ring minimum oil film thicknesses (MOFTs) are the focus of this section.
First, a brief orientation of how the MOFTs are manually fitted from a 10 cycle-trace average is presented followed by a criterion from a covariance correlation used to help determine whether OFT differences are significant or not. Secondly, all of the baseline results from the four windows are shown and represented by stroke as well as a justified stroke-averaged representation. Shown both experimentally and theoretically, the OFT hierarchy along the ring pack to the free liner for any single lubricant case is explained and shown from inter-ring and free liner OFT dependence via lubricant behavior. Then, the effects of the different lubricants are investigated and an OFT-viscosity relationship is found characteristic of hydrodynamic lubrication. Additionally, any stroke-to-stroke differences (or lack thereof) within the cycle are shown and interpreted.
Thirdly, results off the baseline condition are addressed including effects from different liner temperatures, lubricants, load, and speeds are investigated. Related to piston speed, any shear thinning or thickening are studied along a stroke from window 1 to window 6. All results consider liner location azimuthally around midstroke and axially between midstroke and near bottom center (BC) in view of the calibration accuracy between cases addressed in Appendix D. The last section before the OFT summary directly addresses the bore distortion effects on OFT at midstroke.
Additionally, throughout this study, predictions from MIT's FRICTION-OFT model are compared with the results. A model verification summary for ring MOFTs and free-liner OFT is presented at the end of the chapter.
4.1 DATA REDUCTION FOR RING FITTING AND FREE-LINER OFT
Once proper calibration using individual LIF traces is completed (refer to appendix D), ten consecutive cycles from one case are averaged into one OFT trace called the 10 cycle-trace average exemplified in Figure 4-1(a). From cold piston-assembly geometry, the approximate ring locations are known along the piston. The top ring, scraper, and upper and lower OC segments are located about 6.0, 11.8, 14.7, and 17.0 millimeters, respectively, from the top of the crown land; the free-liner is calculated by taking the average OFT along the first five millimeters above the top of the crown.
Unlike the automated free-liner OFT calculation, the ring fitting is manual. Although very time consuming, a manual approach proves to be more accurate for the rings and is therefore favored over an automated approach. Although the approximate ring and segment distances are known from cold geometry of the piston assembly, the combination of ring and groove clearances, ring twist, piston tilt, and thermal expansion precludes exact determination of the minimum point along the piston or abscissa in Figure 4-1 (a). Secondly, noise in the signal, especially for the top ring, sometimes precludes a clear fit and requires experienced discretion from the experimenter in order to fit the ring properly to the trace. In this instance, an automated approach could just pick a high or low point in the signal which is just noise and provide a less accurate result. For these reasons and others [7], an automated approach for ring fitting was ruled out.
o 1-E_o izt
0
eg©
-2 0 2 4 6 8 10 12 14 16 18Distance from Top of Crown (mm)
(a) Example of Actual Ring and Segment Geometries Fit Within an OFT Trace
E LL U._ C LL 3.5 3.0 2.5 2.0 1.5 1.0 0.5 0.0
free- top ring scraper upper lower
liner OC rail OC rail
(b) Free-Liner OFT and Ring MOFTs Reduced from the Example Trace in Figure 4.1(a) Figure 4-1 Ring Fitting and Free-Liner OFT for Intake Stroke at Window 4. (a) Actual Ring and Segment Geometries Fit Within an OFT Trace (b) Free-Liner OFT and Ring
MOFTs
Displaying OFT measurements from the example trace in Figure 1(a), Figure 4-1(b) shows the actual MOFTs of the ring pack, free-liner OFT, and their corresponding standard deviations which include human error for the manual ring fits, actual cycle-by-cycle variations, noise, and any small precision lost from the dynamic range of the data acquisition system (DAS) system (which includes a worst case of 0.08 mm increments determined in Appendix B). This measure of uncertainty provides an indication of the precision of the MOFTs and determines how significant differences are between two measured MOFTs; if standard deviations corresponding to two different MOFTs overlap, the significance of the MOFT difference is questionable. For example, in Figure 4-1(b) the MOFTs of the top and scraper rings are slightly different but the overlapping standard deviations suggest that this difference is suspect. In fact, soon to be explicitly shown for all of the results from the entire database, the MOFT difference between these two rings is insignificant in view of the standard deviation. Conversely, the MOFTs of the upper and lower OC segments are usually significantly different; lower segment MOFTs are greater than the upper segment MOFTs.
The standard deviations for the MOFTs are not determined directly for each case but indirectly from a covariance correlation
Coefficient of Variation (COV) = c = 0.18 (4.1) MOFT
The value of 0.18 was determined from some measurements from two independent data sets from the Kohler engine. (Standard deviation is calculated by the equation presented in Appendix F.) Figures 4-2 (a) and (b) show the linear regressions of the measurements from the two lubricant databases -- Lubricant Set One (the current database) and Lubricant Set Two (a previous database [7, 8]). Although this COV correlation was only determined from the major-thrust side at window 1, the measurements from Lubricant Set One span the extremes from the thin SAE-1OW to the thick SAE-50, over cylinder liner temperatures from 40 to 100°C, and during different load conditions -- fired and motored. Each data point on the figure was calculated from ten manual fits from one ring or segment during a cycle for a particular stroke. Therefore, this COV correlation applies to the measured MOFTs for a particular stroke and ring. Each lubricant case represents 16
data points -- four per stroke from the rings and segments and four strokes per cycle. A total of 80 data points from Lubricant Set One make up Figure 4-2(a).
Instead of direct measurements of the standard deviation from the manually fitted MOFTs for all the cases in the current test matrix (Lubricant Set One), this COV correlation is used because the direct method for all the cases are too labor intensive and time consuming. Soon to be confirmed in the oil distribution analysis in Chapter 5 where an automated approach was used to average film thicknesses over regions along the piston assembly and free liner, the standard deviation for free-liner OFT is typically about half of that deduced from the MOFT COV correlation.
2.0 1.8 1.6 1.4 1.2 1.0 0.8 0.6 0.4 Sta 0.2 0.0 - least squares
o SAE-1OW @ 2/3 load and 100 C
o SAE-1 OW @ 2/3 load and 60 C
0 2 4 6 8
MOFT (mn)
10
(a) Lubricant Set One (the Current Database)
1.75 1.50 1.25 1.00 0.75 0.50 0.25 Sta 0.00 0 1 2 3 4 5 6 7 8 MOFT (mnm)
(b) Lubricant Set Two
Figure 4-2 Covariance Correlation: Standard Deviation Versus MOFT from Window 1 from Two Independent Studies (a) Lubricant Set One (the current test set from midstroke liner temperatures of 40 to 1000C using the thinnest and thickest lubricants spanning the viscosity range of 6.3 to 216.1 cSt and for fired and motored conditions) (b) Lubricant Set Two (2/3 load at 1 000C liner temperature for lubricants spanning the
viscosity range of 7 to 10 cSt) - least squares o PZL-8 o PZL-A * PZL-9 a PZL-C 1
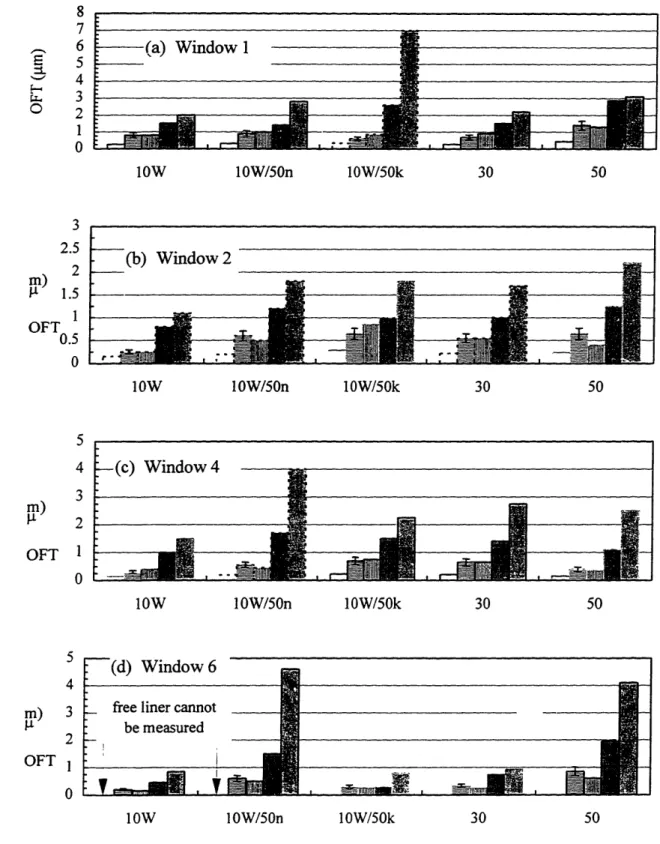
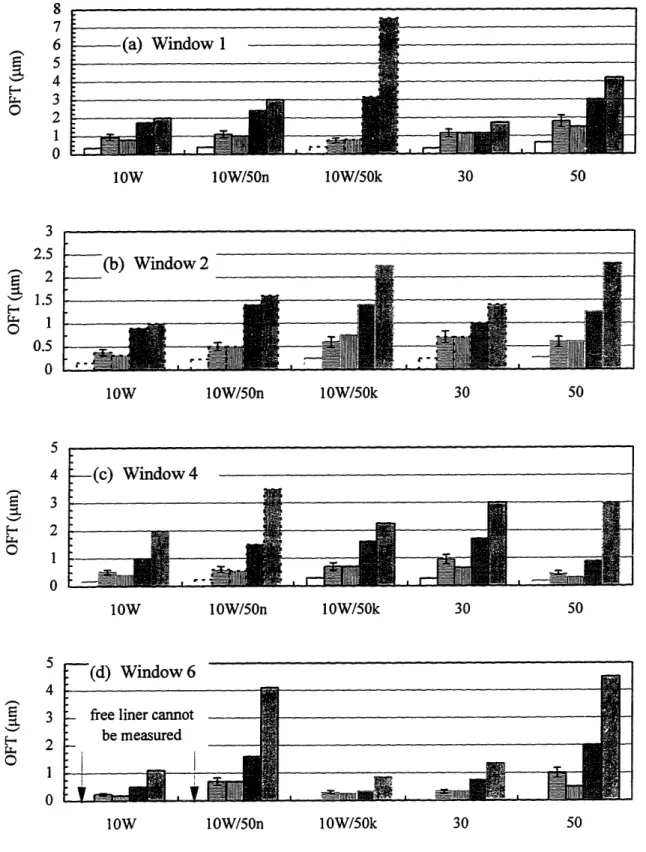
4.2 BASELINE RESULTS
All of the OFT measurements are shown in this section for the baseline condition addressed within the test matrix in Figure 3-2. The five lubricants were tested within the engine operating at 2/3 load, 2500 rpm, and 100°C at midstroke, and LIF measurements were acquired from the four window locations -- three azimuthally around midstroke corresponding to windows 1, 2, and 4 and one window (6) near BC on the major-thrust side of the bore. In this order, the data corresponding to these windows are shown -- first, for the stroke-by-stroke averaged OFTs shown in Figures 4-3 (a) - (d) and second, for each stroke starting at the intake and corresponding to Figures 4-4, 4-5, 4-6, and 4-7, respectively. For each window (or figure) there are five clusters of data corresponding to the five lubricants. Each lubricant cluster displays OFTs starting with the free liner and continuing through the ring pack from the top ring to the lower OC segment.
Leading to the increasing OFT hierarchy observed within every lubricant cluster (or case), an analysis of film thickness under different rings (or effects of on ring on another) and along the free liner is addressed in the first subsection (section 4.2.1) which will facilitate understanding of stroke-by-stroke and stroke-averaged behavior for the remaining subsections.
Each lubricant cluster represents one calibrated case and, thus, one calibration coefficient. These calibration coefficients have three different levels of calibration accuracies, and, therefore, each cluster falls within one of three categories of calibration accuracy:
I. Accuracy within plus or minus 5 percent of measured OFT. These lubricant clusters
are outlined with solid black lines.
II. Questionable accuracy of plus or minus 5 percent of measured OFT Clusters are
outlined with dotted black lines.
III. Accuracy worse than 5 percent of measured OFT. Clusters are outlined with solid light gray lines (which sometimes looks like no outlines at all).
The actual calibration coefficients and calibration accuracies for the entire test matrix are presented and explained in further detail in Table D. 1 in Appendix D.
![Figure 3-1 LIF Probe/Window Locations and Number Convention of Kohler Engine [8]](https://thumb-eu.123doks.com/thumbv2/123doknet/13977945.454129/33.906.180.725.101.937/figure-probe-window-locations-number-convention-kohler-engine.webp)