Application of Product Family Research and Development
Metrics in a Power Systems Manufacturing Environment
By Maninder Singh
B.S. Mechanical Engineering (1999)
University of Dayton Dept. of Mechanical and Aerospace Engineering
Submitted to the System Design and Management Program In Partial Fulfillment of the Requirements for the Degree of
Master of Science in Engineering and Management at the
Massachusetts Institute of Technology
February 2016
@ 2016 Maninder Singh All rights reserved
The author hereby grants to MIT permission to reproduce and to distribute publicly paper and electronic copies of this thesis document in whole or in part in any medium now known or
hereafter created.
Signature reda(
Signature of Author Certified by_ Accepted by+ MASSACUSETTS IN~STITUTE OP TECHNOLOGYJUN 2
3
2016
cted
Maninder SinghM.I.T. System Design and Management Program December 1 0th 2015
Siqnature redacted
James M. Utterback David J cGrathjr (1959) Prof. of Management & Innovation Thesis Supervisor M.LT. Sloai'School of Management
Sianature redacted
Patrick Hale Director M.I.T. System Design and Management Program
Application of Product Family Research and Development
Metrics in a Power Systems Manufacturing Environment
By Maninder Singh
Submitted to the System Design and Management Program on December 7th 2015, in Partial Fulfillment of the
Requirements for the Degree of Master of Science in Engineering and Management
ABSTRACT
Without objectively measuring the process of innovation, one cannot ensure whether the research and development expenses serve the right benefit. In order to be successful in generating revenue it is imperative for research and development functions to assume a broader view in developing technology for new products. Planning for the right product platform and family should not be limited to only market application for derivative products but also planning for successive generations of product platforms and derivative products. This topic explores a method documented in literature from a variety of industries ranging from power tools to medical devices by using the correct metrics to make the right level of business and product architecture decisions.
The method includes defining metrics for Effectiveness, which is a measure of product success in the market place, and Efficiency, a measure of successful utilization of the corporation's product development resources. The utilization of the proposed method was applied to four product families, which include twelve different products over two release cycles in the Diesel Power Systems industry. The metrics were analyzed in combination and further guidance on the usage of metrics was developed. When applied appropriately, the metrics can help product planners and product line architects to manage and assess the right level of technology
integration from past and present product platforms.
The use of Efficiency and Effectiveness metrics allows business leaders to better assess their product planning strategies on a continuous basis. It also allows for a better understanding of how historical decisions impacted the outcome of past product architecture with clarity. However, having measures in place isn't sufficient, this work explores the need for a better communication and alignment of business process between Research and Engineering and sub-business units to better develop the right technology integration and maturation of future products.
ACKNOWLEDGEMENTS
I want to thank my family for all the support and encouragement. My late father, Karam Singh, and my mother, Manjeet Kaur who have always thought me to keep God in mind while achieving life valuable lessons. I dedicate this to the both of you! To my siblings, thank you for the moral support your encouragement that was much needed during this phase in my life.
I would like to extend my sincerest thanks to Cummins, Inc. for sponsoring my research, allowing me to expand my knowledge base in Systems Engineering and providing the opportunity to practice my craft every day.
To Aracely Estrada and Adam Rooks, thank you for your efforts in obtaining the right information every time. Thank you for your encouragement also and being patient with me, you made this research work possible!
I want to extend my gratitude to Ms. Karen DeSanto who was my initial sponsoring Executive Leader. I truly appreciate the confidence you bestowed upon me to pursue better understanding of System Thinking.
I also want thank the many leaders, employees, peers and the CTC Quality group, who made it possible to conduct my research and enabled me to balance work and school; particularly, Cummins R&T Vice President Dr. Wayne Eckerle, R&T , and Dr. Roger England my supervisor. Mr. Tom Kitterman, CMI Program Manager, for your thoughts and review on this work. My sincerest gratitude to Stephanie Goerges for her guidance, knowledge and encouragement to pursue excellence in system thinking. Your guidance has proven to be invaluable.
To the Director of SDM at M.I.T., Pat Hale and my Thesis Supervisor Professor James M Utterback, Professor of Management and Innovation, M.I.T Sloan School of Management, for changing the way I think about Technology Strategy and imparting the knowledge of System Thinking.
Contents
Chapter - Introduction... 9
Context & M otivation... 9
Thesis Objectives... 1 1 Chapter 2: Literature Research ... 16
N ew Product D esign and Developm ent... 16
Product Developm ent M etrics... 17
M etric Fram ew ork ... 20
Platform Efficiency and Effectiveness M etrics ... 21
Related M etrics... 23
Sum m ary of Literature Search... 24
System s Theory ... 25
Chapter 3 -Case Study ... 26
General Focus of Study ... 26
D ata A nalysis ...
30
Analysis of Integrated Effectiveness and Efficiency Measures ... 37
Influencing Factors... 40
Chapter 4 - Integration of M etrics ... 43
Product Planning and D evelopm ent Processes... 43
Risk A ssessm ent ... 46
Guidelines and Interpretations of Effectiveness and Efficiency Measures ... 53
Chapter 5 - Recom m endations... 57
Recom m endations to Sponsoring Com pany... 57
Comparison of Recommendations to Neely et al. Metric Framework ... 62
Future Research ... 63
Conclusion ... 67
Table of Figures
Figure 1: High Level Product Planning Process showing typical input and output of the process ... 2 6
Figure 2: Platform and Derivative Programs Evaluated over three Launch Cycles... 28
Figure 3: Current Process Metric: Revenue as a Function of Spend for 12 Programs ... 30
Figure 4: Comparison of Effectiveness per Meyer et.al. of Product Platforms and Derivatives.. 32
Figure 5: Technical Spend Ratio of Derivative to Parent Platform per Meyer et al... 33
Figure 6: Plot of Effectiveness and Efficiency by Product over three launch periods. These values are generated using the modified Efficiency calculation method. High variance are observed more on the Efficiency value compared to only one value with high Effectiveness v alu e ... 3 7 Figure 7: Existing and Proposed Derivative Structures, from the initial left to right upon the availability of Effectiveness and Efficiency Index. ... 38
Figure 8: P Diagram Identifying Factors that affect business goals... 41
Figure 9: Product Life Cycle Development and Management ... 43
Figure 10: Generic Process on Establishing a Product Plan in a Large Corporation ... 47
Figure 11: A Generic Control Loop Diagram using STPA Approach... 47
Figure 12: Table of Synthesized "Hazard" to its corresponding business "Accident" STPA ap p ro ach ... 4 9 Figure 13: Improved Hierarchical Control Structure... 51
Figure 14: 9 Box Classification for Effectiveness and Efficiency... 55
Figure 15: Technology Development and Business interrelationship (Reference System Architecture -Crawly, Cameron, & Selva, 2013) ... 59
Figure 16: Comparison of Recommended requirements to Neely et al. Framework ... 62
Figure 17: Actual Technical vs. Forecasted Technical Spend on cases under study... 63
Figure 18: Approach for Research and Development Measurement of Development Cycle (m odified from W erner and Souder 1997)... 65
Pioneering research is closely connected to the company's most pressing business problems...
. Research must "coproduce" new technologies and work practices by developing. with
partners throughout the organization a shared understanding of why these innovations are important.
John Seely Brown (1991, pp. 103-104)
Chapter 1- Introduction
Context & Motivation
Cummins' roots are planted in soil nourished by innovation, persistence and a commitment to community. The fledgling firm was among the first to see the commercial potential of an unproven engine technology invented two decades earlier by Rudolph Diesel. Cummins has grown into one of the largest engine makers in both China and India, and for the past three years approximately half of the Company's sales have been generated outside the United States (Cummins Inc. 2015).
Cummins is no longer just an engine business, but a global power leader (Cummins Inc. 2015). Today Cummins power systems products span the many different market segments and displacements in on-highway, off-highway, and stationary applications with a vast range of power needs. The power range is about 45 - 2800 hp. Cummins Inc., is uniquely separate from traditional competitors in the power system by being a sole independent provider of power systems to Original Equipment Manufacturers (OEM) who, in many situations are also vertical integrated. There is a constant threat that OEMs will replace Cummins Powered product with their own. It's imperative for Cummins Inc. to be ever better that the competitors by being in tune with customer needs, leadership in technology development and best in class processes.
The diesel power system businesses have been traditionally cyclical in nature due to various external influences like government emissions regulations, United States Environmental Protection Agency (2015). As government emissions regulations change and variety of applications increases, it is imperative that Cummins Inc. understand how well architecture decisions impacts the bottom line of the enterprise and at the same time ensure customer needs are being met. Capability of the internal Product planning functional members and Technical Product Line Architects functional members to meet key performance objectives in a relatively fixed Sales Administrative and Research financial investment level poses a challenge to product
The primary aim of this study is to investigate the internal product development process, including its efficiency and effectiveness. The investigation consists of determining the correct processes and metrics that yield the desired return of investment from new product introductions. A method proposed by Meyer, Tertzakian, and Utterback (2002) in their journal titled "Metric for Managing Research and Development in the Context of Product Family" was applied to the Diesel Power Systems industry - Cummins. Inc. This proposed method has some strengths and some cautionary elements when considered for use in this industry. The proposed method was applied with some relevant modification in addition, an appropriate risk assessment was also preformed to the current planning process within the company in order to ensure these metrics are successfully integrated in the product planning and decision making phase. The process-oriented method can help Product Planners and Product Line Architects to manage and assess the right level of technology integration from past and present product platform and product family.
A family typically includes product platform, which shares common elements within the platform. As market needs change, products needs to change with different technologies and new product which, may be derivatives of existing products in the same platform or may form a new platform Tertzakian (1994). With a process and metrics driven method ensures that new product development entities within a firm develops the right future product platform and families that yields revenue and meet customer need year over year.
Thesis Objectives
At a time where industries are competing against one another for a profitable market share, the improvement to do so starts within the firms' respective process, capability and organizations. In order to compete in a profitable fashion, firms have to develop the right sequence of product family and platforms to meet customers need. Design of new product is frequently restricted by a firms existing capabilities in plant and manufacturing equipment. It is not surprising that developing a robust product platform has been a sustaining recipe for success for Cummins Inc. However, there is much room for improvement methods used in Cummins Inc. in the generation of new product platform and family to meet market needs. One of the most common methods applied in many processes is the use of performance metrics. Monitoring performance metrics ensures organizations carry out their objectives and move in a common direction - Flapper et al. (1996).
According to Artley, Will, D. J. Ellison, and Bill Kennedy (2001): "Performance measures quantitatively tell us something important about our products, services, and the processes that produce them. Performance measurements are a tool to help us understand, manage, and improve what our organizations and functions do!" Performance measures provides a deeper understanding if we are meeting our goals and if our customers are satisfied and or how and where do we need to improve.
Soumala (2004), states that there are at least two kinds of objectives that utilization of measures should be fulfilling. First, they should represent the states of the process being executed today and the second; it should provide the long-term guidance to a desire state. According to Ulrich and Eppinger (1995), in product development environment there are five different dimensions on how profitability can be achieved and used to assess performance development effort.
a) Product quality: Goodness of the product interpreted by different stakeholders, the ability to satisfy customers' needs, robustness, and reliability
b) Product cost: Manufacturing cost including spending on capital equipment, indirect cost caused by the product
c) Development Time: The time frame of the product development effort (determines how quickly the organization receives the economic returns from the efforts)
d) Development Cost: The amount of money invested in the product development
e) Development Capability: Have the product development effort and experiences associated with it enhanced the abilities of the development team to develop future products (development capability is an important asses the organization can use?)
Observing these rules, the first two elements in system language can be considered as an emergent property (Quality and Affordability) in the eyes of the customer, DeWeck (2011). The third element is a common metric utilized by many as a surrogate for return in investment. The last two (d & e) suggest not only the outcome of the system at work but also the effectiveness of the process of product development itself.
The suggested to measure the Effectiveness and Efficiency of the product development process is by using metrics as proposed by Meyer, Tertzakian, & Utterback (1997). The first metric is product family efficiency, i.e. "the ability to create a continuous stream of successful new products over extended period of time," Meyer et al. (1997). The second metric discussed in the papers is product effectiveness, i.e. "the attractiveness of these products to the firm's chosen market" (Meyer et al. 1997). Where a product family is defined as "a set of common product that share a common technology and address a related set of market applications", Meyer et al. (1997). A family can be a series of product platforms used in a market segment.
The purpose of this research is to determine:
-* How does Cummins Inc. become profitable with the application of these metrics in the power system industry?
* What are the potential pitfalls that can lead to mis-use of these metrics in the power system business?
e By applying the method, what are the areas that Cummins Inc. need to improve in order to be successful at product development and regeneration?
This study applies the method proposed by Meyer, et al. (1997) to the diesel power system business, specifically around four product families which include twelve different products over two release cycles. These product families span the on-highway and off-highway applications.
Chapter 2: Literature Research
New Product Design and Development
Corporations are always trying to maximize profitability by introducing new products. The need for new products has to be based on what customers truly need in terms of functions and features and of low cost and high quality, Clark and Fujumotto (1989), Cusumano and Nobeoka (1992), Wheelwright and Clark (1994), and Ulrich and Eppinger (2008). The ability to meet the need for the customer requires innovative ways to be incorporated in their respective product development processes, Utterback and Abernathy (1975) and Sood and Tellis (2005). This leads to attractive and appealing goods and services. In order to be successful at producing the right product, there has to be a structured approach using appropriate metrics along with a correct applicable framework, while leveraging the core strengths within the organization. Appropriate metrics alone isn't sufficient. The process requires a disciplined management oversight and a robust performance management system in place, to ensure respective product development teams make the right architecture selection and decisions successfully, Cooper (1990), Ellis
(1997), Neely et al. (1997), and Gooderham, G (2001).
A desirable property of architecture is that it enables a company to offer two or more products
that are highly differentiated yet share a substantial fraction of their components, Ulrich and Eppinger (2008). The differentiation plan should represent the number of version the product that will be different from the perspective of the customer and the market. Too much differentiation can also drive cost up from product proliferation. This is where commonality plan explicitly represents the ways in which different version of the product share the same architecture physically. This delicate balance between Differentiation Plan and Commonality Plan ought to be considered as another set of measures in the architecting plan.
Aside from product development focusing architecture differentiation for follow on product, industries are currently moving to enhance technical productivity and speed to market, Clark and Fujimotto (1989). The research focused on how to align top down business strategies to improve technical productivity, quality and lead-time.
Product Development Metrics
Many belonging to organization or functions often see metrics by nature as a negative element. It is seen as a negative element simply because people do not like their deliverables to be tracked, Pawar et al. (1999). This issue is explored more in depth by Pawar, et al. (1999), as the reason why this phenomena occurs is mostly due to poor metrics being used and management taking these measures as an absolute, and without caution of context. There are limitation to every measure defined and being used in the business, especially around product development and portfolio management.
There are three most common product development metrics. Development Time, Cost of Development, and Quality, Terwiesch et al. (1998), Atkins (1999), pmbok Guide( 2004), Terwiesch et al. (1998) also concluded that "the effect of development performance on business success was most significant in slow - growth market and in market with long product life cycles".
An in-depth survey study performed by Pawar and Driva (1999), indicates that there are five top product development metrics being used: total cost of project, actual cost of project as compared to budget, actual time vs. target time to completion, lead time to market, and completion of all field trials prior to production launch. When reviewed, the measures discussed above are mostly reactive in nature and are within the tactical horizon, as compared to the need of more proactive
According to Syamil et al. (2004), for businesses that are heavily involved in product development, the development process is indeed the business. The success of the development process depends on the end result of the new product development activities. In addition, Clark and Fujimoto (1991), and Pawar and Driva, (1999), indicate that most product development successes are defined by customer satisfaction, time to market, and development cost or product quality. It is very important to distinguish between process performance and the end result outcome of a product being developed, Syamil et al. (2004). Measurement of process performance is a critical management responsibility, Harter et al. (2000), Mackenzie (2000). This past work highlights the need for a sustainable, continuously improving process to ensure the right decisions are being made for architecture choices.
There are specific elements that relate to product development where metrics can be used to assess whether business objectives are being met. There are five key areas performance development was assessed by Terwiesch et al. (1998): market leadership, product performance related to competitors, freshness of the product line (i.e. the sales volume of products introduce within the introduction period), rate of innovation (i.e. the rate of changes of previous product as compared to future needs of product), and the intensity of development (i.e. the ratio of total personnel need for the product group to respective revenues). These elements discussed previously, describe an overarching factors of success; however, it is void of efficiency of resource utilization and technical productivity.
Without objectively measuring the process of innovation, one cannot ensure whether the R&D expenses serve the right benefit. Inputs and outputs should be correctly measured, Ellis (1997). The method of measuring the respective processes is by instilling a stage gate tracking tool to
instill a disciplined oversight from management. Financial metrics like the Internal Rate of Return help determine if there are high rates of return. This is essential to ensure funding with larger programs so low returns doesn't get overlooked. Ensuring the use of Quality Functional Deployment at the front end is also critical in driving discipline in decomposing customer needs in to functional needs not only for the product but for the value package being developed. Measurement of the Customer Satisfaction Index of product quality, reliability, delivery, and response provides focus on key customer facing fronts when it comes to marketing the value package, Ellis (1997).
Although these metrics are important, they cannot be applied to new products being developed for it is typical of products that have already been developed or close to being marketed. These key items also are complicated in their measurement techniques and applications. They have their place and need further diligence and clear criteria to be applied where needed. In a business environment, performance measurement is often seen as a process that is intended to track the goal attainment of an organization, Gooderham (2001). Therefore the focus of performance measurement almost always lies on the effectiveness and efficiency of the operations. According to Gooderham (2001), it is imperative to put project priorities on the forefront of performance measurement system analysis. The priorities can be developed subjectively with the collaboration of business leaders who should all agree on the best way of attaining the top level goal.
Pawar et al. (1999) generated about fourteen system related principles, of which number seven states: "Data should be easy to obtain, and accessible by stakeholders and easy to understand." Most of the principles discussed speak to the need for a framework to implement performance measurement system within the organization.
Metric Framework
Neely et al. discussed a framework that can be used to design and audit performance measures, Neely et al. (1997). The framework is called "performance record sheet". This process discusses method to counter issues regarding performance measurement system. The elements
include:
1) Measure defined should be easy to understand
2) The purpose and objective of measure should be defined 3) Clear statement on how the purpose and targets are connected 4) The desired level of Targets should be specified
5) Method of Calculation and how it impacts people's behavior should be understood 6) When and how often these measures should be calculated?
7) Who should measures? 8) What is the source of data?
9) Who is the responsible for reacting to the data? 10) What is the reaction plan?
All of these elements speak to the need for a closed looped performance management process for continuous improvement. However, the majority of literature on product development metrics do not discuss any methods of ensuring a closed loop management of measures. One of the key findings from my literature research is that the efforts of the Research and Develop or the Product Maturation processes need to yield returns to both the business and to add value to the customer. Extensive work was done by Meyer et al. (1997), where further studies of the Concept of Platforming with respect to product family yielded some key measures that are applied in the power system business.
Platform Efficiency and Effectiveness Metrics
In area of research and development environment, management often face multiple issues like the right project selection, communication, team and individual performance, benchmarking etc., Soumala (2004). However, performance measurement can also be tool that helps in understanding the broader picture and making the right decision. Often time, performance measurement drives behavior, therefore the measurement process needs to be useful in prioritizing projects to be worked, Schumann et al. (1995). Measurement communicates information to better understand something about the system being transformed into a desired state. By measuring, one prevents the possibility of managing it only by "gut feel" in the context of research and development and new product development, Soumala (2004).
There are two critical measures for NPD performance measures by Meyer et al. (1997):
1) Product platform Efficiency is interpreted as the degree to which a platform provides the possibility for the economic generation of follow-up products. It is simply calculated as; Efficiency (E)= Development Cost of Derivative Product / Cost of the Platform.
a. Key elements being addressed by this
measure:-i. How much did it cost on average to develop derivative products relative to what was spent on developing the base platform version within the product family.
ii. How do the respective engineering groups within the firm compare with one another in their ability to build robust platform that provide the basis for efficient product development? This would enable organization to replicate favorable practices.
2) Product platform Effectiveness, which, is defined as the degree to which the product relying on the same platform are able to produce revenue for the firm in relation to the costs associated with the development of those products. Effectiveness (L) is calculated by taking the ratio of total revenue associated with the product / development cost of the product. The Effectiveness measure was first proposed by Foster et al. (1985).
There are a number of elements addressed by this measure. For example, what are the returns realized on the firm's R&D investment as seen in comparing sales from products to the cost of developing them? How have a particular product family's sales to development costs effectiveness trended over time through successive platforming? Has it declined or improved? Are certain development groups proven to be more effective in creating leverage from their respective platform development
efforts than other groups?
According to Tertzakian (1994), "Product family can be thought of as having a hierarchical genealogy". A family typically includes product platform, which shares common elements within the platform. For example in the power system product line, a platform shares common blocks, and heads. Whereas a family can be a series of product platforms used in a market segment. As market needs change, products needs to change with different technologies and new product which, may be derivatives of existing products in the same platform or may form a new platform.
These proposed metrics can be used to address the frequently asked question on when should platforms be renewed? What kind of benefit can the firm really expect from completion of these efforts? How do we improve the approach and strategies for product development? How do incorporate system thinking to utilize metrics in holistic fashion?
Related Metrics
Meyer and Lehnerd (1997) have found that companies who typically design products one at a time for a particular customer often fail to embrace the commonality and standardization among different product or product lines. With regard to the most recent assessment of work done on product families, Johnson and Kirchain (2010), and Simpson (2003), discuss additional metrics focusing on the commonality of parts and subsystems that makes up the product architecture.
Johnson et al. (2010) states that "The general commonality metric proposed here (C), is defined as the ratio between the number of components shared and the number of components that could be shared in the given product family; in its basic form, it is piece-based commonality (CPiece )".
A measure of zero means that there is no commonality, which may impact future product efficiency negatively, while a measure of one could impact the efficiency positively. This measure proposed by Johnson et al. could be used as a subset of measure to improve the efficiency measure proposed by Meyer et al. In theory, this commonality index proposed could also help in forecasting and planning for the prediction of efficiency value to be achieved for the follow on products more accurately.
Summary of Literature Search
Listed below are series of points summarized from the literature search. One major element found from the research is that there is no one particular "magical" measure defined to improve the profitability of product platforms. The right measures have to be used in an integrated manner and controlled with a defined process. Some key elements that are observed from the extensive literature search are summarized below:
- Performance measurement should be defined in a clear and understandable manner
* Performance measurement system needs to facilitate learning, and learning from past mistakes
e Measure should also enable determination of core capabilities with clear understanding of cause and effect relationship.
e Performance measures should be connected from top - down, i.e from the strategies to clearly linked business objectives.
- Performance measure, should not be done only at one point in phase of product development process, but should be a continuous stream of acquiring and monitoring of
information that is gathered to be reflected upon if there is indeed the improvements applied did truly work and if processes needed to be improved.
- Without an appropriate structure and management involvement, framework and risk assessment, a metric being developed would almost certainly collapse under its own weight.
Another key observation from the literature review is that there is a void of discussion surrounding the means and the ways to identify risks in performance management as a process. Every measurement process has inherent weaknesses. For example, a study performed by Utterback et al. (1992) discussed in "When Speeding Concept to Market Can Be a Mistake", states that when a measure is missed like speed or time to market, it should be reacted to in a very cautious manner. In this literature the "studied companies shows that successful ventures, particularly the more risky and potentially rewarding, require commitment and persistence."
Systems Theory
To ensure a metric defined does not fail in its implementation process, the right risk assessment of information flow and stakeholders involved needs to be performed to ensure everyone involves understand the expectation, flow of information, communication, and the review of the right measures. The controlled flow of information calls for the need for a defined formal process to be in place, providing an overall structure in the business for a continuous improvement of the process itself.
The risk assessment performed should consider all of these elements as part of a System. A System Theoretic Process Analysis (STPA) is a method which typically applied to safety systems and situations is used to understand short comings and pitfalls that may exists in an internal product planning process. The STPA method can help identify hierarchy of control processes that may exist within a defined product development process. Often in product development most weakness occur at hand offs and where there exist interaction between process step owners and tasks that needs to be completed by adjacent process owners. The STPA method can identify the hidden factors that interact with each other to ensure appropriate controls are in place. The STPA process is described in brief as follows.
STPA is a four-step process, Leveson (2012):
Preparatory Step 1: Identify the hazards
Preparatory Step 2: Construct the hierarchical control structure Analysis Step 1: Identify the unsafe control actions
a. A safe control action is not provided b. Unsafe control action is provided
c. A safe control action is provided too early, too late or in the wrong order d. A safe control action is stopped too soon or applied too long
Chapter 3 - Case Study
General Focus of Study
This study applies the method proposed by Meyer et al. (1997) to the diesel power system business, specifically around four product families which include twelve different products over
two release cycles. These product families span the on-highway and off-highway markets and
have been through a rigorous stage-gate process throughout their respective developments. In most corporations products are introduced using the stage-gate system. A stage-gate system is series of milestones subjected to new product development, consisting of prescribed cross-functional and parallel activities that are controlled through management oversight reviews Coopers (1990). Before a product is resourced for a development, it goes through a series of technical and business plans and analyses. The product planning process relies heavily on experienced product line architects, marketing leaders, product managers, and product planners. Another strong influence of the current process is the use of market data and competitive landscape information from various organizations and sources.
- Business Goals & Target
- Experienced Leaders " Regulation
4
-- Market DataP
P - -* Product Plan - Competitive LandscapeFigure 1: High Level Product Planning Process showing typical input and output of the process
The current process in place lacks a continuous closed loop monitoring of past product performance indices to help steer product development managers and product line architects in making the right decision in the platform architecture using a metric oriented process based
The product plan discussed in this case study is comprised of products from two sub-business units (SBUs) competing in two different markets. The main element of this study is to address how the overall platform or derivative strategy would change by monitoring its respective Effectiveness and Efficiency outcomes of the product.
Architecture A
Launch Year 1 Launch Year 2
Architecture B Launch Year 3 Program 1 Product Derivative 1 Platform A Derivative lb Program 6 Product Platform B Product Platform C Product Program 4 Platform D Derivative4 ____________ _____________________________________Program 5
Figure 2: Platform and Derivative Programs Evaluated over three Launch Cycles
Figure 2 shows the lists of 12 different programs evaluated in this case study from two sub business units. This includes four distinct platforms over two architecture cycles. The programs are listed in chronological order. Efficiency and Effectiveness metrics were calculated per Meyer et al. (1997). Overall mapping of outcomes of these program are discussed in detail in the Data Analysis Section.
Data Analysis
All 12 programs revenue and spend information were obtained and plotted in the Figure 3. There was a strong collaboration of personnel from the finance and engineering functions who vetted the information before the analysis was conducted. From the Figure 3, there was one large program, Program 4, with 3 medium sized programs, Programs 1, 2, and 3. There were also a number of small derivative programs that followed suit in the next launch year.
Total Four Year Revenue vs. Gross Spend by Program - Product 3.50 Prog 4 Prog 1 a . Prog 2 Der 1 Der 1b * Der lb Der4 * * Der2 Der 3 - 0.20 * Prog 3 0.40 0.60 0.80 Spend 1.00
Figure 3: Current Process Metric: Revenue as a Function of Spend for 12 Programs
There are factors that impact the overall program effectiveness. For example, the sales of Derivative 3 were relatively lower as compared to Program 3 due to lingering economic conditions impacting the application market in which Derivative 3 competed in its landscape. One can also see that Program I has significantly higher revenue for a similar spend level in
C (U a.) 3.00 2.50 2.00 1.50 1.00 0.50
The Derivative I and l b were products competing in Market Application B vs. Program I competing in Market Application A. From Figure 3 the current product planning process would conclude that Program 3 was less successful compared to Programs I and 2 since more was spent and less revenue was earned. However, no conclusion can be made about the level of success in scoping the next derivative within each of the product platforms. The Effectiveness and Efficiency metrics was calculated per Meyer et al. (1997), to understand the distribution of these measure based on past product line strategy. First the program Effectiveness was calculated, which is ratio of the product revenue to technical development spend.
Boxplot of Effectiveness 50 40 GR 30I +aJ 10 0 Der Prog ProgDer
Figure 4: Comparison of Effectiveness per Meyer et. al. of Product Platforms and Derivatives
The results are mapped on a box plot showing the distribution of Effectiveness values segregated
by derivative and its initial parent platform. The results above show, that there is a significantly
lower mean of Effectiveness ratio between the parent program and the derivative program. The distribution really speaks to the current method of developing derivatives isn't very effective. There seem to be a "systemic" difference between the platform and the derivative market. For example, the regulatory requirements are set much more close in between phases compared to
--I
corporate to reduce the overall product market objective in order to manage through economic downturn.
One can see a clear opportunity to improve the current derivative strategy to further increase the overall mean of the Effectiveness metric. The current strategy does, however, impact the business positively by improving time to market as compared to the parent product program. Effectiveness and Efficiency, or any metrics, have inherent weaknesses and can be over used. Therefore, they need to be balanced with appropriate business objectives such as time to market. After reviewing the Effectiveness measure, the Efficiency values were calculated for the respective Derivative and its Initial Platform. The criteria for the reaction plan to both Effectiveness and Efficiency metrics are discussed more in Chapter 5. The diagram below shows the range of the Efficiency calculated per Meyer et al. (1997).
4. 0 0.9 0.7 0. 0.8 > 0.7 0.6 0 0.5 0.4 0- 0.4 0) 0.1 LU
Distribution of Efficiency Values
Drv 1& Ib / Prog 1 Drv 2 / Prog 2 Drv 3 / Prog 3
Translated Prog Name
Drv 4 / Prog 4
The Efficiency values in Figure 5 above, described by Meyer et al., is the ratio of the development spend of Derivative product to its respective parent Platform. One can see that the Efficiency calculation shown above isn't very intuitive. The higher Efficiency values shown above are actually less desirable and the lower Efficiency values from the method of calculation are desirable.
For now, internally, an Efficiency level of 0.5 or lower should be targeted as a starting point. Achieving an Efficiency level of 0.5 is a significant challenge. The current process of product planning needs further definition on key sub steps to ensure quality of information is compiled. In addition, roles and responsibilities of execution need clearer definition when an architecture decision is made. A more gradual revision of these targets should ensue once more datasets are available from current platforms maturing in the market. More discussion around reaction plans and roles and responsibilities is discussed in Chapter 4.
There are various surrogate metrics can be used to enhance the Efficiency metric. The learning's discussed in Meyer and Lehnerd (1997), found that companies who typically design products one at a time for a particular customer often fail to embrace the commonality and standardization amongst different products or product lines. Being an independent supplier of power systems, it's very challenging to maintain commonality of parts. Commonality of parts typically occurs at a larger system like castings of heads and blocks. The product development cost and manufacturing capital costs are very expensive for these components. Therefore, it is important to maintain commonality on at least these major components.
Another strategic approach that can be taken to address improvement in development cost (Efficiency), is to use a modularity approach in product design, Danesa (2010). Modularity in design entails dividing a product into coupled/independent parts or modules, Ulrich (1994). The Degree of Modularity of the product architecture can be another surrogate metric to be used to further improve the product Efficiency metric. A Modularity metric can be derived based on interaction analyses between components and subsystems, Sosale (1997). This would allow the degree of interaction to be determined and subsequently architectural elements could be identified for possibility of modularity approach in the aspects of architecture.
A slight modification is proposed in the calculation in the next section. Purpose of this modifications is for a more intuitive sense when one thinks of Efficiency, where a low number indicates poor Efficiency and a higher number indicates a desired level of Efficiency. The modification is calculation is as follows:
Analysis of Integrated Effectiveness and Efficiency Measures
Further Analysis was performed when comparing the Effectiveness and Efficiency values using the revised method. This method is described in a footnote' in the previous page. In Figure 6, the respective outcomes of Efficiency and Effectiveness of the programs are evaluated, with the more intuitive calculation method in this section, where low Efficiency is not desirable.
Platform Effectiveness & Modified Efficiency by Product
-- Effectiveness = Sales/Tech Spend
-0- Modified Efficiency (1- [Der/Plat])
60.00 1.00 Drv4/Prg4 50.00 Prg 5 0.80 LU I 40.00Drv 3/ Prg 3 ~,0.70 0) ~0.60 > 30.00 0.50
x
0.40 4-20.00 U-i Drv 2 /Prg 2 0.30 0 Drvl & lb 0.20 10.00 Prg3 - Prg4 D 3 * rv 2 1& 1b /Prg 1 1 0.00 0.00Figure 6: Plot of Effectiveness and Efficiency by Product over three launch periods. These values are generated using the modified Efficiency calculation method. High variance are observed more on the
Efficiency value compared to only one value with high Effectiveness value.
Based on internal discussions with technical leaders, a key contributor to the increasing Effectiveness was a change in emission requirements in which the business did plan for and manifested itself in a lesser change in Architecture. This coupled with the improvement in the global economic conditions, resulted in higher sales due to the replacement of aging product
reduced to less than planned due to economic conditions, which resulted in the positive impact of Efficiency and negatively impacted the Effectiveness measure. Derivative 1 and 1b upon further investigation were not true derivatives even though the initial plan were the same architecture.
The late changes resulted in product being launched behind schedule which, impacted the Efficiency negatively. This once again, speaks to the need for a process of reviewing Effectiveness and Efficiency metrics and the learnings from the previous program launch to define the right product plan to improve revenue generation and speed to market for the next product line. This may have been the right decision for the business at the time, however appropriate reasoning and future learnings along with review of metrics has to be documented for a better future planning of new products. Measures like speed or time to market when missed, should be reacted to in a very cautious manner, as discussed in "When Speeding Concept to Market Can Be a Mistake", Utterback et al. (1992). Appropriate learnings through risk assessment ought to be infused in the planning process especially when metric targets are missed.
This analysis shows that Derivative I and 1 b Effectiveness & Efficiency should be reviewed in a "closed loop planning system" before a firm product plan is developed for the next generation to ensure right architecture selection is done correctly. If Derivative 1 and lb had not been tied to Program 1, the product may have experienced higher sales and subsequently improved Effectiveness.
Ptatform - I Frog 1 Pltom rog 1
1 Frog 6
Imtm Prog New #
The elements discovered in this analysis shows that there's a need for a closed loop process with the right measures in place to continuously review the efficiency and effectiveness of the product development and regeneration system in place today. These measures, however, need to be taken as a lagging indicator in the future product planning process and product platform decisions. Continuous monitoring of market and competitive landscapes should also consider extensively ensuring that there is a balance in meeting customer needs and business objectives.
Influencing Factors
Product Development activities are one of the critical processes in corporations. The process needs to be managed diligently to not only develop products that continuously yields benefit to the customer but also instill a learning mechanism throughout the product development organization. Just as a Robust Product is immune to "noise" factors, elements, and business environment, a Robust Process should also be immune to "noise" factors and variables. Noise factors, also referred to as disturbances or sources of variation, include environmental conditions, variation in customer use and degradation over time Phal, Beitz et al. (1996).
In Robust Design the aim is to create a design where the signal output of the primary functions is large with respect to noise introduced by these external disturbances. One of the techniques in Robust Design to identify the key variables or factors, for a design it is the Parameter Diagram (P-Diagram). For the primary function the responses or outputs are listed. Inputs are put into three categories: control factors, signal factors, and noise factors. Typically, control factors are under the control of the designer. Signals are inputs to the process and are generally considered bounded. Noises are uncontrolled inputs or disturbances on the process, Phadke (1995); Taguchi, Chowdhury et al. (2005); Chrysler Corporation (2008). Similar to design variables, process variables or factors can be mapped in a P-Diagram. See Figure 8, where all factors that affect product or process are defined. In this case, the function or the process responsible for the transformation of the input to the desired output is the Product Platform Development process. In a product planning process control, the key Control factors are the capable people who make the up the Product Planning Function and the Product Line Architect Function.
We know that measures are often impacted by many variables, which can result in high variance in a particular measure. From these case studies, these factors or variables are defined in a P-Diagram. Those factors and variables include: Customer Order Pattern, Quality Level, Economic Conditions, Competitive Landscape, Market Share, Internal Competing Program and Total Market Opportunity. A P-Diagram was developed to better prepare one in developing and
Two or more of these factors that are highlighted below were observed to be present each program that is evaluated.
CONTROL FACTORS
Product planning
Product Life Cyc. Development Process Marketing and Sales (revenue)
Architecture
Voice of Business (Strategy)
SYSTEM FUNCTION
Product platform development
DESIRED OUTPUT
Effectiveness
Efficiency
Quality (launch RPH & Reliability Target) Consistent I/O to OEMs
UNDESIRED OUTPUT
Cost Time
Figure 8: P Diagram Identifying Factors that affect business goals.
Out of all the factors and variables that have been identified in the "Noise" box that are present in the product performance evaluated here, the key challenge based on recent lessons is navigating through economic crises. The P-Diagram can be used to identify the reason or context in which some of the historical metrics produced such high variance. Calculating metrics alone is not sufficient. Metrics are mere indicators. They need to be supported with a
INPUT SIGNAL
Market needs
Technology
Noise Factors
Customer Order Pattem Economic conditions
Quality Level
Changing competitive landscape
Total Opportunity - Volume by Markel
Market Share Competing Program
Concentrating on meeting metric target alone can detract from achieving the desired business results especially in a tough economic environment. Corporations should be focusing on key core capabilities such as people and assets that are needed to build a corporation's new products and on the generation of revenue, Meyer and Utterback (1993). This metric tool does provide a mechanism for the product planning team to think through appropriate factors, elements, or business conditions that may have contributed to a high variance in the success level of the product line.
Chapter 4 - Integration of Metrics
Product Planning and Development Processes
In a large corporation, the development of products and large systems is often a highly interactive social process involving people from various functions like Technical, Manuftacturing, Customer Service, Marketing etc. Challenges in communication are often faced
by larger companies that employ segregated product development organizations, which are
aligned with macro phases as shown in Figure 9 below, Werner and SoLider (1997). The connections between phases of maturation of select technologies or products are often not clear
within large corporations.
Uncertainty Exploratory Research
Technology M uct Maturation Development
Realization
Product Development Phases
Figure 9: Product Life Cycle Development and Management
Based on internal interviews conducted with various Project Managers, Program Leaders, Business Technical Product Line Architects and Product Planners, the reasons for these phenomena are perceived to be:
a) Organization involved in exploratory work often need the focus in a secure confidential environment when dealt with a technological challenges posed by specific business areas.
c) Absence of tangible agreeable measures within the Exploratory and Technology Maturation phases to solicit internal businesses to be more involved and interested in the future versus just defending current market application.
Throughout this research and test case activity, internal interviews were conducted to help understand outcomes of the data set and to understand how to enhance the synergy between business and research and development organizations in developing the right technology for future needs. In this case study, Architecture B represented an introduction of a new technology across the product platforms. It is the responsibility of the Product Planning and Product Line Architects to determine when to introduce or integrate new technologies in the product platforms. When discussion surrounding successes in research and development environments arise, many leaders responded that throughout exploratory research phases understanding "what we can't do is just as important as understanding what we can do." Understanding the "pulse of technology" i.e. what works and what doesn't, does help focus resources in the right direction quickly. In addition to ensuring continued innovation methods are improved, an appropriate method of hand-off to specific business units needs to be in place. A clear measureable or agreed upon assessment on handoff as compared to initial agreed deliverables needs to be in place to further enhance the communication and improve the process of hand off of technology for further product realization development phase.
Risk Assessment
The product planning process was reviewed for inherent system weaknesses using System Theoretic Process Analysis (STPA). This is a new hazard analysis technique based on systems theory rather than reliability theory. It treats safety as a control problem rather than a failure problem. The goal of STPA, which is to identify a set of scenarios that can lead to a hazard, is very similar to another commonly used method called Fault Tree Analysis (FTA). However, STPA includes a broader set of potential scenarios including those for which no component or product failures occur, but where problems arise due to unsafe and unintended interactions among the system components. The STPA method also provides more guidance to the analysts that traditional Fault Tree Analysis does not clearly define, Leveson (2012). The STPA method can also be used to analyse other emergent properties of the system other than safety, such as quality, Goerges, Hommes (2014). Using this prescribed method, Functional control diagrams were established from the System Boundary Diagram, shown in Figure 10, to further guide the analysis.
The STPA steps are used to assess factors, variables, and function interactions with each other as a process in the product planning phase for product realization and integration phase. Using a generic planning process, appropriate steps were defined and key elemental or functional interactions where information exchange occurs are highlighted. See Figure 10 for a high level chart of the planning process. In Figure 10, one can see that there is significant iteration of information between business target development functions and the product planning team, which is comprised of Product Planners and Technical Product Line Architects. Information regarding available resource plans and on-going rework is exchanged in the planning process. Infusing these discussions with anticipated Efficiency and Effectiveness metrics can provide a much clearer context to further select the best system architecture.
Ask, units I F strategie. & Targets Regulation Input Operating Target Growth Target, GMgr. Market Proposal & Competitive Data - Technical Leads - Product Planning Availab Resourc
t4i
le Rework es Product provement Firm Plan Operating Plan Target CheckFigure 10: Generic Process on Establishing a Product Plan in a Large Corporation
The Control Loop Diagram was developed with key elements of interaction between respective business leaders, product planners, and product line architects.
I
Budget Goals-Sales Targetsl
Product
- Results
Line of Business & Planning Leadership
- Growth Target - Budget Target - Requirements - Regulations - Product Plans
MO
- Product Plans - Chosen Product Architecture Concepts!eCn
Mk
Sales, Cost & Quality
Figure 11: A Generic Control Loop Diagram using STPA Approach
Team Leadership
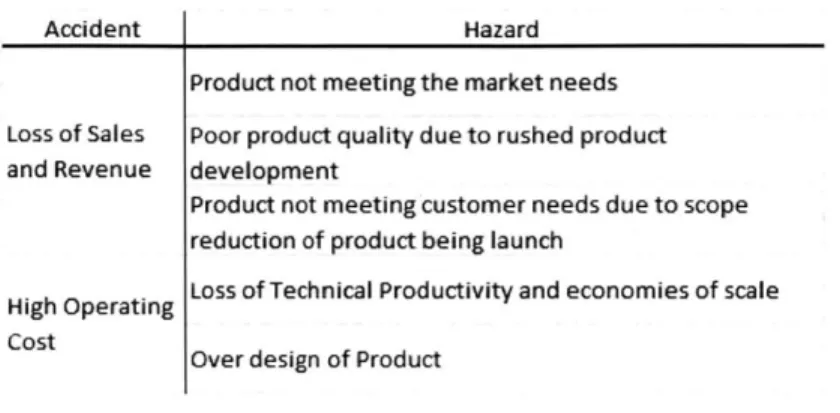
In the case particularly related to product development outcomes, the hazards and accidents experienced by the business process are listed in Figure 12 below.
Accident Hazard
Product not meeting the market needs Loss of Sales Poor product quality due to rushed product and Revenue development
Product not meeting customer needs due to scope reduction of product being launch
High Operating Loss of Technical Productivity and economies of scale Cost
over design of Product
Figure 12: Table of Synthesized "Hazard" to its corresponding business "Accident" STPA approach
Appropriate Controls of the system are required to ensure that these undesired outcomes are prevented from happening. Based on System Theoretic Analysis, a series of Business requirements were obtained to ensure systemic issues are addressed and guidelines for using the proposed measures are deployed in the recommendation section in Chapter 5. Key causal factors within the generic planning process are listed based on the appropriate STPA tradition guidewords.
Some key causal elements that impacts both Loop 1 and Loop 2 shown in Figure 11:
- Inadequate internal process of executing the Product Planning process - Delay in Product Plan Approval process
- Inadequate metrics
- Poor communication from top, down, and across business units regarding the alignment of product plans
Another key outcome determined from the gap analysis of the Control Loop diagram is that further improvement is needed to strengthen the connection between the Research and Engineering organizations on tactical and strategic business and technical targets. See Figure 13
_,- -Need further
improvement on
-E ,
business and technical
process reviews
Leadership Team....4 Budget
t
ResultsGoals L
Line of Business & Planning Leadership
- Growth Target Requirements Sales Targets, Budget Target Regulations
Product Plan
LPlanners -rh Product Plans
-- -Chosen Product
-Product Architecture Concepts
Plans
Sales, Cost & Quality
Figure 13: Improved Hierarchical Control Structure
The call out connection shown in the Figure 13 above should be formalized as a business process with respective Lines of Business. Referring to Figure 9, the Product Development and Realization part typically lies in the Line of Business cross-functional product development team. To ensure there is continued successes for the stream of products that the Line of Business would pursue strategically, it is imperative that the Exploratory and Technology Maturation work that typically lies in the Research and Development team be aligned to business needs as well. The business should provide clear requirements of market needs to Research and Development. In return, Research and Development/Engineering would provide the range of capabilities of their innovative technical solutions.