HAL Id: hal-00790650
https://hal.inria.fr/hal-00790650
Submitted on 20 Feb 2013HAL is a multi-disciplinary open access archive for the deposit and dissemination of sci-entific research documents, whether they are pub-lished or not. The documents may come from teaching and research institutions in France or abroad, or from public or private research centers.
L’archive ouverte pluridisciplinaire HAL, est destinée au dépôt et à la diffusion de documents scientifiques de niveau recherche, publiés ou non, émanant des établissements d’enseignement et de recherche français ou étrangers, des laboratoires publics ou privés.
Investigating the Influence of Geometrical Traits on
Light Interception Efficiency of Apple Trees: a
Modelling Study with MAppleT
Liqi Han, Evelyne Costes, Frédéric Boudon, Thomas Cokelaer, Christophe
Pradal, David da Silva, Robert Faivre
To cite this version:
Liqi Han, Evelyne Costes, Frédéric Boudon, Thomas Cokelaer, Christophe Pradal, et al.. Investigating the Influence of Geometrical Traits on Light Interception Efficiency of Apple Trees: a Modelling Study with MAppleT. International Symposium on Plant Growth Modeling, Simulation, Visualization and Applications, Oct 2012, Shangai, China. pp.152-159. �hal-00790650�
Investigating the Influence of Geometrical Traits on Light Interception Efficiency of
Apple Trees: a Modelling Study with MAppleT
Liqi Han, Evelyne Costes* INRA, Architecture and Functions of Fruit Trees (AFEF) Team, UMR 1334 Plant Genetic Improvement
and Adaption (AGAP) Montpellier, France * Corresponding author: costes@supagro.inra.fr Frédéric Boudona, Thomas Cokelaerb, Christophe Pradala a
CIRAD, bINRIA, Virtual Plants Team, UMR 1334 Plant Genetic Improvement
and Adaption (AGAP) Montpellier, France
David Da Silva Plant Sciences Department,
University of California (Davis) Davis, USA Robert Faivre INRA, UR 875 Biométrie et Intelligence Artificielle (BIA) Castanet-Tolosan, France
Abstract— MAppleT is a functional-structural plant model
that has been built for simulating architectural development of apple trees. It has the capability of representing tree growth within a virtual space where the development of individual organs depends on geometrical traits. The purpose of this research is to investigate the influence of apple trees’ architectural variability on their light interception efficiency. The STAR, i.e. the silhouette to total area ratio, of leaves, was chosen to evaluate the level of such efficiency. The strategy is to integrate MAppleT with the light interception model provided by the Fractalysis module of the VPlants software library. Target values of four major traits (internode length, leaf area, branching angle and top shoot diameter), are varied in range previously observed in a segregating population of apple hybrids. A sensitivity analysis based on polynomial and generalized additive models was performed for highlighting the most influential trait on light interception. The contribution of stochastic processes that control tree topology in MAppleT is also investigated in the sensitivity analysis. This study not only provides a time- and resource-saving alternative for data collection, but also sets a methodology for ideotype definition and further genetic improvement of apple trees.
Keywords-tree architecture; sensitivity analysis; FSPM; Malus x domestica
I. INTRODUCTION
The architecture of a fruit tree, including topology and geometry, results from complex and dynamic interplays between developmental processes (growth and branching) and the environment. In turn, it determines the 3D foliage distribution and thereby has an impact on light interception, water transport and transpiration as well as carbon acquisition and allocation [1]. Therefore the optimisation of tree architectures is required to improve the functioning of these mechanisms. Although architectural variations exist among apple tree cultivars [2], it still remains difficult to integrate these traits in breeding programs due to the complex changes in trait values during tree development [3]. Despite this difficulty, the first quantifications of the genetic variability of architectural traits within apple tree segregating populations have indicated that most of them are highly
heritable and under genetic control [4, 5]. Making use of this variability, an approach based on the definition of ideotypes has been proposed, which could help in integrating morphological features in the breeding programmes [6]. However, considering the complexity of apple tree architecture, the large number of trees required for experiments in quantitative genetics, and the long tree growth period covering years, it is neither convenient to grow and then measure phenotypes in the field nor easy to collect data at fine scales (e.g. from each leaf). To save time, labour and resources and to make the investigation of light interception possible, we rely on plant architectural modelling strategies [7-12] as well as environmental simulation tools to implement computer-based virtual experiments.
Our strategy makes use of MAppleT, i.e. Markov Apple Tree, which is an architectural model developed for simulation of apple tree topology and geometry [13]. In MAppleT, tree topology is organised according to Markovian models which control both the branching patterns and the growth units (GU) successions along axes [13-16]. Four GU states (“long”, “medium”, “short” and “flowering”) are considered and the transitions between them are modelled with Markov chain [17]; the branching of long and medium GU is characterised by zones, the succession of which is modelled with Hidden Semi-Markov Chains [16]. For geometry, the branch bending is simulated with a biomechanical model, inspired from [18], where the torques imposed by gravity and tropism are applied to each internode and then recursively extended to entire axes; the secondary growth of each internode, in terms of its diameter expansion, is simulated with the pipe model [19].
In its initial version, MAppleT model was parameterised for representing the cultivar Fuji. One purpose of this research was to indicate that a sensitivity analysis could be used to investigate the impact of the already-known genetically variable architectural parameters on light interception efficiency. This strategy was chosen because the improvement of light penetration within tree canopies has been a constant objective of fruit tree architecture manipulation through the setting up of training systems [20].
___________________________________
In the present paper, we analysed the impact of a limited number of geometrical features that were varied within a range of values previously observed within a segregating population of apple hybrids [5]. The light interception of the trees simulated with these parameter values were then estimated using MμSLIM, namely Multi-Scale Light Interception Model , from the Fractalysis module included in the VPlants packages in the OpenAlea framework [21, 22]. Then we analysed the impact of each input parameter and their interactions on the whole tree light interception. The contribution of the stochastic part of Markov models to the total variance of the output is also examined. In a longer-term perspective, our intention is to explore the parameter space of input parameters for contributing to ideotype definition.
II. MATERIALS AND METHODS
For evaluation of light interception efficiency, the Silhouette To Area Ratio (STAR), i.e. the ratio of shoot silhouette area to total leaf surface area [23, 24], was used. Silhouette area is the projected area of an object on a plane that is perpendicular to the projective direction (Fig. 1).
Based on the total surface area and the total silhouette area of all the leaves, the STAR for a whole tree can be calculated by:
TLA
PLA
STAR
(1)where PLA is the total Projected Leaf Area, i.e. silhouette area of the tree (considering overlap between leaves); and TLA is the Total Leaf Area, i.e.
n i i A TLA 1 where A is the surface area of leaf i and n is the total i
number of leaves.
For the light environment simulation, the diffuse mode available in MμSLIM was used to simulate the radiance of an overcast sky. The sky hemisphere is discretized in 46 solid angle sectors of equal area according to the Turtle sky proposed by Den Dulk [25]. The directions used are the central direction of each angle and each direction is associated with a weighting coefficient derived from the standard overcast sky radiance [26].
Figure 1. Illustration of silhouette area. Silhouette area is the projected area of an object (here for a single surface) on a plane that is perpendicular to the projective direction.
Figure 2. Relations between the investigated traits (on the left) and putative influences on light interception efficiency. These four traits are assumed to have direct or indirect impacts on a tree’s STAR value.
Three aspects were expected to have direct influence on the STAR value of the whole tree: the leaf surface, the density of leaves and the leaf orientations. The interception surface is mainly determined by the area of individual leaf (or leaf area, LA). Because petiole angle are considered constant in the present version of MAppleT, the leaf orientation is mainly influenced by branching angle and branch bending. The latter depends, for a given wood elasticity, on the allocation of weights imposed by leaves and internodes along an axis. According to the pipe model, the internode widths are recursively accumulated from the diameters of corresponding distal ends, from the shoot top to the shoot base. So the top shoot diameter is also expected to have an impact on branch bending and consequently on leaf orientation. The leaf density is determined by both the intervals between leaves, as determined by internode length, and the branching behaviour of the canopy. So we chose four geometrical traits related to these aspects (Fig. 2), including leaf area (LA), internode length (IL), top shoot diameter (TSD) and branching angle (BA), to investigate their complex influences on the whole tree’s STAR value.
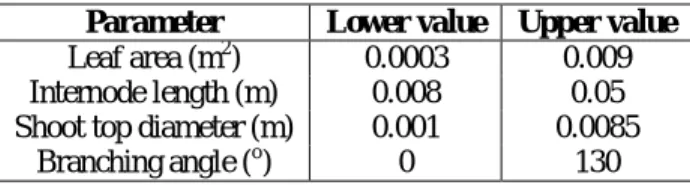
We ranged the four geometrical traits from a lower value to an upper value corresponding to the range of variation observed in the previously studied apple progeny [5] (TABLE I). All other parameters were kept with default values [13].
The virtual experiments covered five years growth of the trees and the STAR was calculated at the whole tree level, on June 30 of each year. This date corresponds to the stop of growth for most of the shoots, in particular the short and the medium ones. The workflow for implementing the sensitivity analysis includes:
TABLE I. RANGE OF TARGET VALUES OF THE INVESTIGATED ARCHITECTURAL TRAITS.
Parameter Lower value Upper value
Leaf area (m2) 0.0003 0.009 Internode length (m) 0.008 0.05 Shoot top diameter (m) 0.001 0.0085
Branching angle (o) 0 130
(1) Starting simulations according to the combinations of the parameter values (within the ranges as indicated by TABLE I).
(2) Launching the simulations to a cluster (where 10 nodes were used for this study, 8 processors for each node), running them in parallel, and producing 3D architectures.
(3) Integrating the architectures (in form of 3D scenes) into Fractalysis to obtain the numerical results of STAR values.
(4) Merging the numerical STAR values obtained in Step (3) into a single file for statistics and sensitivity analysis.
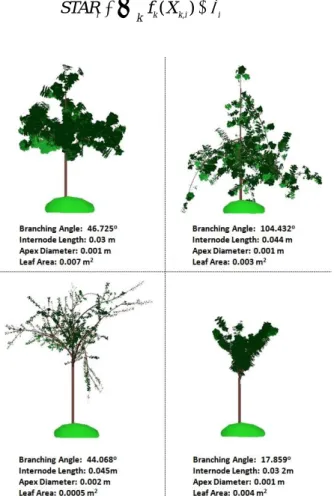
In MappleT, the growth and branching processes in MAppleT are simulated with Markov Chain and Semi Hidden Markov Chain respectively [13-17], estimated on previously collected data set (see [13, 16, 27]). As a consequence, part of the output variance of STAR may result from the stochastic part of these models. So we run a first set of 300 simulations with ordinary stochastic processes at first (see samples of these simulated tree architectures in Fig. 3); and then run another set of 300 simulations, based on the same input parameter values, but the Markov models were initialized with a same seed (for the pseudo-random number generation) so that the simulated trees had a fixed topology.
Because of the relatively long time required to run each simulation (about one hour for a five years old tree), it was not possible to carry out in a reasonable time a sensitivity analysis based on eFAST or Sobol methods that would require a large number of simulations [28]. Rather, we restricted our study to a set of 300 tupples, i.e. 600 model runs, in order to evaluate the stochastic part of MAppleT model and adopted a meta-modelling approach (or response surface modelling) to investigate our model response. The experimental design for exploring the space of input parameter values was performed with LHS (Latin Hypercube Sample), with the corresponding procedure in R software version 2.13.1 [29]. LHS design draws a sample uniformly distributed on each input parameter variation domain - leaf area (LA), internode length (IL), top shoot diameter (TSD) and branching angle (BA). We expect from such a design to allow us to identify the main effect of each factor, especially the expectation of the response variable Y (here the STAR) along the X input parameter domain (i.e. E(Y|X)) and some interaction effects between input parameters.
Among meta-modelling approaches [30, 31], two were investigated: a multiple polynomial linear metamodel (PLMM, Faivre, unpublished) and a generalized additive model (GAM; Woods, 2006). The first meta-model, PLMM, aims at modelling the simulated STAR variable as a linear combination of cross-product of polynomial functions of maximum degree between the different MAppleT parameters (eq. 2). It considers the output variable STAR as
j j ji i
i
Z
STAR
,
(2)where the sum for j is over the
D D K combinations of cross products of functions with different powers on all the K4 factors:
dk i k i jX
Z
, , (3) where 0dk D and
kdk D , D being themaximum degree of the polynom; j being the parameters
of the regression and i the residual error term. Here, we
considered D3.
This model makes it possible to compute the coefficient of determination of each factor as a main effect or in interaction with the three others. It also allows us to identify possible confusion between effects that may result from non-orthogonal plans in LHS.
The second meta-model is a generalized additive model (GAM [32]). We modelled STAR as an additive sum of nonparametric functions of each input parameter:
STARi
k fk(Xk,i)
i(4)
Figure 3. Visualization of simulated apple tree architectures. These sample architectures were produed by MAppleT with diferent values of the investigated parameters.
TABLE II. MEAN AND STANDARD DEVIATION OF STAR VALUES CALCULATED ON 300 VIRTUAL APPLE TREES AND DEPENDING ON THE YEAR
OF GROWTH (FROM 1 TO 5). With stochastic variation Without stochastic variation Year Mean Std Mean Std
1 0.356 0.079 0.356 0.0789
2 0.192 0.083 0.190 0.0828
3 0.143 0.076 0.155 0.0718
4 0.112 0.065 0.140 0.0667
5 0.111 0.064 0.142 0.0717
The functions considered here correspond to the default option in mgcv library, i.e. thin plate regression splines. This second model was used for comparison with PLMM that may identify interactions when the linearity of factors is not respected. By contrast, GAM is able to consider the effect of each parameter with a nonlinear form which is not only polynomial. It provides a visualization of possible deformations of the output variable response with respect to a polynomial model. In the present application of gam, we did not consider interactions between the response factors.
Figure 4. Changes in mean values of architectural traits on 300 virtual apple trees simulated by MAppleT model over 5 years. (a) Mean number of leaves (line) and growth units (GU, dashed line) per tree; (b) Mean internode (IN, line) length and leaf area (dashed line).
III. RESULTS
The mean STAR value, whatever the input parameter values are, decreased with tree age (TABLE II). However, its mean value stabilised when the trees were 4 and 5 year-old. This change in mean STAR values results from those in the mean number of leaves and GUs that increased with the tree age (Fig. 4a). Simultaneously, the mean internode length and leaf area decreased (Fig. 4b), because of the progression of tree growth towards short shoots and the progressive disappearance of median zones, where the longest internodes and largest leaves are located.
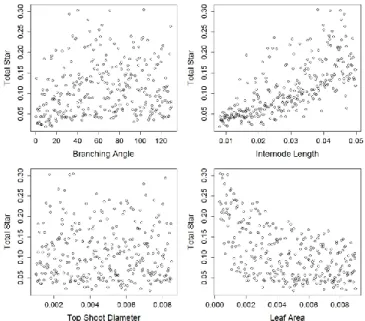
For 5 year-old trees, the plot between STAR values and input parameters shows no obvious relationship for TSD and BA whereas more complex patterns were observed for the two other variables (Fig. 5). The relationship between STAR and both LA and IL were close to hyperbolas.
When comparing the simulations performed with and without stochastic variation of the Markovian models, we found that the mean and variance of STAR values were very close, with only 2% difference in the variance (TABLE II) and almost similar effects of the input parameters (data not shown).
Figure 5. Plot of STAR values calculated on 300 simulated 5yo trees (with stochastic variation) against the corresponding values of each of the four input parameters (Branching angle, Internode length, Top shoot diameter and Leaf area).
Figure 6. Main effects (black) and interactions (grey) of the four input parameters investigated on the variance of whole tree STAR values calculated on 5yo simulated apple trees (with stochastic variation), and estimated by a Polynomial Linear Meta-Model of degree 3.
TABLE III. ESTIMATES AND SIGNIFICANT EFFECTS ESTIMATED BY THE POLYNOMIAL LINEAR META-MODEL ON STAR VALUES GENERATED FROM
300 SIMULATIONS OF 5YO APPLE TREES.
Effect Estimate Std, Error t value Pr(>|t|) 0,110 0,001 178,198 <2.00E-16 ** (BA, 0, 0, 0) 0,193 0,011 17,484 <2.00E-16 ** (BA², 0, 0, 0) -0,273 0,011 -24,180 <2.00E-16 ** (BA3, 0, 0, 0) 0,040 0,011 3,463 0.00062 ** (0, IL, 0, 0) 0,741 0,011 66,684 <2.00E-16 ** (0, IL3, 0, 0) -0,029 0,011 -2,631 0.0090 ** (BA, IL, 0, 0) 0,573 0,200 2,859 0.0046 ** (BA², IL, 0, 0) -1,567 0,208 -7,526 8.18e-13 ** (BA, IL², 0, 0) -0,583 0,199 -2,934 0.0036 ** (0, 0, TSD, 0) -0,034 0,011 -3,157 0.0018 ** ( 0, 0, 0, LA) -0,578 0,011 -52,869 <2.00E-16 ** ( 0, 0, 0, LA²) 0,251 0,011 22,998 <2.00E-16 ** ( 0, 0, 0, LA3) -0,104 0,011 -9,383 <2.00E-16 ** ( BA, 0, 0, LA) -0,763 0,191 -4,002 8.15e-05 ** ( BA², 0, 0, LA) 0,971 0,191 5,088 6.87e-07 ** (0, IL, 0, LA) -3,113 0,205 -15,193 <2.00E-16 ** (0, IL², 0, LA) 0,701 0,212 3,313 0.0011 ** (0, 0, TSD, LA) 0,836 0,193 4,330 2.12e-05 ** (0, IL, TSD, LA) 7,723 3,596 2,147 0.0327 * ( 0, IL, 0, LA²) 0,493 0,206 2,394 0.0173 *
Interactions between factors were considered with a maximum degree 3. BA: Branching angle; IL: Internode length; TSD: Top shoot diameter; LA: Leaf area). Significance of effects: n.s., not significant; *, Significant (0.01<p ≤ 0.05); **, highly significant (p ≤ 0.01).
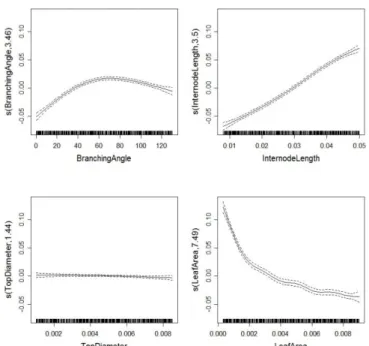
Figure 7. Expected mean values (solid lines) and confidence band (dashed lines) of smoothed terms (y axes; predicted STAR value) depending on the input parameter values (x axes: position of sampled values in LHS) estimated from the Generalized Additive Model (GAM). The term s in the y-label indicates that thin-plate splines are used and the number corresponds to the equivalent degree of freedom (edf) of the estimated curve.
The estimation of STAR by a Polynomial Linear Meta-Model (PLMM) highlighted that main effects on STAR were obtained with IL and LA which explained 47% and 37% respectively and with BA to a lesser extent (10%; Fig. 6). Consistently with the plot shown in Fig. 5, no effect of TSD was found. The multiple R² estimated with that model explained 98% and 99% of STAR variability resulting from simulations without and with stochastic variability respectively. For the three parameters that have an impact on STAR values, the proportion of variance explained by interactions was low (black block in Fig. 6). However, because the experimental design is not orthogonal, this apparent interaction could be a confusion effect between these two parameters. This can be deduced from the position of the black line in Fig. 6 which indicates the confidence interval for main effect estimation. In our case, this interval includes the interactions and therefore the variations in STAR could be explained either by IL or LA alone.
The estimation of the different terms by the polynomial model and their effects on STAR are reported in TABLE III (only significant effects are included). This revealed that all terms from degree 1 to degree 3 with BA and LA had a significant effect on STAR. For IL, only terms of degree 1 and 3 were significant and for STD the term of degree 1 was the only significant one. Interaction terms mainly concerned BA (of degree 1 to 3) with LA and IL even though interactions between TSD and LA were also significant in the model.
With GAM model, the prediction of STAR value for a specific combination of the 4 input parameter values is the sum of 4 terms, as plotted in Fig. 7. Consistently with PLMM, the approximate effects of the four input parameters on STAR values, estimated with a GAM revealed significant effects of IL, LA and BA (this order corresponding to decreasing F values) whereas STD exhibited a insignificant effect (data not shown). The estimated GAM explained 96.4% and 94.3% of the total variation of STAR values obtained from simulations without and with a stochastic variation respectively (adjusted R²). The expected mean values of the smoothed terms depending on STAR values (Fig. 7) were consistent with the general form observed in Fig. 5. Fluctuations in shape of the output variable responses are revealed by the value of estimated degree of freedom (see edf values on y-axes in Fig. 7) which is an indicator of the non-regularity of the function. The function of STAR responses to LA had the highest edf value, consistently with a higher number of fluctuations: the slope highly decreases between 0 and 0.002, and decreases more smoothly between 0.002 and 0.008.
IV. DISCUSSION AND CONCLUSION
The sensitivity analysis performed in the present study allowed us to highlight a hierarchy among the three aspects that were expected to have direct influence on the STAR value of the whole tree. Internode length and area of individual leaves had the highest impact on STAR whereas the branching angle had only a low impact. Top shoot diameter had a very low if not null impact. Individual leaf area effect is consistent with STAR definition. Basically, the overall STAR turned to be smaller when the leaf area was tuned to be higher because large leaves produce bigger portions of overlaps (independently on possible reorientation of leaf blade toward light source), thereby less light can reach the inner leaves. Moreover, large leaves also mean more biomass and therefore more bending of branches which bring more leaves under the overlaps (independently from the relatively larger effect of fruit biomass on branch bending). Because internodes are the primary support minimizing leaf overlap, the large influence of internode length on plant light interception has also been underlined in other plant species [33-35].
More surprising was the low interaction effects on STAR variation. At that stage of our investigation, there is still a possible confusion between interactions and main factors effects. Indeed, the GAM showed that the response factors, especially to LA, were more irregular than a polynomial function. Therefore the part of STAR variance affected by interactions could result from a lack of precision in the estimation in PLMM. To further explore these interactions, PLMM approach could be evaluated with a greater degree. This would provide higher apparent R² but would also greatly increase the number of parameters to be estimated and would certainly generate difficulties in interpreting the estimated interactions. To reduce the number of parameters in PLMM, it would be possible to perform a model selection procedure to remove insignificant terms. This will also lead
us to refine the PLMM by including new parameters such as the petiole angles. Dedicated experimental design (especially orthogonal) could also be carried out to refine the estimation of interactions of interest. But, this would require a higher number of simulations and might be difficult to perform due to the long computation time for simulating 5yo apple tree.
Despite limitations regarding the estimation of interactions, the two meta-models considered in this study behaved similarly and provided estimations of STAR variations with R² greater than 95% in both approaches. In GAM modelling, additive effects of the 4 factors allowed us to estimate the contributions of each factor in the variation of STAR. As previously for PLMM, it would be possible to extent the GAM model in a multidimensional way (especially in our case between IL and LA). But, this would also require more simulated data to have a good quality of the estimators. For the same reasons, the expected gain of other possible statistical approaches to model the response STAR, such as described in [30], will be low.
The very low effect of the stochastic variation generated by Markov models on the output variable was also unexpected (2 % of variation explained with and without stochastic variation). This can be interpreted by the fact that these Markov model capture the main invariant features in tree structures, this resulting in relatively high estimated probabilities [15-17].Within a given cultivar (Fuji in our case), the remaining variations due to the randomness of the underlying physiological processes and their interaction with environmental conditions are reduced in comparison to the variations due to genetic control of the traits.
Finally, the STAR values could be predicted with a good confidence from a simple combination of functions built with leaf area, internode length and branching angle. However, we suspect that the confidence in the model outputs could be related to the very large range of variation in the input parameters we have explored. The validity of model predictions with another range of input variables values will thus have to be further investigated.
The fact that the 4 studied factors had mainly additive effects is very promising to identify traits able to optimize light interception from the point of view of breeders. Indeed, this suggests that major genetic improvements could be done in fruit tree species, as previously performed in annual crops [36]. Nevertheless, the search for innovative ideotypes will also benefit from focus on the 1 or 2 % of unexplained variations which may lead to less expected effects. Presently, because the experimentation design does not include constraints between input parameters, the simulated trees can exhibit very small leaf area combined to very long internodes. Such combination leads to the highest STAR values at the whole tree level. Nevertheless, in reality, it is unlikely that the leaf area changes independently from the other factors, especially internode length, due to strong allometric properties of the metamers (e.g. see [37]). As a consequence, the definition of the input parameter space to be explored in the sensitivity analysis, would need further investigations. Similarly the way to balance the different and possibly antagonist functions of plant organs (e.g. individual leaf area are involved in light interception, transpiration and
photosynthesis; internode length impact on both leaf positioning and branch biomechanics, etc.) will have to be considered to further develop our approach towards the concept of optimal design and ideotype definition [38].
ACKNOWLEDGMENT
The post-doc project of L. Han has been supported by the Genetic and Breeding Department of INRA (France). We gratefully thank Y. Guédon (CIRAD, UMR AGAP) and C. Lavergne (Univ. of Montpellier I) for scientific discussions on Markovian models and sensitivity analyses, and Bertrand Pitollat for his helpful support for computing parallel simulations on cluster. We also thank Agropolis Fundation for its support to OpenAlea platform.
REFERENCES
[1] E. Costes, et al., “Tree architecture and production,” Horticultural Reviews, vol. 32, 2006, pp. 1-60.
[2] Y. Lespinasse, “Breeding apple tree: aims and methods,” Proc. Proceedings of the Joint Conference of the EAPR Breeding and Varietal Assessment Section and the EUCARPIA Potato Section, 1992, pp. 103-110.
[3] F. Laurens, et al., “Integration of architectural types in French programmes of ligneous fruit species genetic improvement,” Fruits, vol. 55, 2000, pp. 141-152.
[4] I.D. Wit, et al., “Architectural analysis of 1-year-old apple seedlings according to main shoot growth and sylleptic branching characteristics,” Trees, vol. 16, 2002, pp. 473-478.
[5] V. Segura, et al., “Dissecting apple tree architecture into genetic, ontogenetic and environmental effects: mixed linear modelling of repeated spatial and temporal measures,” New Phytologist, vol. 178, no. 2, 2008, pp. 302–314.
[6] P.E. Lauri and E. Costes, “Progress in Whole-Tree Architectural Studies for Apple Cultivar Characterization at INRA, France - Contribution to the ideotype approach,” Acta Horticulturae, vol. 663, 2004, pp. 357-362.
[7] J.S. Hanan and P.M. Room, “Practical aspects of virtual plant research,” Advances in computational life sciences, M. T. Michalewicz, ed., Kevin Jeans, 1996, pp. 28-44.
[8] B. Hu and M. Jaeger, Plant growth modeling and applications. Proceedings PMA03: 2003 International symposium on plant growth modeling, simulation, visualization and their applications, Springer, 2003.
[9] C. Godin and H. Sinoquet, “Functional-structural plant modelling,” New Phytologist, vol. 166, no. 3, 2005, pp. 705-708. [10] T. Fourcaud, et al., “Plant growth modelling and applications: the increasing importance of plant architecture in growth models,” Annals of Botany, vol. 101, 2008, pp. 1053-1063.
[11] T.M. DeJong, et al., “Using functional-structural plant models to study, understand and integrate plant development and ecophysiology,” Annals of Botany, vol. 108, 2011, pp. 987-989. [12] Y. Guo, et al., “Plant growth and architectural modelling and its applications,” Annals of Botany, vol. 107, 2011, pp. 723-727. [13] E. Costes, et al., “MAppleT: simulation of apple tree development using mixed stochastic and biomechanical models,” Functional Plant Biology, vol. 35, 2008, pp. 936-950.
[14] Y. Guédon, et al., “Pattern analysis in branching and axillary flowering sequences,” Journal of Theoretical Biology, vol. 212, no. 4, 2001, pp. 481-520.
[15] E. Costes and Y. Guédon, “Modelling branching patterns on 1-year-old trunks of six apple cultivars,” Annals of Botany, vol. 89, no. 5, 2002, pp. 513-524.
[16] M. Renton, et al., “Similarities and gradients in growth unit branching patterns during ontogeny in ‘Fuji’ apple trees: a stochastic approach,” Journal of Experimental Botany, vol. 57, no. 12, 2006, pp. 3131-3143.
[17] E. Costes and Y. Guédon, “Modeling sequence of differenciation states during tree ontogeny: exploring within and between years dependencies of consecutive growth units in two apple tree cultivars,” Trees - Structure and Function, 2012; DOI 10.1007/s00468-011-0661-8.
[18] P. Prusinkiewicz, et al., “The L+C plant modelling language,” Functional-Structural Plant Modelling in Crop Production, J. Vos, et al., eds., Springer, 2007.
[19] K. Shinozaki, et al., “A quantitative analysis of plant form – the pipe model theory. (i) Basid analyses,” Japanese Journal of Ecology, vol. 14, 1964, pp. 97-105.
[20] M. Willaume, et al., “Light interception in apple trees influenced by canopy architecture manipulation,” Trees, vol. 18, 2004, pp. 705-713.
[21] D. Da Silva, et al., “Multiscale framework for modeling and analyzing light interception by trees,” Multiscale Modeling and Simulation, vol. 7, no. 2, 2008, pp. 910-933.
[22] C. Pradal, et al., “OpenAlea: a visual programming and component-based software platform for plant modeling,” Functional Plant Biology, vol. 35, 2008, pp. 751-760.
[23] P. Oker-Blom and H. Smolander, “The ratio of shoot silhouette area to total needle area in scots pine,” Forest Science, vol. 34, no. 4, 1988, pp. 894-906.
[24] P. Stenberg, “Simulations of the effects of shoot structure and orientation on vertical gradients in intercepted light by conifer canopies,” Tree Physiology, vol. 16, 1996, pp. 99-108.
[25] J.A.d. Dulk, “The Interpretation Of Remote Sensing: A Feasibility Study,” Wageningen, 1989.
[26] P. Moon and D.E. Spencer, “Illumination from a non-uniform sky,” Transactions of the Illumination Engineering Society, vol. 37, 1942.
[27] E. Costes, et al., “Exploring within-tree architectural development of two apple tree cultivars over 6 years,” Annals of Botany, vol. 91, no. 1, 2003, pp. 91-104.
[28] A. Saltelli, et al., Sensitivity Analysis: Gauging the Worth of Scientific Models, Wiley, 2000.
[29] R Development Core Team, R: A language and environment for statistical computing, reference index version 2.13.1, R Foundation for Statistical Computing, Vienna, Austria, 2011. [30] C.B. Storlie and J.C. Helton, “Multiple predictor smoothing methods for sensitivity analysis: Description of techniques,” Reliability Engineering & System Safety, vol. 93, 2008, pp. 28–54. [31] N. Villa-Vialaneix, et al., “A comparison of eight metamodeling techniques for the simulation of N2O fluxes and N
leaching from corn crops,” Environmental Modelling & Software, vol. 34, 2012, pp. 51–66.
[32] S.N. Wood, Generalized additive models: an introduction with R, Chapman & Hall/CRC, 2006, p. 392.
[33] A. Christophe, et al., “A quantitative analysis of the three-dimensional spatial colonization by a plant as illustrated by white clover (Trifolium repens L.),” International Journal of Plant Sciences, vol. 164, 2003, pp. 359-370.
[34] R.W. Pearcy, et al., “Crown architecture in sun and shade environments: assessing function and trade-offs with a three-dimensional simulation model,” New Phytologist, vol. 166, no. 3, 2005, pp. 791–800.
[35] V. Sarlikioti, et al., “How plant architecture affects light absorption and photosynthesis in tomato: towards an ideotype for plant architecture using a functional–structural plant model,” Annals of Botany, vol. 108, no. 6, 2011, pp. 1065-1073.
[36] G.S. Khush, “Green revolution: the way forward,” Nat Rev Genet, vol. 2, 2001, pp. 815-822.
[37] D. Yang, et al., “Size-dependent leaf area ratio in plant twigs: implication for leaf size optimization,” Annals of Botany, vol. 105, 2010, pp. 71-77.
[38] R.L. Wu, “Genetic mapping of QTLs affecting tree growth and architecture in Populus: implication for ideotype breeding,” Theoretical and Applied Genetics, vol. 96, 1998, pp. 447–457.