Massachusetts Institute of Technology
Engineering Systems Division
Working Paper Series
ESD-WP-2003-02
A
PPLYING
STAMP
IN
A
CCIDENT
A
NALYSIS
Nancy Leveson, Mirna Daouk, Nicolas Dulac, and Karen Marais
Massachusetts Institute of Technology
Applying STAMP in Accident Analysis
∗Nancy Leveson, Mirna Daouk, Nicolas Dulac, and Karen Marais Massachusetts Institute of Technology
April 7, 2003
Abstract: Accident models play a critical role in accident investigation and analysis. Most
traditional models are based on an underlying chain of events. These models, however, have serious limitations when used for complex, socio-technical systems. Previously, Leveson proposed a new accident model (STAMP) based on system theory where the basic concept is not an event but a constraint. This paper shows how STAMP can be applied to accident analysis using three different views or models of the accident process and proposes a notation for describing this process.
1
Introduction
Most accident investigation and analysis rests on the use of event chain models, i.e., the accident causation is described as a chain of failure events and human errors that led up to the actual loss event. Such models are limited in their ability to handle system accidents (arising from dysfunc-tional interactions among components and not just component failures), software-related accidents, complex human decision making, and system adaptation or migration toward an accident over time [7].
In response to the limitation of event chain models, models based on systems theory have been proposed for use in accident analysis (see, for example, Rasmussen-Svedung [11]). STAMP (Systems-Theoretic Accident Modeling and Processes) is one such model that has been recently proposed [7]. Previously, only a description of the theoretical model underlying STAMP has been published. This paper shows how STAMP can be used in accident analysis and suggests notations that might be appropriate for representing and communicating the process leading to the accident. The next section briefly describes STAMP. Then its application to a complex socio-technical accident is illustrated by applying it to the bacterial contamination of a water system in Walkerton Ontario in May 2000 where 2300 people became ill (in a town of 4800) and seven died [8].
2
Brief Description of STAMP
Accident models based on system theory consider accidents as arising from the interactions among system components and usually do not specify single causal variables or factors [5]. Whereas industrial (occupational) safety models focus on unsafe acts or conditions, classic system safety models instead look at what went wrong with the system’s operation or organization to allow the accident to take place.
∗This research was partially supported by NASA Engineering for Complex Systems Grant NAG2-1543 and NSF
ITR grant CCR-0085829.
2 BRIEF DESCRIPTION OF STAMP 2
In STAMP (Systems-Theoretic Accident Modeling and Processes), accidents are conceived as resulting not from component failures, but from inadequate control or enforcement of safety-related constraints on the development, design, and operation of the system. Safety is viewed as a control problem, and accidents occur when component failures, external disturbances, and/or dysfunctional interactions among system components are not adequately handled. In the space shuttle Challenger accident, for example, the O-rings did not adequately control propellant gas release by sealing a tiny gap in the field joint. In the Mars Polar Lander loss, the software did not adequately control the descent speed of the spacecraft—it misinterpreted noise from a Hall effect sensor as an indication the spacecraft had reached the surface of the planet.
Accidents such as these, involving engineering design errors, may in turn stem from inadequate control over the development process. Control is also imposed by the management functions in an organization—the Challenger accident involved inadequate controls in the launch-decision process, for example—and by the social and political system within which the organization exists.
While events reflect the effects of dysfunctional interactions and inadequate enforcement of safety constraints, the inadequate control itself is only indirectly reflected by the events—the events are the result of the inadequate control. The control structure itself, therefore, must be examined to determine why the controls were inadequate to maintain the constraints on safe behavior and why the events occurred—for example, why the hot air gases were not controlled by the O-rings in the Challenger field joints, why the designers arrived at an unsafe design, and why management decisions were made to launch despite warnings that it might not be safe to do so.
Systems are viewed, in this approach, as interrelated components that are kept in a state of dynamic equilibrium by feedback loops of information and control. A system is not treated as a static design, but as a dynamic process that is continually adapting to achieve its ends and to react to changes in itself and its environment. The original design must not only enforce appropriate constraints on behavior to ensure safe operation, but it must continue to operate safely as changes and adaptations occur over time. Accidents then are viewed as the result of flawed processes involving interactions among system components, including people, societal and organizational structures, engineering activities, and physical system components.
STAMP is constructed from three basic concepts: constraints, hierarchical levels of control, and process models. These concepts, in turn, give rise to a classification of control flaws that can lead to accidents. Each of these is described below.
2.1 Constraints and Hierarchical Levels of Control
The most basic concept in STAMP is not an event, but a constraint. In systems theory or control theory, systems are viewed as hierarchical structures where each level imposes constraints on the activity of the level beneath it—that is, constraints or lack of constraints at a higher level allow or control lower-level behavior [2]. Safety-related constraints specify those relationships among system variables that constitute the nonhazardous or safe system states—for example, the power must never be on when the access door to the high-voltage power source is open; pilots in a combat zone must always be able to identify potential targets as hostile or friendly; and the public health system must prevent the exposure of the public to contaminated water.
Instead of viewing accidents as the result of an initiating (root cause) event in a series of events leading to a loss, accidents are viewed as resulting from interactions among components that violate the system safety constraints. The control processes that enforce these constraints must limit system behavior to the safe changes and adaptations implied by the constraints. This definition of accidents fits both classic component failure accidents as well as system accidents.
enforce-2 BRIEF DESCRIPTION OF STAMP 3
ment of constraints on behavior (e.g., the physical system, engineering design, management, and regulatory behavior) at each level of the socio-technical system.
The model in Figure 1 has two basic hierarchical control structures—one for system develop-ment (on the left) and one for system operation (on the right)—with interactions between them. An aircraft manufacturer, for example, might only have system development under its immediate control, but safety involves both development and operational use of the aircraft, and neither can be accomplished successfully in isolation: Safety must be designed into the system, and safety during operation depends partly on the original design and partly on effective control over opera-tions. Manufacturers must communicate to their customers the assumptions about the operational environment upon which the safety analysis was based, as well as information about safe operating procedures. The operational environment, in turn, provides feedback to the manufacturer about the performance of the system during operations.
Between the hierarchical levels of each control structure, effective communication channels are needed, both a downward reference channel providing the information necessary to impose con-straints on the level below and a measuring channel to provide feedback about how effectively the constraints were enforced. For example, company management in the development process struc-ture may provide a safety policy, standards, and resources to project management and in return receive status reports, risk assessment, and incident reports as feedback about the status of the project with respect to the safety constraints.
The safety control structure often changes over time, which accounts for the observation that accidents in complex systems frequently involve a migration of the system toward a state where a small deviation (in the physical system or in human operator behavior) can lead to a catastrophe. The foundation for an accident is often laid years before. One event may trigger the loss, but if that event had not happened, another one would have. Union Carbide and the Indian govern-ment blamed the Bhopal MIC (methyl isocyanate) release (among the worst industrial accidents in history) on human error—the improper cleaning of a pipe at the chemical plant. However, the maintenance worker was, in fact, only a minor and somewhat irrelevant player in the loss [6]. Instead, degradation in the safety margin occurred over time and without any particular single decision to do so but simply as a series of decisions that moved the plant slowly toward a situation where any slight error would lead to a major accident:
The stage for an accidental course of events very likely is prepared through time by the normal efforts of many actors in their respective daily work context, responding to the standing request to be more productive and less costly. Ultimately, a quite normal variation in somebody’s behavior can then release an accident. Had this ‘root cause’ been avoided by some additional safety measure, the accident would very likely be released by another cause at another point in time. In other words, an explanation of the accident in terms of events, acts, and errors is not very useful for design of improved systems [9].
Degradation of the safety-control structure over time may be related to asynchronous evolution [5], where one part of a system changes without the related necessary changes in other parts. Changes to subsystems may be carefully designed, but consideration of their effects on other parts of the system, including the control aspects, may be neglected or inadequate. Asynchronous evolution may also occur when one part of a properly designed system deteriorates. In both these cases, the erroneous expectations of users or system components about the behavior of the changed or degraded subsystem may lead to accidents. The Ariane 5 trajectory changed from that of the Ariane 4, but the inertial reference system software did not. One factor in the loss of contact with
2 BRIEF DESCRIPTION OF STAMP 4
Maintenance Congress and Legislatures
Legislation
Company
Congress and Legislatures
Legislation Legal penalties Certification Standards Regulations Government Reports Lobbying
Hearings and open meetings Accidents Case Law Legal penalties Certification Standards Problem reports Incident Reports Risk Assessments Safety−Related Changes Test reports Test Requirements Standards Review Results Safety Constraints Implementation Hazard Analyses Progress Reports Safety Standards Hazard Analyses
Progress Reports
Design, Work Instructions
Change requests Audit reports Regulations
Industry Associations, Government Regulatory Agencies
Management
Management Project
Government Regulatory Agencies User Associations, Unions,
Documentation
and assurance
and Evolution
SYSTEM OPERATIONS
Insurance Companies, Courts
Physical Actuator(s) Industry Associations, Performance Audits Incidents Change Requests
User Associations, Unions,
Accidents and incidents
Government Reports Lobbying
Hearings and open meetings Accidents
Whistleblowers Change reports Maintenance Reports Operations reports
Accident and incident reports
Problem Reports Hardware replacements
Software revisions
Hazard Analyses Operating Process
Case Law
SYSTEM DEVELOPMENT
Insurance Companies, Courts
Status Reports Operating Assumptions Operating Procedures Revised operating procedures Whistleblowers Change reports Certification Info. rocedures safety reports work logs Manufacturing inspections Hazard Analyses Documentation Design Rationale Company Resources Standards
Safety Policy Operations Reports
Management Operations Resources Standards Safety Policy audits Work Policy, stds. Reports Safety Management Manufacturing Sensor(s) Human Controller(s) Process Automated Controller
2 BRIEF DESCRIPTION OF STAMP 5
the SOHO (SOlar Heliospheric Observatory) spacecraft in 1998 was the failure to communicate to operators that a functional change had been made in a procedure to perform gyro spin-down.
In the analysis of an accident using STAMP, the required constraints to provide safe behavior are first identified for each level of the control structure and then the socio-technical system is examined to determine if and how the constraints were to be enforced and why the controls established to enforce them were ineffective in that particular instance. If the controls had once been potentially effective but had degraded over time, the reasons for that degradation are identified.
2.2 Process Models
Besides constraints and hierarchical levels of control, a third basic concept in STAMP is that of process models. Any controller—human or automated—must contain a model of the system being controlled [3]. The figure below shows a typical control loop where an automated controller is supervised by a human controller.
Automated Controller Model of Model of Process Interfaces Actuators Sensors Model of Process Model of Automation Human Supervisor (Controller) Controlled Process Disturbances Controls Displays Process outputs Measured variables Controlled variables inputs Process
The model of the process (the plant, in control theory terminology) at one extreme may contain only one or two variables (such as that required for a simple thermostat) while at the other extreme it may require a complex model with a large number of state variables and transitions (such as that needed for air traffic control). Whether the model is embedded in the control logic of an automated controller or in the mental model of a human controller, it must contain the same type of information: the required relationship among the system variables (the control laws), the current state (the current values of the system variables), and the ways the process can change state. This model is used to determine what control actions are needed, and it is updated through various forms of feedback. When the model does not match the controlled process, accidents can result.
Accidents, particularly system accidents, often result from inconsistencies between the model of the process used by the controllers (both human and automated) and the actual process state: for example, (1) the software does not know that the plane is on the ground and raises the landing gear or (2) the pilot does not identify an object as friendly and shoots a missile at it or (3) the pilot thinks the aircraft controls are in speed mode but the computer has changed the mode to open descent and the pilot issues inappropriate commands for that mode or (4) the computer does not think the aircraft has landed and overrides the pilots’ attempts to operate the braking system. All of these examples have actually occurred.
System accidents may also involve inadequate coordination among several controllers and deci-sion makers, including unexpected side effects of decideci-sions or actions or conflicting control actions. Communication flaws play an important role here.
2 BRIEF DESCRIPTION OF STAMP 6 Boundary Areas Process 2 Overlapping Control Process Process 1 Controller 2 Controller 1 Controller 2 Controller 1
Leplat suggests that accidents are most likely in boundary areas or in overlap areas where two or more controllers (human and/or automated) control the same process [5]. In both boundary and overlap areas, the potential for ambiguity and for conflicts among independently made decisions exists. When controlling boundary areas, there can be confusion over who is actually in control (which control loop is currently exercising control over the process), leading to missing control actions. The functions in the boundary areas are often poorly defined.
Coordination problems in the control of boundary areas are rife. A Milstar satellite was lost due to inadequate attitude control of the Titan/Centaur launch vehicle, which used an incorrect model of the controlled process based on erroneous inputs in a software load tape. After the accident, it was discovered that nobody had tested the software using the actual load tape—everyone assumed someone else was doing so. A factor in the loss of the Black Hawk helicopters to friendly fire over northern Iraq in 1994 was that the helicopters normally flew only in the boundary areas of the No-Fly-Zone, and procedures for handling aircraft in those areas were ill-defined.
Overlap areas exist when a function is achieved by the cooperation of two controllers or when two controllers exert influence on the same object. Such overlap creates the potential for conflicting control actions. In an A320 accident in Bangalore, India, the pilot had disconnected his flight director during approach and assumed that the co-pilot would do the same. The result would have been a mode configuration in which airspeed is automatically controlled by the autothrottle (the speed mode), which is the recommended procedure for the approach phase. However, the co-pilot had not turned off his flight director, which meant that open descent mode became active when a lower altitude was selected instead of speed mode, eventually contributing to the crash of the aircraft short of the runway.
2.3 A Classification of Accident Factors
In STAMP, accidents result from inadequate control, i.e., the control loop creates or does not handle dysfunctional interactions in the process—including interactions caused both by component failures and by system design flaws. Starting from this basic definition of an accident, the process that leads to accidents can be understood in terms of flaws in the components of the system development and system operations control loops in place during design, development, manufacturing, and operations. These flaws can be classified and used during accident analysis or accident prevention activities to assist in identifying all the factors involved in the accident. Figure 2 shows the general classification.
In each control loop at each level of the socio-technical control structure, unsafe behavior re-sults from either a missing or inadequate constraint on the process at the lower level or inadequate enforcement of the constraint leading to its violation. Because each component of the control loop may contribute to inadequate control, classification starts by examining each of the general control
3 USING STAMP TO ANALYZE A WATER CONTAMINATION ACCIDENT 7
(boundary and overlap areas) (asynchronous evolution)
Process changes without appropriate change in control algorithm
Communication flaw
Inadequate Execution of Control Action
Flaws(s) in updating process (asynchronous evolution)
Inadequate sensor operation (incorrect or no information provided) Time lag
Unidentified hazards
Inadequate Enforcement of Constraints (Control Actions)
Inappropriate, ineffective, or missing control actions for identified hazards
Communication flaw
Design of control algorithm (process) does not enforce constraints
Not provided in system design Flaw(s) in creation process Incorrect modification or adaptation Flaw(s) in creation process
Process models inconsistent, incomplete, or incorrect (lack of linkup)
Inadequate or missing feedback
Inadequate coordination among controllers and decision makers
Time lag
Inadequate actuator operation
Time lags and measurement inaccuracies not accounted for
2.1 . 1.2.3 2.2 2.3 1.2.2 . 1.2.1 1.2 3.1 3.2 3.3 1.1 1. 3.4
Figure 2: A Classification of Control Flaws Leading to Hazards
loop components and evaluating their potential contribution: (1) the controller may issue inade-quate or inappropriate control actions, including inadeinade-quate handling of failures or disturbances in the physical process; (2) control actions may be inadequately executed, or (3) there may be missing or inadequate feedback. These same general factors apply at each level of the socio-technical control structure, but the interpretations (applications) of the factors at each level may differ.
3
Using STAMP to analyze a Water Contamination Accident
As an example, we apply STAMP to an accident involving water contamination [8]. The accident occurred in May 2000 in the small town of Walkerton, Ontario, Canada. Some contaminants, largely Escherichia coli O157:H7 (the common abbreviation for which is E. coli) and Campylobacter jejuni entered the Walkerton water system through a well of the Walkerton municipal water system.
The Walkerton water system was operated by the Walkerton Public Utilities Commission (WPUC). Stan Koebel was the WPUC’s general manager and his brother Frank its foreman. In May 2000, the water system was supplied by three groundwater sources: Wells 5, 6, and 7. The water pumped from each well was treated with chlorine before entering the distribution system.
The source of the contamination was manure that had been spread on a farm near Well 5. Unusually heavy rains from May 8 to May 12 carried the bacteria to the well. Between May 13 and May 15, Frank Koebel checked Well 5 but did not take measurements of chlorine residuals,
3 USING STAMP TO ANALYZE A WATER CONTAMINATION ACCIDENT 8
although daily checks were supposed to be made.1 Well 5 was turned off on May 15.
On the morning of May 15, Stan Koebel returned to work after having been away from Walkerton for more than a week. He turned on Well 7, but shortly after doing so, he learned a new chlorinator for Well 7 had not been installed and the well was therefore pumping unchlorinated water directly into the distribution system. He did not turn off the well, but instead allowed it to operate without chlorination until noon on Friday May 19, when the new chlorinator was installed.
On May 15, samples from the Walkerton water distribution system were sent to A&L Labs for testing according to the normal procedure. On May 17, A&L Labs advised Stan Koebel that samples from May 15 tested positive for E. coli and total coliforms. The next day (May 18) the first symptoms of widespread illness appeared in the community. Public inquiries about the water prompted assurances by Stan Koebel that the water was safe. By May 19 the scope of the outbreak had grown, and a pediatrician contacted the local health unit with a suspicion that she was seeing patients with symptoms of E. coli.
The Bruce-Grey-Owen Sound (BGOS) Health Unit (the government unit responsible for public health in the area) began an investigation. In two separate calls placed to Stan Koebel, the health officials were told that the water was “okay.” At that time, Stan Koebel did not disclose the lab results from May 15, but he did start to flush and superchlorinate the system to try to destroy any contaminants in the water. The chlorine residuals began to recover. Apparently, Mr. Koebel did not disclose the lab results for a combination of two reasons: he did not want to reveal the unsafe practices he had engaged in from May 15-17 (i.e., running Well 7 without chlorination), and he did not understand the serious and potentially fatal consequences of the presence of E. coli in the water system. He continued to flush and superchlorinate the water through the following weekend, successfully increasing the chlorine residuals. Ironically, it was not the operation of Well 7 without a chlorinator that caused the contamination; the contamination instead entered the system through Well 5 from May 12 until it was shut down May 15.
On May 20, the first positive test for E. coli infection was reported and the BGOSHealth Unit called Stan Koebel twice to determine whether the infection might be linked to the water system. Both times, Stan Koebel reported acceptable chlorine residuals and failed to disclose the the adverse test results. The Health Unit assured the public that the water was safe based on the assurances of Mr. Koebel.
That same day, a WPUC employee placed an anonymous call to the Ministry of the Environ-ment (MOE) Spills Action Center, which acts as an emergency call center, reporting the adverse test results from May 15. On contacting Mr. Koebel, the MOE was given an evasive answer and Mr. Koebel still did not reveal that contaminated samples had been found in the water distribu-tion system. The Local Medical Officer was contacted by the health unit, and he took over the investigation. The health unit took their own water samples and delivered them to the Ministry of Health laboratory in London (Ontario) for microbiological testing.
When asked by the MOE for documentation, Stan Koebel finally produced the adverse test results from A&L Laboratory and the daily operating sheets for Wells 5 and 6, but said he could not produce the sheet for Well 7 until the next day. Later, he instructed his brother Frank to revise the Well 7 sheet with the intention of concealing the fact that Well 7 had operated without a chlorinator. On Tuesday May 23, Stan Koebel provided the altered daily operating sheet to the MOE. That same day, the health unit learned that two of the water samples it had collected on May 21 had tested positive for E. coli.
Without waiting for its own samples to be returned, the BGOShealth unit on May 21 had
1Low chlorine residuals are a sign that contamination is overwhelming the disinfectant capacity of the chlorination
3 USING STAMP TO ANALYZE A WATER CONTAMINATION ACCIDENT 9
issued a boil water advisory on local radio. About half of Walkerton’s residents became aware of the advisory on May 21, with some members of the public still drinking the Walkerton town water as late as May 23. The first person died on May 22, a second on May 23, and two more on May 24. During this time, many children became seriously ill and some victims will probably experience lasting damage to their kidneys as well as other long-term health effects. In all, seven people died and more than 2300 become ill.
Looking only at these proximate events, it appears that this is a simple case of incompetence, negligence, and dishonesty by WPUC employees. In fact, the government argued at the Inquiry that Stan Koebel or the Walkerton PUC were solely responsible for the outbreak and that they were the only ones who could have prevented it. But a STAMP analysis provides a much more informative and useful understanding of the accident and what might be changed to prevent future repetitions (besides simply firing the Koebel brothers). In fact, the stage for the accident had been set over a large number of years by actions at all levels of the socio-technical system structure—an example of how complex socio-technical systems can migrate toward an accident.
The dynamic forces that led to the accident had been in place for some time—some going as far back as 20 years—yet the feedback to reveal the safety implications of these forces was largely unavailable to the various actors in the system [12].
Even when the feedback is available, it may be ignored, as in Bhopal where safety auditors had detected and reported the increasingly risky state of the plant two years earlier but none of the recommended changes were made. As we will see, something similar happened at Walkerton.
Vicente and Christoffersen have used the Walkerton accident to test the explanatory adequacy of Rasmussen’s [9] framework for risk management in a dynamic society [12]. In this paper, we use the same accident to illustrate how STAMP can be used to analyze the Walkerton accident and to show a sample notation that can be used to support STAMP analyses.
The first step in creating a STAMP analysis is to identify the system hazards, the system safety constraints, and the control structure in place to enforce the system safety constraints (see Section 3.1). Each component of the socio-technical control structure will have safety constraints relevant to the particular functions of the component. Together, the safety constraints on all the components must be adequate to enforce the overall system safety constraints.
We show the dynamic aspects of accidents in two ways. The first model shows the changes in the static safety control structure over time (see Section 3.2). These are essentially a series of static snapshots of the control structure, and they do not show the dynamic processes in effect that led to the changes. For the latter, we use system dynamics models (see Section 3.3). At this point in the analysis, it is possible to examine the proximate events and their relationship with the safety control structure.
The third modeling effort provides an overall explanation of the accident (Section 3.4). This model contains a summary of the other models in terms of, for each of the control components, the inadequate control actions and decisions and the factors (using the STAMP factors) that led to the accident. This final summary model provides the information necessary to make recommendations to prevent future accidents arising from the same inadequate controls over safety.
3.1 The Socio-Technical Water Safety Control Structure
Figure 3 shows the basic Ontario water quality safety control structure. For space reasons, the operations and development structures have been combined. The general system hazard related to the accident is public exposure to E. coli or other health-related contaminants through drinking water. This hazard leads to the following system safety constraint:
3 USING STAMP TO ANALYZE A WATER CONTAMINATION ACCIDENT 10
The safety control structure must prevent exposure of the public to contaminated water. 1. Water quality must not be compromised.
2. Public health measures must reduce riskof exposure if water quality is compromised (e.g., boil water advisories).
These general constraints must be enforced by requirements and constraints on the entire control structure. The Canadian federal government (not shown in the figure) is responsible for establish-ing a nationwide public health system and ensurestablish-ing it is operatestablish-ing effectively. Federal guidelines are provided to the provinces, but responsibility for water quality is primarily delegated to the individual provinces.
The Ontario government is responsible for regulating and overseeing the safety of Ontario’s drinking water. It does this by providing budgets for the ministries involved, in this case the Min-istry of the Environment (MOE), the MinMin-istry of Health (MOH) and the MinMin-istry of Agriculture, Food, and Rural Affairs, and by passing laws and adopting government policies affecting water safety.
The Ministry of Agriculture, Food, and Rural Affairs is responsible for regulating agricultural activities with potential impact on drinking water sources. In fact, there was no watershed pro-tection plan to protect the water system from agricultural runoff. Instead, the Ministry of the Environment was responsible for ensuring that the water systems could not be affected by such runoff.
The Ministry of the Environment (MOE) has primary responsibililty for regulating and for enforcing legislation, regulations, and policies that apply to the construction and operation of mu-nicipal water systems. Guidelines and objectives are set by the MOE, based on Federal guidelines. They are enforceable through Certificates of Approval issued to public water utilities operators, under the Ontario Water Resources Act. The MOE also had legislative responsibility for building and maintaining water treatment plants.
The Ministry of the Environment had two guidelines related to water safety. Note that guide-lines, unlike regulations, are not legally binding. The Chlorination Bulletin required water systems to treat well water with sufficient chlorine to inactivate any contaminants in the raw water and to sustain a chlorine residual of 0.5 mg/L of water after 15 minutes of contact time. The Ontario Drinking Water Objectives (ODWO) provided further guidelines on the operation of public water systems, including a requirement for the water testing laboratories, which were almost all govern-ment run, to report adverse test results directly to the MOE and to the local Medical Officer of Health (part of the MOH). The Medical Officer of Health could then decide whether to issue a boil water advisory.
The MOE was also responsible for public water system inspections and drinking water surveil-lance, for setting standards for certification of water system, and for continuing education require-ments for operators to maintain competence as knowledge about water safety increased.
The Ministry of Health supervises local Health Units, in this case, the Bruce-Grey-Owen-Sound (BGOS) Department of Health, run by local Officers of Health in executing their role in protecting public health. The BGOSMedical Dept. of Health receives inputs from various sources, including hospitals, the local medical community, the Ministry of Health, and the WPUC, and in turn is responsible for issuing advisories and alerts if required to protect public health. Upon receiving adverse water quality reports from the government testing labs or the MOE, the local public health inspector in Walkerton would normally contact the WPUC to ensure that followup samples were taken and chlorine residuals maintained.
The public water system in Walkerton is run by the Walkerton Public Utilities Commission (WPUC), which operates the wells and is responsible for chlorination and for measurement of
3 USING STAMP TO ANALYZE A WATER CONTAMINATION ACCIDENT 11
BGOS Medical Dept. of Health reports
water samples
requests for info complaints regulatory policy
regulatory policy
ODWO, Chlorination Bulletin inspection and other reports
Certificates of Approval
Establish a nationwide public health system and ensure it is operating effectively. Establish regulatory bodies and codes of responsibilities, authority, and accountability Provide adequate resources to regulatory bodies to carry out their responsibilities. Provide oversight and feedback loops to ensure that provincial regulatory bodies are doing their job adequately.
Ensure adequate risk assessment is conducted and effective risk management plans are in place. Oversight Policies requests water water samples Ministry of Health reports Provincial Federal guidelines reports budgets, laws budgets, laws budgets, laws Ministry of Testing Lab WPUC Commissioners reports reports reports status report contaminants
Provide timely reports on testing results to MOE, PUC, and abatement if water quality is compromised.
Ensure adequate procedures exist for notification and risk
WPUC Operations
WPUC Operations Management WPUC Commissioners
Oversee operations to ensure water quality is not compromised.
Measure chlorine residuals.
Apply adequate doses of cholorine to kill bacteria. BGOS Medical Department of Health
Provide oversight of drinking water quality. Follow up on adverse drinking water quality reports. Issue boil water advisories when necessary. accurate and adequate chlorination is being performed. Monitor operations to ensure that sample taking and reporting is
Establish certification and training requirements for water system operators. Enforce legislation, regulations and policies applying to construction and operation Perform inspections and surveillance. Enforce compliance if problems found.
Establish feedback channels for adverse test results. Provide multiple paths.
and
and Medical Dept. of Health ACES
ACES
Provide stakeholder and public review and input on ministry standards
System Hazard: Public is exposed to e. coli or other health−related contaminants through drinking water.
System Safety Constraints:
(1) Water quality must not be compromised.
(2) Public health measures must reduce risk of exposure if water quality is compromised (e.g., notification and procedures to follow) The safety control structure must prevent exposure of the public to contaminated water.
reports MOE inspection
regulations
Perform hazard analyses to identify vulnerabilities and monitor them.
Perform continual risk evaluation for existing facilities and establish new controls if necessary.
Establish criteria for determining whether a well is at risk.
Ensure that those in charge of water supplies are competent to carry out their responsibilities.
of municipal water systems.
Ministry of Health
Government Water Testing Labs Government
Provincial Government Federal Government
Safety Requirements and Constraints:
Ministry of the Environment
Advisories, warnings
hospital reports, input from medical community
chlorine residual measurement
Public Health Water system Well 7 Well 6 Well 5 selectionWell chlorination operations Walkerton PUC the Environment Ministry of Agriculture, Food, and Rural Affairs Residents Walkerton Government
Figure 3: The Basic Water Safety Control Structure. Lines going into the left of a box are control lines. Lines from or to the top or bottom of a box represent information, feedback, or a physical flow. Rectangles with sharp corners are controllers while rectangles with rounded corners represent plants.
3 USING STAMP TO ANALYZE A WATER CONTAMINATION ACCIDENT 12
chlorine residuals. Oversight of the WPUC is provided by elected WPUC Commissioners. The Commissioners were responsible for establishing and controlling the policies under which the PUC operated, while the general manager (Stan Koebel) and staff were responsible for administering these policies in operating the water facility.
This then is the basic water safety control structure. The next step in the STAMP analysis is to examine the changes in this structure leading to the accident.
3.2 Changes in the Safety Control Structure Leading Up to the Accident
The water safety control structure started out with some weaknesses that were mitigated by the presence of other controls. As the other controls weakened or disappeared over time, the entire socio-technical system moved to a state where a small change in the operation of the system or in the environment (in this case, unusually heavy rain) could lead to a tragedy. Almost all the information about the accident that follows is from the official Walkerton Inquiry report [8] or from a magazine article about the tragedy by a local farmer [4].
Walkerton Well 5 was built in 1978 and issued a Certificate of Approval by the MOE in 1979. Despite potential problems—the groundwater supplying the well was recognized as being vulnerable to surface contamination—no explicit operating conditions were imposed at the time. Well 5 was a very shallow well: all of its water was drawn from an area between 5m and 8m below the surface. More significantly, the water was drawn from an area of bedrock, and the shallowness of the soil overburden above the bedrock along with the fractured and porous nature of the bedrock itself made it possible for surface bacteria to make its way to Well 5.
Although the original Certificate of Approval for Well 5 did not include any special operating conditions, over time MOE practices changed. By 1992, the MOE had developed a set of model operating conditions for water treatment and monitoring that were routinely attached to new Certificates of Approval for municipal water systems. There was no effort, however, to determine whether such conditions should be attached to existing certificates, such as the one for Well 5.
The ODWO was amended in 1994 to require the continuous monitoring of chlorine residuals and turbidity for wells supplied by a groundwater source that was under the direct influence of surface water (as was Walkerton’s Well 5). Automatic monitoring and shutoff valves would have mitigated the operational problems at Walkerton and prevented the deaths and illness associated with the E. coli contamination in May 2000 if the requirement had been enforced in existing wells. However, at the time, there was no program or policy to review existing wells to determine whether they met the requirements for continuous monitoring. In addition, MOE inspectors were not directed to notify well operators (like the Koebel brothers) of the new requirement nor to assess during inspections if a well required continuous monitoring. Stan and Frank Koebel lacked the training and expertise to identify the vulnerability of Well 5 themselves and to understand the resulting need for continuous chlorine residual and turbidity monitors.
Operating conditions should theoretically have been imposed by the municipality, the Walkerton Public Utilities Commissioners, and the manager of the WPUC. The municipality left the operation of the water system to the WPUC. The WPUC Commissioners, who were elected, became over the years more focused on the finances of the PUC than the operations. They had little or no training or knowledge of water system operations or even water quality itself. Without such knowledge and with their focus on financial issues, they gave all responsibility for operations to the manager of the WPUC (Stan Koebel) and provided no other operational oversight.
The operators of the Walkerton water system did not intentionally put the public at risk. Stan Koebel and the other WPUC employees believed the untreated water was safe and often drank it themselves at the well sites. Local residents also pressed the WPUC to decrease the amount of
3 USING STAMP TO ANALYZE A WATER CONTAMINATION ACCIDENT 13
chlorine used because they objected to the taste of chlorinated water.
Although Mr. Koebel knew how to operate the water system mechanically, he lacked knowledge about the health risks associated with a failure to properly operate the system and of the importance of following the MOE requirements for treatment and monitoring. This incorrect mental model was reinforced when over the years he received mixed messages from the MOE about the importance of several of its own requirements.
Before 1993, there were no mandatory certification requirements for water system operators or managers. Stan and Frank Koebel were not qualified to hold their positions within the WPUC, but they were certified in 1993 through a grandfathering scheme based solely on experience. They were not required to take a training course or to pass any examinations.
After the introduction of mandatory certification in 1993, the MOE required 40 hours of training a year for each certified operator. Stan and Frank Koebel did not take the required amount of training, and the training they did take did not adequately address drinking water safety. The MOE did not focus the training on drinking water safety and did not enforce the training requirements. The Koebel brothers and the Walkerton commissioners were not the only ones with inadequate training and knowledge of drinking water safety. Evidence at the Inquiry showed that several environmental officers in the MOE’s local office were unaware that E. coli was potentially lethal and their mental models were also incorrect with respect to other matters essential to water safety. Without regulations or oversight or enforcement of safe operating conditions, and with inade-quate mental models of the safety requirements, operating practices have a tendency to change over time in order to optimize a variety of goals that conflict with safety. In the case of Walkerton, this change began almost immediately. The Inquiry report says that many improper operating practices had been going on for years before Stan Koebel became manager. He simply left them in place. These practices, some of which went back 20 years, included misstating the locations at which samples for microbiological testing were taken, operating wells without chlorination, making false entries in daily operating sheets, failing to measure chlorine residuals daily, failing to adequately chlorinate the water, and submitting false annual reports to the MOE.
All of these weaknesses in the control over the Walkerton (and other municipalities) water quality might have been mitigated if the source of contamination of the water had been controlled. A weakness in the basic water control structure was the lack of a government watershed and land use policy for agricultural activities that can impact drinking water sources. In fact, at a meeting of the Walkerton town council in November 1978 (when Well 5 was constructed), MOE representatives suggested land use controls for the area around Well 5, but the municipality did not have the legal means to enforce such land use regulations because the government of Ontario had not provided the legal basis for such controls.
Walkerton is at the heart of Ontario’s Bruce county, a major farming area. Whereas the existing water quality infrastructure and physical well designs were able to handle the amount of manure produced when farms typically produced 50 or 60 animals at a time, the increase in factory farms (each of which might have 1200 hogs) led to runoff of agricultural contaminants and put pressure on the drinking water quality infrastructure. At the time of the accident, the county had a population of only 60,000 people, but had 163,000 beef cattle and 100,000 hogs. A single 1200 hog factory farm can produce as much waste as 60,000 people and the entire animal population in the county at that time produced as much waste as 1.6 million people. This animal waste is spread on the fields adjacent to the farms, which cannot absorb such massive quantities of manure. Contamination of the groundwater and surrounding waterways is the result. At the same time, the spreading of manure had been granted a long-standing exemption from EPA requirements.
Annual reports of the Environment Commissioner of Ontario for the four years before the Walkerton accident included recommendations that the government create a groundwater strategy.
3 USING STAMP TO ANALYZE A WATER CONTAMINATION ACCIDENT 14
A Health Canada study stated that the cattle counties of Southwestern Ontario, where Walkerton is located, are high-risk areas for E. coli infections. The report pointed out the direct link between cattle density and E. coli infection, and showed that 32 percent of the wells in rural Ontario showed fecal contamination. Dr. Murray McQuigge, the Medical Officer of Health for the BGOS Health Unit (and the man who handled the Walkerton E. coli outbreak) warned in a memo to local authorities that “poor nutrient management on farms is leading to a degradation of the quality of ground water, streams, and lakes.” Nothing was done in response.
The control structure quickly started to degrade even further in effectiveness with the election of a conservative provincial government in 1995. A bias against environmental regulation and red tape led to the elimination of many of the government controls over drinking water quality. A Red Tape Commission was established by the provincial government to minimize reporting and other requirements on government and private industry. At the same time, the government disbanded groups like the Advisory Committee on Environmental Standards (ACES), which reviewed ministry standards including those related to water quality. At the time of the Walkerton contamination, there was no opportunity for stakeholder or public review of the Ontario clean water controls.
Budget and staff reductions by the conservative government took a major toll on environmental programs and agencies (although budget reductions had started before the election of the new provincial government). The MOE budget was reduced by 42% and 900 of the 2400 staff responsible for monitoring, testing, inspection, and enforcement of environmental regulations were laid off. The official Walkerton Inquiry report concludes that the reductions were not based on an assessment of the requirements to carry out the MOE’s statutory requirements nor on any risk assessment of the potential impact on the environment or, in particular on water quality. After the reductions, the Provincial Ombudsman issued a report saying that cutbacks had been so damaging that the government was no longer capable of providing the services that it was mandated to provide. The report was ignored.
In 1996, the Water Sewage Services Improvement Act was passed, which shut down the govern-ment water testing laboratories, downloaded control of provincially owned water and sewage plants to the municipalities, eliminated funding for municipal water utilities, and ended the provincial Drinking Water Surveillance Program, under which the MOE had monitored drinking water across the province.
The ODWO directed testing labs to report any indications of unsafe water quality to the MOE and to the local Medical Officer Of Health. The latter would then decide whether to issue a boil water advisory. When government labs conducted all of the routine drinking water tests for municipal water systems throughout the province, it was acceptable to keep the notification protocol in the form of a guideline under the ODWO rather than a legally enforceable law or regulation. However, the privatization of water testing and the exit of government labs from this duty in 1996 made the use of guidelines ineffective in ensuring necessary reporting would occur. At the time, private environmental labs were not regulated by the government. No criteria were established to govern the quality of testing or the qualifications or experience of private lab personnel, and no provisions were made for licensing, inspection, or auditing of private labs by the government. In addition, the government did not implement any program to monitor the effect of privatization on the notification procedures followed whenever adverse test results were found.
At the time of privatization in 1996, the MOE sent a guidance document to those municipalities that requested it. The document strongly recommended that a municipality include in any contract with a private lab a clause specifying that the laboratory directly notify the MOE and the local Medical Officer of Health about adverse test results. There is no evidence that the Walkerton PUC either requested or received this document.
3 USING STAMP TO ANALYZE A WATER CONTAMINATION ACCIDENT 15
the MOH Health Unit for the Walkerton area sought assurances from the MOE’s local office that the Health Unit would continue to be notified of all adverse water quality results relating to community water systems. It received that assurance, both in correspondence and at a meeting.
In 1997, the Minister of Health took the unusual step of writing to the Minister of the Environ-ment requesting that legislation be amended to ensure that the proper authorites would be notified of adverse water test results. The Minister of the Environment declined to propose legislation, indicating that the ODWO dealt with the issue. On several occasions, officials in the MOH and the MOE expressed concerns about failures to report adverse test results to local Medical Officers of Health in accordance with the ODWO protocol. But the anti-regulatory culture and the existence of the Red Tape Commission discouraged any proposals to make notification legally binding on the operators or municipal water systems and private labs.
The testing laboratory used by Walkerton in May 2000, A&L Canada Laboratories East, was unaware of the notification guideline in the ODWO. In fact, they considered test results to be confidential and thus improper to send to anyone but the client (in this case, the WPUC manager Stan Koebel). The MOE had no mechanism for informing private laboratories of the existing guidelines for reporting adverse results to the MOE.
Another important impact of the 1996 law was a reduction in the MOE water system inspection program. The cutbacks at the MOE negatively impacted the number of inspections, although the inspection program had other deficiencies as well.
The MOE inspected the Walkerton water system in 1991, 1995, and 1998. At the time of the inspections, problems existed relating to water safety. Inspectors identified some of them, but unfortunately two of the most significant problems—the vulnerability of Well 5 to surface contam-ination and the improper chlorcontam-ination and monitoring practices of the PUC—were not detected. Information about the vulnerability of Well 5 was available in MOE files, but inspectors were not directed to look at relevant information about the security of water sources and the archived in-formation was not easy to find. Inin-formation about the second problem, improper chlorination and monitoring practices of the WPUC, was there to be seen in the operating records maintained by the WPUC. The Inquiry report concludes that a proper examination of the daily operating sheets would have disclosed the problem. However, the inspectors were not instructed to carry out a thorough review of operating records.
The 1998 inspection report did show there had been problems with the water supply for years: detection of E. coli in treated water with increasing frequency, chlorine residuals in treated wa-ter at less than the required 0.5 mg/L, non-compliance with minimum bacwa-teriological sampling requirements, and not maintaining proper training records.
The MOE outlined improvements that should be made, but desperately short of inspection staff and faced with small water systems across the province that were not meeting standards, it never scheduled a follow-up inspection to see if the improvements were in fact being carried out. The Inquiry report suggests that the use of guidelines rather than regulations had an impact here. The report states that had the Walkerton PUC been found to be in non-compliance with a legally enforceable regulation, as opposed to a guideline, it is more likely that the MOE would have taken stronger measures to ensure compliance—such as the use of further inspections, the issuance of a Director’s Order (which would have required the WPUC to comply with the requirements for treatment and monitoring), or enforcement proceedings. The lack of any followup or enforcement efforts may have led the Koebel brothers to believe the recommendations were not very important, even to the MOE.
The WPUC Commissioners received a copy of the 1998 inspection report but did nothing beyond asking for an explanation from Stan Koebel and accepting his word that he would correct the deficient practices. They never followed up to make sure he did.
3 USING STAMP TO ANALYZE A WATER CONTAMINATION ACCIDENT 16
The mayor of Walkerton and the municipality also received the report but they assumed the WPUC would take care of the problems. When the local Walkerton public health inspector read the report, he filed it, assuming that the MOE would ensure that the problems identified were properly addressed. Note the coordination problems here in an area of overlapping control (discussed in Section 2.2). Both the MOE and the local public health inspector should have followed up on the 1998 inspection report, but there was no written protocol instructing the public health inspector on how to respond to adverse water quality reports or inspection reports. The MOE also lacked such protocols. The Province’s water safety control structure had clearly become ineffective.
A final important change in the safety control structure involved the drinking water surveillance program in which the MOE monitored drinking water across the province. In 1996, the Provincial government dropped E. coli testing from its Drinking Water Surveillance Program. The next year, the Drinking Water Surveillance Program was shut down entirely. At the same time, the provincial government directed MOE staff not to enforce dozens of environmental laws and regulations still on the books. Farm operators, in particular, were to be treated with understanding if they were discovered to be in violation of livestock and waste-water regulations. By June, 1998, the Walkerton town council was concerned enough about the situation to send a letter directly to the Premier (Mike Harris), appealing for the province to resume testing of municipal water. There was no reply. MOE officials warned the government that closing the water testing program would endanger public health. Their concerns were dismissed. In 1997, senior MOE officials drafted another memo that the government did heed [4]. This memo warned that cutbacks had impaired the Ministry’s ability to enforce environmental regulations to the point that the Ministry could be exposed to lawsuits for negligence if and when an environmental accident occurred. In response, the Provincial government called a meeting of the Ministry staff to discuss how to protect itself from liability, and it passed a Bill (“The Environmental Approvals Improvement Act”) which, among other things, prohibited legal action against the government by anyone adversely affected by the Environment Minister’s failure to apply environmental regulations and guidelines.
Many other groups warned senior government officials, ministers, and the Cabinet of the danger of what it was doing, such as reducing inspections and not making the notification guidelines into regulations. The warnings were ignored. Environmental groups prepared briefs. The Provincial Auditor, in his annual reports, criticized the MOE for deficient monitoring of groundwater resources and for failing to audit small water plants across the province. The International Joint Commission expressed its concerns about Ontario’s neglect of water quality issues, and the Environmental Commissioner of Ontario warned that the government was compromising environmental protection, pointing specifically to the testing of drinking water as an area of concern.
In January 2000 (three months before the Walkerton accident), staff at the MOE’s Water Policy Branch submitted a report to the Provincial government warning that “Not monitoring drinking water quality is a serious concern for the Ministry in view of its mandate to protect public health.” The report stated that a number of smaller municipalities were not up to the job of monitoring the quality of their drinking water. It further warned that because of the privatization of the testing labs, there was no longer a mechanism to ensure that the MOE and the local Medical Officer of Health were informed if problems were detected in local water systems. The Provincial government ignored the report.
The warnings were not limited to groups or individuals. Many adverse water quality reports had been received from Walkerton between 1995 and 1998. During the mid to late 1990s, there were clear indications that the water quality was deteriorating. In 1996, for example, hundreds of people in Collingswood (a town near Walkerton), became ill after cryptosporidium (a parasite linked to animal feces) contaminated the drinking water. Nobody died, but it should have acted as a warning that the water safety control structure had degraded. Between January and April of
3 USING STAMP TO ANALYZE A WATER CONTAMINATION ACCIDENT 17 reports Government Health Ministry of Dept. of Health BGOS Medical water samples water Water system Well 7 Well 6 Well 5 selectionWell chlorination operations Walkerton PUC Public Health info financial
hospital reports, input from medical community
Advisories, warnings budget WPUC Commissioners Provincial reports reports reports water samples
Inspection and other reports
Testing Lab reports
and requests status MOE Inspection reports guidelines Certificates of Approval ODWO, Chlorination Bulletin
contaminants Ministry of budgets, laws budgets, laws budgets, laws reports reports guidelines Federal
chlorine residual measurement
Testing Lab water samples report lab Private Government Residents Walkerton the Environment Rural Affairs Food, and Agriculture, Ministry of
Figure 4: The Basic Water Safety Control Structure at the Time of the Accident. Dotted lines represent communication, control, or feedback channels that had become ineffective.
2000 (the months just prior to the May E. coli outbreak), the lab that tested Walkerton’s water repeatedly detected coliform bacteria—an indication that surface water was getting into the water supply. The lab notifed the MOE on five separate occasions. The MOE in turn phoned the WPUC, was assured the problems were being fixed, and let it go at that. The MOE failed to inform the Medical Officer of Health, as by law it was required to do. One of the reasons for the delay in issuing a boil water advisory when the symptoms of E. coli contamination started to appear in Walkerton was that the latest report in the local Health Unit’s files of any problems with the water was over two years old. In May 2000, Walkerton changed its testing lab to A&L Canada who, as noted above, did not know about the reporting guidelines.
The Walkerton Inquiry report notes that the decisions to remove the water safety controls in Ontario or to reduce their enforcement were taken without an assessment of the risks or the preparation of a risk management plan. The report says there was evidence that those at the most senior levels of government who were responsible for the decisions considered the risks to be manageable, but there was no evidence that the specific risks were properly assessed or addressed. All of these changes in the Ontario water safety control structure over time led to the modified control structure shown in Figure 4. One thing to notice in comparing Figure 3 and Figure 4 is the disappearance of many of the feedback loops. When the models are shown on a computer, graphics can be used to illustrate and assist in understanding the changes in the control structure over time.
3 USING STAMP TO ANALYZE A WATER CONTAMINATION ACCIDENT 18
3.3 Dynamic Process Model
As we have seen, the system’s defenses or safety controls may degrade over time due to changes in the behavior of the components of the safety control loop. The reasons for the migration of the system toward a state of higher risk will be system specific and can be quite complex. In contrast to the usually simple and direct relationships represented in event chain accident models, most accidents in complex systems involve relationships between events and human actions that are highly non-linear, involving multiple feedback loops. The analysis or prevention of these accidents therefore requires an understanding not only of the static structure of the system (the structural complexity) and of the changes to this structure over time (the structural dynamics), but also the dynamics behind these changes (the behavioral or dynamic complexity). The previous section presented an approach to describing and analyzing the static safety control structure and how to use that to describe the changes to that structure that occur over time. This section presents a way to model and understand the dynamic processes behind the changes to the static control structure and why it changed over time, potentially leading to ineffective controls and unsafe or hazardous states.
The approach proposed uses the modeling techniques of system dynamics. The field of system dynamics, created at MIT in the 1950’s by Jay Forrester, is designed to help decision makers learn about the structure and dynamics of complex systems, to design high leverage policies for sustained improvement, and to catalyze successful implementation and change. Drawing on engineering control theory and the modern theory of nonlinear dynamical systems, system dynamics involves the development of formal models and simulators to capture complex dynamics and to create an environment for organizational learning and policy design.
These ideas are particularly relevant when analyzing system accidents. The world is dynamic, evolving, and interconnected, but we tend to make decisions using mental models that are static, narrow, and reductionist. Thus decisions that might appear to have no effect on safety—or even appear to be beneficial—may in fact degrade safety and increase risk. Using system dynamics, one can, for example, understand and predict instances of policy resistance or the tendency for well-intentioned interventions to be defeated by the response of the system to the intervention itself. A companion paper submitted to this workshop presents archetypical system dynamic models often associated with accidents.
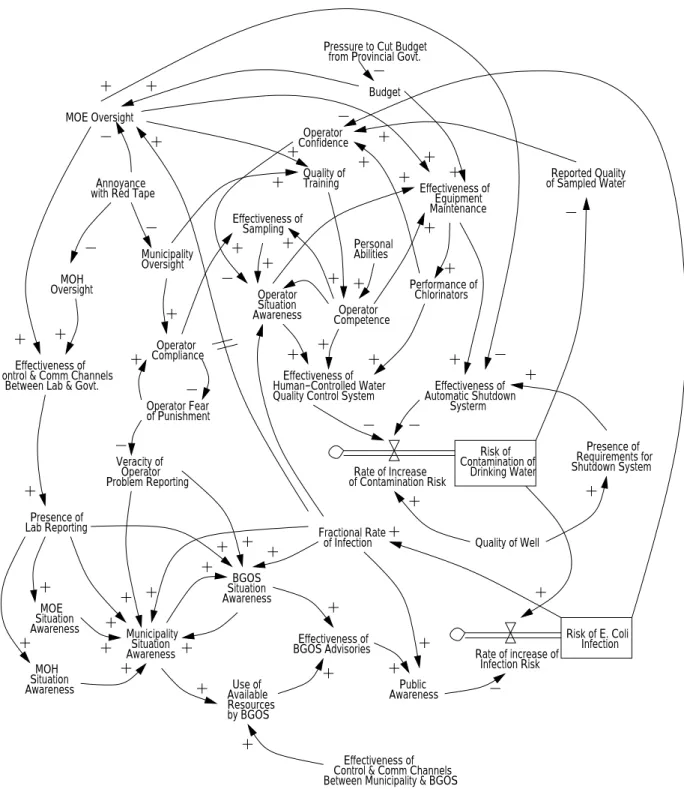
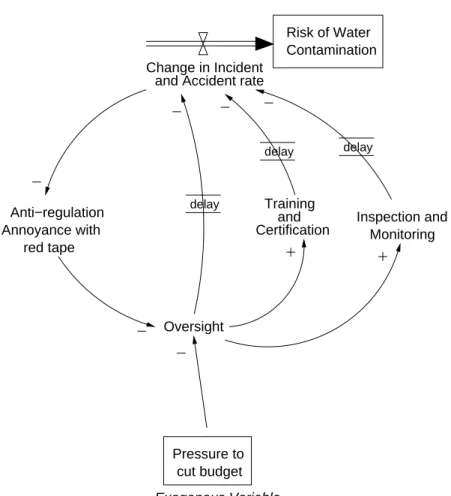
Figure 5 shows a system dynamics model for the Walkerton accident. The basic structures in the model are variables, stocks (represented by rectangles), and flows (double arrows into and out of stocks). Lines with arrows between the structures represent causality links, with a positive polarity meaning that a change in the original variable leads to a change in the same direction in the target variable. Similarly, a negative polarity means that a change in the original variable leads to a change in the opposite direction of the target variable. Double lines across a link represent a delay. Delays introduce the potential for instabilities in the system. Figure 5 shows a simplified part of the model in Figure 6 to assist readers unfamiliar with system dynamics modeling.
Modeling the entire system dynamics is usually impractical. The challenge is to choose relevant subsystems and model them appropriately for the intended purpose. STAMP provides the guidance for determining what to model when the goal is risk management. In the example provided, we focused primarily on the organizational factors, excluding the physical processes allowing the mixing of manure with the source water. Depending on the scope or purpose of the model, different processes could be added or removed.
In complex systems, all dynamics, despite their complexity, arise from two types of feedback loops [10]: positive (reinforcing) and negative (balancing). In system dynamics terms, degradation over time of the safety control structure, as represented by reinforcing loops, would lead inevitably
3 USING STAMP TO ANALYZE A WATER CONTAMINATION ACCIDENT 19
Pressure to Cut Budget from Provincial Govt.
Budget
ontrol & Comm Channels MOE Oversight
Effectiveness of Human−Controlled WaterEffectiveness of Effectiveness of Sampling Operator Confidence Effectiveness of Automatic Shutdown Systerm Reported Quality of Sampled Water Operator Competence Operator Situation Awareness Risk of E. Coli Infection Presence of Quality Control System
Control & Comm Channels Between Municipality & BGOS Municipality Situation Awareness MOH Situation Awareness MOE Situation Awareness Presence of Lab Reporting Veracity of Operator Problem Reporting Risk of Contamination of
Drinking Water Shutdown System
Use of MOH Oversight BGOS Situation Awareness Quality of Training Quality of Well Municipality Oversight Effectiveness of Between Lab & Govt.
Operator Compliance
of Punishment Operator Fear with Red TapeAnnoyance
Available Requirements for Fractional Rate of Infection Effectiveness of BGOS Advisories AwarenessPublic Rate of Increase of Contamination Risk Rate of increase of Infection Risk Personal Abilities Effectiveness of Equipment Maintenance Performance of Chlorinators by BGOS Resources
3 USING STAMP TO ANALYZE A WATER CONTAMINATION ACCIDENT 20
Exogenous Variable
Oversight Change in Incident
and Accident rate
cut budget Pressure to Training and Certification Anti−regulation Annoyance with red tape Inspection and Monitoring delay delay Risk of Water Contamination delay
Figure 6: A Part of the System Dynamics Model for Walkerton. This model describes how pressure to cut budgets (an exogenous variable external to the model) leads to decreased oversight. The level of oversight affects training and certification as well as inspection and monitoring, both of which inpact risk. The loop on the left says that as oversight decreases, the incident and accident rate will increase, which should decrease anti-regulatory pressures, thus leading to increased oversight and thence to decreases in the accident rate. The delay between changes in oversight and changes in the accident rate, however, introduces instabilities in the system (as is true in any control system). The lack of immediate feedback from incidents and accidents after oversight is reduced contributes to increased pressures to reduce oversight until the stage for a major tragedy is set.
3 USING STAMP TO ANALYZE A WATER CONTAMINATION ACCIDENT 21
to an accident, but there are balancing loops, such as regulation and oversight that control those changes. In Ontario, as feedback and monitoring controls were reduced, the mental model of the central government leaders and the ministries responsible for water quality about the current state of the water system became increasingly divorced from reality. A belief that the water quality controls were in better shape than they actually were led to disregarding warnings and continued reduction in what were regarded as unnecessary regulation and red tape.
Accidents occur when the balancing loops do not adequately overcome the influences degrading the safety controls. Understanding why this degradation occurred (why risk increased) is an im-portant part of understanding why the accident occurred and learning how to prevent repetitions in the future, i.e. how to set up more effective safety control structures. It is also an important part of identifying when the socio-technical system is moving toward a state of unacceptable risk.
Our Walkerton model includes a number of exogenous variables (pressure to cut budgets, at-tempts by a conservative government to reduce business and government red tape, etc.) that act as levers on the behaviors of the system. When these variables are changed without any consideration of the dynamics of the system being modeled, the effectiveness of the safety control structure can deteriorate progressively, with few if any visible signs. For instance, the attempts to reduce red tape decreased the oversight of the ministries and municipalities. This decrease in oversight in turn had a negative effect on the control and communication channels between the government and the laboratories performing water quality analyses. Eventually, the laboratories stopped reporting the results of the tests. Because of this lack of reporting, the Walkerton municipality was much slower to realize that the water was contaminated, leading to a delay in the mobilization of the resources needed to deal with the contamination, and the effectiveness of the advisories issued was thus greatly diminished, increasing the risk of infection in the population.
Accident investigations often end with blame being assigned to particular individuals, often influenced by legal or political factors. The system dynamics models, on the other hand, can show how the attitude and behavior of individuals is greatly affected by the rest of the system and how and why such behavior may change over time. For instance, operator competence depends on the quality of training, which increases with government oversight but may decrease over time without such oversight due to competing pressures. An operator’s fear of punishment, which in this case led Stan Koebel to lie about the adverse water quality test reports, is balanced by compliance with existing rules and regulations. This compliance, in turn, is directly influenced by the extent of government oversight and by the government’s response to similar behavior in the past.
Note that even though the STAMP analysis of the Walkerton water system contamination provided thus far has not yet even gotten to the point where most accident investigations start— the proximate events to the loss—it is clear that the system was in a state where the risk of an accident was very high and a lot of different scenarios (or triggers) could have led to a tragedy. Most of the information required to understand the reasons for this accident (or at least the context in which it happened and why it was likely to occur) are outside the usual proximate chain of events used to describe the cause of an accident and to identify a “root cause.”
3.4 Summary Accident Analysis (Causal Analysis)
At this point it is now possible to show the proximate events and see how they combined with the inadequate safety control structure at the time to lead to the Walkerton E. coli contamination. A STAMP analysis shows the interactions not as a chain of events showing direct relationships between events but in terms of the implications and feedback relationships on the safety control structure. For space reasons, we will not repeat a description of the events nor show them on the control structure.