arXiv:1304.5422v2 [hep-ex] 26 Apr 2013
Measurement of the ZZ production cross section and search for the standard model
Higgs boson in the four lepton final state in p ¯
p
collisions
V.M. Abazov,31B. Abbott,66 B.S. Acharya,25 M. Adams,45 T. Adams,43 J.P. Agnew,40 G.D. Alexeev,31
G. Alkhazov,35 A. Altona,55 A. Askew,43 S. Atkins,53 K. Augsten,7 C. Avila,5 F. Badaud,10 L. Bagby,44
B. Baldin,44 D.V. Bandurin,43S. Banerjee,25 E. Barberis,54 P. Baringer,52J.F. Bartlett,44 U. Bassler,15
V. Bazterra,45 A. Bean,52M. Begalli,2 L. Bellantoni,44 S.B. Beri,23G. Bernardi,14R. Bernhard,19 I. Bertram,38
M. Besan¸con,15 R. Beuselinck,39 P.C. Bhat,44 S. Bhatia,57 V. Bhatnagar,23 G. Blazey,46 S. Blessing,43K. Bloom,58
A. Boehnlein,44 D. Boline,63 E.E. Boos,33 G. Borissov,38 A. Brandt,69 O. Brandt,20 R. Brock,56 A. Bross,44
D. Brown,14 X.B. Bu,44 M. Buehler,44 V. Buescher,21 V. Bunichev,33 S. Burdinb,38 C.P. Buszello,37
E. Camacho-P´erez,28 B.C.K. Casey,44 H. Castilla-Valdez,28 S. Caughron,56 S. Chakrabarti,63 K.M. Chan,50
A. Chandra,71 E. Chapon,15G. Chen,52 S.W. Cho,27 S. Choi,27 B. Choudhary,24 S. Cihangir,44 D. Claes,58
J. Clutter,52 M. Cooke,44W.E. Cooper,44 M. Corcoran,71F. Couderc,15M.-C. Cousinou,12 D. Cutts,68 A. Das,41
G. Davies,39S.J. de Jong,29, 30 E. De La Cruz-Burelo,28 F. D´eliot,15R. Demina,62 D. Denisov,44 S.P. Denisov,34
S. Desai,44 C. Deterred,20 K. DeVaughan,58 H.T. Diehl,44 M. Diesburg,44 P.F. Ding,40 A. Dominguez,58
A. Dubey,24 L.V. Dudko,33 A. Duperrin,12 S. Dutt,23 M. Eads,46D. Edmunds,56 J. Ellison,42 V.D. Elvira,44
Y. Enari,14H. Evans,48 V.N. Evdokimov,34L. Feng,46 T. Ferbel,62F. Fiedler,21 F. Filthaut,29, 30 W. Fisher,56
H.E. Fisk,44 M. Fortner,46 H. Fox,38 S. Fuess,44 A. Garcia-Bellido,62 J.A. Garc´ıa-Gonz´alez,28V. Gavrilov,32
W. Geng,12, 56 C.E. Gerber,45 Y. Gershtein,59 G. Ginther,44, 62 G. Golovanov,31 P.D. Grannis,63 S. Greder,16
H. Greenlee,44G. Grenier,17 Ph. Gris,10 J.-F. Grivaz,13 A. Grohsjeanc,15 S. Gr¨unendahl,44M.W. Gr¨unewald,26
T. Guillemin,13 G. Gutierrez,44P. Gutierrez,66 J. Haley,54 L. Han,4 K. Harder,40 A. Harel,62 J.M. Hauptman,51
J. Hays,39 T. Head,40 T. Hebbeker,18 D. Hedin,46 H. Hegab,67 A.P. Heinson,42 U. Heintz,68 C. Hensel,20
I. Heredia-De La Cruzd,28 K. Herner,44G. Heskethf,40 M.D. Hildreth,50 R. Hirosky,72T. Hoang,43 J.D. Hobbs,63
B. Hoeneisen,9 J. Hogan,71 M. Hohlfeld,21 R. Hooperk,68 I. Howley,69 Z. Hubacek,7, 15 V. Hynek,7 I. Iashvili,61
Y. Ilchenko,70R. Illingworth,44 A.S. Ito,44 S. Jabeen,68 M. Jaffr´e,13A. Jayasinghe,66J. Holzbauer,57M.S. Jeong,27
R. Jesik,39 P. Jiang,4 K. Johns,41 E. Johnson,56M. Johnson,44 A. Jonckheere,44 P. Jonsson,39 J. Joshi,42
A.W. Jung,44A. Juste,36 E. Kajfasz,12D. Karmanov,33I. Katsanos,58R. Kehoe,70S. Kermiche,12N. Khalatyan,44
A. Khanov,67A. Kharchilava,61Y.N. Kharzheev,31 I. Kiselevich,32 J.M. Kohli,23 A.V. Kozelov,34J. Kraus,57
A. Kumar,61 A. Kupco,8 T. Kurˇca,17V.A. Kuzmin,33 S. Lammers,48 P. Lebrun,17 H.S. Lee,27 S.W. Lee,51
W.M. Lee,43 X. Lei,41 J. Lellouch,14 D. Li,14 H. Li,72 L. Li,42 Q.Z. Li,44 J.K. Lim,27 D. Lincoln,44
J. Linnemann,56V.V. Lipaev,34 R. Lipton,44 H. Liu,70 Y. Liu,4A. Lobodenko,35M. Lokajicek,8 R. Lopes de Sa,63
R. Luna-Garciag,28 A.L. Lyon,44A.K.A. Maciel,1 R. Madar,19 R. Maga˜na-Villalba,28S. Malik,58 V.L. Malyshev,31
J. Mansour,20 J. Mart´ınez-Ortega,28R. McCarthy,63 C.L. McGivern,40 M.M. Meijer,29, 30 A. Melnitchouk,44
D. Menezes,46 P.G. Mercadante,3 M. Merkin,33 A. Meyer,18 J. Meyeri,20 F. Miconi,16 N.K. Mondal,25
M. Mulhearn,72 E. Nagy,12M. Narain,68R. Nayyar,41H.A. Neal,55 J.P. Negret,5 P. Neustroev,35H.T. Nguyen,72
T. Nunnemann,22 J. Orduna,71N. Osman,12 J. Osta,50 A. Pal,69 N. Parashar,49 V. Parihar,68S.K. Park,27
R. Partridgee,68 N. Parua,48A. Patwaj,64 B. Penning,44M. Perfilov,33 Y. Peters,20 K. Petridis,40G. Petrillo,62
P. P´etroff,13M.-A. Pleier,64 V.M. Podstavkov,44A.V. Popov,34 M. Prewitt,71 D. Price,48 N. Prokopenko,34
J. Qian,55 A. Quadt,20 B. Quinn,57 P.N. Ratoff,38 I. Razumov,34 I. Ripp-Baudot,16 F. Rizatdinova,67
M. Rominsky,44 A. Ross,38 C. Royon,15 P. Rubinov,44 R. Ruchti,50 G. Sajot,11 A. S´anchez-Hern´andez,28
M.P. Sanders,22 A.S. Santosh,1 G. Savage,44 L. Sawyer,53 T. Scanlon,39R.D. Schamberger,63Y. Scheglov,35
H. Schellman,47 C. Schwanenberger,40R. Schwienhorst,56 J. Sekaric,52 H. Severini,66 E. Shabalina,20 V. Shary,15
S. Shaw,56 A.A. Shchukin,34 V. Simak,7 P. Skubic,66 P. Slattery,62 D. Smirnov,50 G.R. Snow,58 J. Snow,65
S. Snyder,64 S. S¨oldner-Rembold,40L. Sonnenschein,18K. Soustruznik,6 J. Stark,11 D.A. Stoyanova,34M. Strauss,66
L. Suter,40 P. Svoisky,66 M. Titov,15 V.V. Tokmenin,31 Y.-T. Tsai,62D. Tsybychev,63B. Tuchming,15 C. Tully,60
L. Uvarov,35 S. Uvarov,35 S. Uzunyan,46 R. Van Kooten,48 W.M. van Leeuwen,29 N. Varelas,45 E.W. Varnes,41
I.A. Vasilyev,34A.Y. Verkheev,31 L.S. Vertogradov,31M. Verzocchi,44 M. Vesterinen,40 D. Vilanova,15 P. Vokac,7
H.D. Wahl,43 M.H.L.S. Wang,44 J. Warchol,50 G. Watts,73 M. Wayne,50 J. Weichert,21 L. Welty-Rieger,47
M.R.J. Williams,48 G.W. Wilson,52 M. Wobisch,53 D.R. Wood,54 T.R. Wyatt,40 Y. Xie,44 R. Yamada,44
S. Yang,4 T. Yasuda,44 Y.A. Yatsunenko,31 W. Ye,63 Z. Ye,44 H. Yin,44 K. Yip,64 S.W. Youn,44 J.M. Yu,55
(The D0 Collaboration∗)
1LAFEX, Centro Brasileiro de Pesquisas F´ısicas, Rio de Janeiro, Brazil 2Universidade do Estado do Rio de Janeiro, Rio de Janeiro, Brazil
3Universidade Federal do ABC, Santo Andr´e, Brazil
4University of Science and Technology of China, Hefei, People’s Republic of China 5Universidad de los Andes, Bogot´a, Colombia
6Charles University, Faculty of Mathematics and Physics,
Center for Particle Physics, Prague, Czech Republic
7Czech Technical University in Prague, Prague, Czech Republic
8Institute of Physics, Academy of Sciences of the Czech Republic, Prague, Czech Republic 9Universidad San Francisco de Quito, Quito, Ecuador
10LPC, Universit´e Blaise Pascal, CNRS/IN2P3, Clermont, France 11LPSC, Universit´e Joseph Fourier Grenoble 1, CNRS/IN2P3,
Institut National Polytechnique de Grenoble, Grenoble, France
12CPPM, Aix-Marseille Universit´e, CNRS/IN2P3, Marseille, France 13LAL, Universit´e Paris-Sud, CNRS/IN2P3, Orsay, France 14LPNHE, Universit´es Paris VI and VII, CNRS/IN2P3, Paris, France
15CEA, Irfu, SPP, Saclay, France
16IPHC, Universit´e de Strasbourg, CNRS/IN2P3, Strasbourg, France
17IPNL, Universit´e Lyon 1, CNRS/IN2P3, Villeurbanne, France and Universit´e de Lyon, Lyon, France 18III. Physikalisches Institut A, RWTH Aachen University, Aachen, Germany
19Physikalisches Institut, Universit¨at Freiburg, Freiburg, Germany
20II. Physikalisches Institut, Georg-August-Universit¨at G¨ottingen, G¨ottingen, Germany 21Institut f¨ur Physik, Universit¨at Mainz, Mainz, Germany
22Ludwig-Maximilians-Universit¨at M¨unchen, M¨unchen, Germany 23Panjab University, Chandigarh, India
24Delhi University, Delhi, India
25Tata Institute of Fundamental Research, Mumbai, India 26University College Dublin, Dublin, Ireland
27Korea Detector Laboratory, Korea University, Seoul, Korea 28CINVESTAV, Mexico City, Mexico
29Nikhef, Science Park, Amsterdam, the Netherlands 30Radboud University Nijmegen, Nijmegen, the Netherlands
31Joint Institute for Nuclear Research, Dubna, Russia 32Institute for Theoretical and Experimental Physics, Moscow, Russia
33Moscow State University, Moscow, Russia 34Institute for High Energy Physics, Protvino, Russia 35Petersburg Nuclear Physics Institute, St. Petersburg, Russia
36Instituci´o Catalana de Recerca i Estudis Avan¸cats (ICREA) and Institut de F´ısica d’Altes Energies (IFAE), Barcelona, Spain 37Uppsala University, Uppsala, Sweden
38Lancaster University, Lancaster LA1 4YB, United Kingdom 39Imperial College London, London SW7 2AZ, United Kingdom 40The University of Manchester, Manchester M13 9PL, United Kingdom
41University of Arizona, Tucson, Arizona 85721, USA 42University of California Riverside, Riverside, California 92521, USA
43Florida State University, Tallahassee, Florida 32306, USA 44Fermi National Accelerator Laboratory, Batavia, Illinois 60510, USA
45University of Illinois at Chicago, Chicago, Illinois 60607, USA 46Northern Illinois University, DeKalb, Illinois 60115, USA
47Northwestern University, Evanston, Illinois 60208, USA 48Indiana University, Bloomington, Indiana 47405, USA 49Purdue University Calumet, Hammond, Indiana 46323, USA 50University of Notre Dame, Notre Dame, Indiana 46556, USA
51Iowa State University, Ames, Iowa 50011, USA 52University of Kansas, Lawrence, Kansas 66045, USA 53Louisiana Tech University, Ruston, Louisiana 71272, USA 54Northeastern University, Boston, Massachusetts 02115, USA
55University of Michigan, Ann Arbor, Michigan 48109, USA 56Michigan State University, East Lansing, Michigan 48824, USA
57University of Mississippi, University, Mississippi 38677, USA 58University of Nebraska, Lincoln, Nebraska 68588, USA 59Rutgers University, Piscataway, New Jersey 08855, USA 60Princeton University, Princeton, New Jersey 08544, USA
61State University of New York, Buffalo, New York 14260, USA 62University of Rochester, Rochester, New York 14627, USA 63State University of New York, Stony Brook, New York 11794, USA
64Brookhaven National Laboratory, Upton, New York 11973, USA 65Langston University, Langston, Oklahoma 73050, USA 66University of Oklahoma, Norman, Oklahoma 73019, USA 67Oklahoma State University, Stillwater, Oklahoma 74078, USA
68Brown University, Providence, Rhode Island 02912, USA 69University of Texas, Arlington, Texas 76019, USA 70Southern Methodist University, Dallas, Texas 75275, USA
71Rice University, Houston, Texas 77005, USA 72University of Virginia, Charlottesville, Virginia 22904, USA
73University of Washington, Seattle, Washington 98195, USA
(Dated: April 19, 2013)
We present a measurement of Z boson pair production in p¯p collisions at 1.96 TeV with 9.6 fb−1
to 9.8 fb−1 of D0 data. We examine the final states eeee, eeµµ, and µµµµ. Based on
se-lected data, the measured cross section in the mass region M (Z/γ∗) > 30 GeV is σ(p¯p →
Z/γ∗Z/γ∗) = 1.26+0.44 −0.36(stat)
+0.17
−0.15(syst) ± 0.08 (lumi) pb; after correcting for the expected
ra-tio of σ(p¯p → Z/γ∗Z/γ∗) to σ(p¯p → ZZ), we derive a cross section for p¯p → ZZ production of
1.05+0.37 −0.30(stat)
+0.14
−0.12(syst) ± 0.06 (lumi) pb. This result is combined with a previous result from
the ZZ → ℓ+ℓ−ν ¯ν channel resulting in a combined p¯p → ZZ cross section measurement of
1.32+0.29
−0.25(stat) ± 0.12 (syst) ± 0.04 (lumi) pb. These measurements are consistent with the
stan-dard model expectation of 1.43 ± 0.10 pb. We extend this analysis to search for the stanstan-dard model (SM) Higgs boson between 115 and 200 GeV. At a Higgs boson mass of 125 GeV, we expect to set a limit of 43 times the SM expectation at 95% C.L., and set a limit of 42 times the SM expectation at 95% C.L.
PACS numbers: 12.15.Ji,13.85.Qk,14.70.Hp,14.80.Bn
I. INTRODUCTION
We present a measurement of the cross section σ(p¯p → Z/γ∗Z/γ∗) at√s = 1.96 TeV, using events where each
Z/γ∗results in two charged leptons. Because the
branch-ing fraction of the Z boson to charged leptons is smaller than that to quarks or neutrinos, this process is relatively rare, but has the advantage of being an extremely pure final state. The largest fraction of the background results from events in which one or more jet has been misiden-tified as a lepton, since few other processes in the stan-dard model (SM) produce four isolated leptons. We also unfold our measurement to determine the σ(p¯p → ZZ) cross section.
After measuring the t-channel Z/γ∗ Z/γ∗ cross
sec-tion, we reinterpret the analysis as a search for the Higgs boson in the four lepton final state, predicted in the SM as a result of electroweak symmetry breaking. Both the ATLAS and CMS experiments at the CERN LHC pp
col-∗with visitors from aAugustana College, Sioux Falls, SD, USA, bThe University of Liverpool, Liverpool, UK,cDESY, Hamburg,
Germany, dUniversidad Michoacana de San Nicolas de Hidalgo,
Morelia, MexicoeSLAC, Menlo Park, CA, USA,fUniversity
Col-lege London, London, UK,gCentro de Investigacion en
Computa-cion - IPN, Mexico City, Mexico,hUniversidade Estadual Paulista,
S˜ao Paulo, Brazil, iKarlsruher Institut f¨ur Technologie (KIT)
-Steinbuch Centre for Computing (SCC) andjOffice of Science, U.S.
Department of Energy, Washington, D.C. 20585, USA. kVisitor
from Lewis University, Romeoville, IL, USA.
lider have observed a four lepton resonance at a mass of ∼125 GeV [1, 2] which, when combined with other decay channels, is consistent with the SM Higgs boson.
Z boson pair production was studied at the CERN LEP2 collider by the ALEPH [3], DELPHI [4], L3 [5], and OPAL [6] collaborations in multiple final states, in-cluding e+e−→ ℓ+ℓ−ℓ′+ℓ′
−, where ℓ represents an
elec-tron or a muon. The LEP experiments also set limits on anomalous ZZZ and ZZγ couplings [7].
The Fermilab Tevatron experiments have also searched for and measured the pair production of Z bosons. The D0 collaboration’s analysis of ZZ → ℓ+ℓ−ℓ′+
ℓ′−
produc-tion with 1.1 fb−1 of p¯p data yielded an upper limit of
4.4 pb on the ZZ production cross section at 95% C.L. Additionally, limits on anomalous ZZZ and ZZγ cou-plings were determined [8]. The D0 collaboration was the first to observe ZZ production in p¯p collisions in the ℓ+ℓ−ℓ′+
ℓ′− final state with 2.7 fb−1 of data [9]. The D0
collaboration has also measured the ZZ cross section in the ℓ+ℓ−ν ¯ν final state, first with 2.2 fb−1 [10] and later
with 8.6 fb−1 of integrated luminosity, yielding a final
measurement of 1.64±0.44 (stat)+0.13−0.15(syst) pb [11]. The
CDF collaboration has analyzed data from 1.9 fb−1 of
integrated luminosity to study ZZ production, measur-ing, when combining ℓ+ℓ−ℓ′+ℓ′−
and ℓ+ℓ−ν ¯ν channels,
a cross section of σ(ZZ) = 1.4+0.7−0.6 (stat + syst) pb [12]. The ATLAS collaboration has observed pp → ZZ pro-duction in the four charged lepton final state in 1.0 fb−1
of data at√s = 7 TeV [13]. The CMS collaboration has measured σ(pp → ZZ) in 5.0 fb−1of data at√s = 7 TeV
[14], and has observed the rare decay Z → ℓ+ℓ−ℓ′+ ℓ′−
with a branching fraction in agreement with the SM pre-diction.
This article is an update of the D0 collaboration’s prior ZZ to four charged lepton analysis that measured a cross section of σ(p¯p → ZZ) = 1.26+0.47−0.37(stat) ± 0.11 (syst) ±
0.08 (lumi) pb using 6.4 fb−1 of integrated luminosity
[16]. The result presented here uses 9.6 fb−1to 9.8 fb−1of
integrated luminosity, and expands electron acceptance in the eeee final state.
II. DETECTOR
The D0 detector is described in detail elsewhere [17– 20]. The main components are the central tracking system, the calorimeter system, and the muon detec-tors. The central-tracking system is located within a 2 T solenoidal field and consists of two different track-ers. Located closest to the interaction point is the silicon microstrip tracker (SMT) and surrounding that is the central fiber tracker (CFT). The SMT is an assembly of barrel silicon detectors in the central region, along with large-diameter disks in the forward regions for tracking at high pseudorapidity (η) [21]. The CFT consists of eight concentric coaxial barrels each carrying two doublet lay-ers of scintillating fiblay-ers. The liquid-argon calorimeter system is housed in three cryostats. The central ter (CC) covers up to |η| = 1, and two end calorime-ters (EC) are located in the forward regions, extending coverage to |η| = 4. In the intercryostat region (ICR) between the CC and EC cryostats, there is a scintillat-ing intercryostat detector (ICD) between 1.1 < |η| < 1.4 that recovers some energy from particles passing through the ICR. Closest to the collisions are the electromagnetic (EM) regions of the calorimeter followed by hadronic lay-ers of fine and coarse segmentation.
A muon detection system [22] is located beyond the calorimeters and consists of a layer of tracking detectors and scintillation trigger counters before 1.8 T toroid mag-nets, followed by two similar layers after the toroids.
There is a three-level trigger system consisting of a collection of specialized hardware elements, microproces-sors, and decision-making algorithms to selectively record the events of most interest.
III. MONTE CARLO
We use the pythia [23] Monte Carlo (MC) program to determine the Z/γ∗ Z/γ∗→ ℓ+ℓ−ℓ′+ℓ′− signal
accep-tance and to simulate the migration background. The signal is defined to consist of Z/γ∗Z/γ∗pairs where each
Z/γ∗ boson has a mass greater than 30 GeV. The
mi-gration background consists of Z/γ∗ Z/γ∗ events where
at least one of the two Z/γ∗ bosons has an invariant
mass of less than 30 GeV; it enters the signal sample either due to mismeasurement or by mis-assigning the
lepton pairs in the eeee and µµµµ channels. We in-clude Z/γ∗ Z/γ∗ → ℓ+ℓ−τ+τ− events where the taus
decay into electrons or muons as appropriate to match the final four-lepton signature in the signal acceptance. Contributions from ZZ → τ+τ−τ+τ− with subsequent
decays into muons and electrons are also examined, but found to be negligible. The ZZ transverse momentum (pT) spectrum is also estimated using sherpa MC [24],
and the difference between the pT spectra from pythia
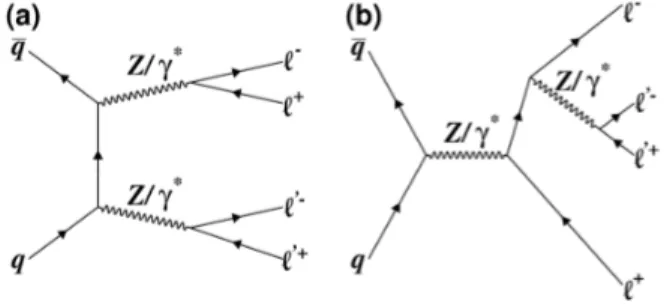
and sherpa is used as a systematic. The dominant tree-level diagrams for p¯p → Z/γ∗Z/γ∗ → ℓ+ℓ−ℓ′+ℓ′− are
shown in Fig. 1. The singly resonant Z boson diagram contributes at low mass, and we expect a negligible con-tribution to the signal yields from this diagram in our analysis.
FIG. 1: Feynman diagrams for (a) the t-channel tree-level process q ¯q → ZZ → ℓ+ℓ−ℓ′+ℓ′−and (b) the singly resonant
process.
To estimate the migration background, we generate Z/γ∗ pairs where at least one of the bosons has a mass
between 5 and 30 GeV, and estimate the cross section of these events using next-to-leading-order (NLO) MC from mcfm[25] with the CTEQ61M PDF set [26].
The t¯t background is estimated using alpgen [30] with a top quark mass of 172 GeV and is normalized to an approximate NNLO cross section calculation [31].
Other backgrounds where photons or jets must be misidentified for the event to enter our sample, such as events containing a Z plus jets, are estimated from data as described in Sec. VI.
For the Higgs boson search, we generate SM Higgs bo-son events with masses between 115 and 200 GeV in 5 GeV increments. We simulate the gluon fusion (gg → H) and ZH associated production (q ¯q → ZH) processes using pythia. The expected gg → H cross section is corrected to next-to-NLO (NNLO) with next-to-next-to-leading-log resummation of soft gluons [27]. The associ-ated ZH production cross section is corrected to NNLO [28]. The expected branching fractions for the Higgs bo-son decay are determined using hdecay [29].
All of the MC samples are passed through a geant [32] simulation of the D0 detector. To account for detector noise and additional p¯p interactions, data from random beam crossings are overlaid onto all MC events to match the instantaneous luminosity distribution of the selected
data. The same algorithms used to reconstruct real data events are run on these simulated events.
IV. OBJECT IDENTIFICATION
All muon candidates are reconstructed either as a muon track reconstructed from hits in both the wire chambers and scintillators in at least one layer of the muon system, or as a narrow energy deposit in the calorimeter system consistent with that expected from a muon passing through the calorimeter that is not asso-ciated with tracks in the muon system. Each muon can-didate must be matched to a track in the central tracker with a pT > 15 GeV, and the track pT is taken as the
pT of the muon, pµT. This track must have an impact
pa-rameter consistent with the muon coming from the inter-action point. We consider two muon isolation variables: Etrkcone
T , the scalar sum of the track pT within a cone of
∆R ≤ 0.5 [33] about the muon track; and Ehalo
T , the sum
of the calorimeter energy in an annulus 0.1 < ∆R ≤ 0.4 centered on the muon track. If the muon is reconstructed in the muon system, then we impose the requirement that Etrkcone T /p µ T < 0.25 and E halo T /p µ T < 0.4. Otherwise, each
variable divided by pµT must be less than 0.1.
Different selection requirements apply for electrons identified in the CC (|ηd| < 1.1), EC (1.5 < |ηd| < 3.2),
and ICR (1.1 < |ηd| < 1.5), where ηd is the
pseudorapid-ity calculated with respect to the center of the detector. In the CC and EC, electrons must have at least 90% of their energy found in the EM calorimeter, have pT > 15
GeV, and pass a calorimeter isolation requirement. The pT estimate for the CC and EC electrons is based on the
energy deposited in the calorimeter. For electrons in the CC, the sum of transverse momenta of the charged cen-tral tracks in an annulus of 0.05 < ∆R ≤ 0.4 about the electron, I4, must be less than 4.0 GeV. There must ei-ther be a track in the central tracker associated with the calorimeter cluster, or hits in the central tracker consis-tent with a track along the extrapolation of the calorime-ter cluscalorime-ter to the incalorime-teraction point. Finally, the electron must pass a neural net (NN) discriminant trained to sep-arate electrons from jets in the CC using seven shower shape and isolation variables as input.
In the EC only, we require that the track isolation I4 be less than (7.0−2.5×|ηd|) GeV or 0.01 GeV, whichever
is larger. The electron must pass a NN discriminant trained to separate electrons from jets in the EC using three shower shape and isolation variables as input and an additional chi-square-based shower shape requirement designed to distinguish electrons from jets.
Within the ICR, there is incomplete EM calorimeter coverage, so the electron must pass a minimum EM + ICD energy fraction requirement that varies with |ηd|.
The candidate must be matched to a central track with pT > 15 GeV and have a pT > 10 GeV measured in the
calorimeter. Additionally, the ICR electron must sat-isfy two multivariate discriminants designed to reject jet
background. Due to the limited energy resolution in the ICR, we use the pT of the track associated with the ICR
electron to estimate the ICR electron energy.
Jets are used in the estimation of the instrumental background, as discussed in Sec. VI. In this analysis, we use jets reconstructed from energy deposits in the CC, EC, and ICD detectors using the Run II midpoint cone algorithm [34] with a cone size of ∆R = 0.5. The jets must have pT > 15 GeV and |ηd| < 3.2. We apply the
standard jet energy scale (JES) corrections [35] to jets in both data and MC.
The missing transverse energy, E/T, is calculated using a vector sum of the transverse components of calorime-ter energy depositions, with appropriate JES corrections [35]. In the eeµµ and µµµµ final states, the E/T is cor-rected for identified muons.
V. EVENT SELECTION
To maximize the acceptance, we consider all events that pass the event selection requirements below without requiring a specific trigger. The majority of our accep-tance comes from events collected by single lepton and di-lepton triggers. As there are four high-pT leptons in
this final state, we estimate that the trigger efficiency for the signal is greater than 99.5% in all channels.
A. eeee final state
All electron candidates have to satisfy the requirements in Sec. IV. We require at least four electron candidates. If there are four CC/EC electron candidates, no ICR elec-tron candidates are considered, and if there are more than four CC/EC electron candidates, the highest-pT
candi-dates are used. At least two of the electrons must be in the CC, and if an event has more than one ICR electron, only the leading ICR electron is considered as a lepton candidate. All possible pairings of the selected electrons are considered with no charge requirement imposed, and we require that one of the pairings has di-electron mass Mee> 30 GeV for both di-electrons. Additionally, there
must be ∆R > 0.5 between any ICR electron and any CC and EC electrons, or the ICR electron is not considered. Because the instrumental background contamination is expected to vary significantly depending on the number of central electrons, the eeee channel is then divided into four sub-channels that depend on the number of elec-trons in the CC, NCC, the EC, NEC, and in the ICR,
NICR: NCC = 4, NCC = 2 with NEC = 2, NCC = 3
with NEC = 1, and NCC ≥ 2 with NICR = 1. Since we
do not use the muon system in eeee event reconstruction, we include events where the muon system was not fully operational. This leads to a slightly higher integrated luminosity in the eeee final state compared to the eeµµ and µµµµ final states.
B. eeµµ channel
The eeµµ channel is divided into three sub-channels that depend on the number of electrons in the CC: NCC= 2, NCC = 1, and NCC= 0. No ICR electrons are
used in this channel. As in the eeee final state, we apply this splitting because the instrumental background con-tamination varies significantly depending on the number of central electrons. We require at least two electrons and two muons; if there are more leptons in the event, only the highest-pT leptons of each type are used. To reject
cosmic ray background, the cosine of the angle between the muons must satisfy cosα < 0.96, and the acoplanarity [36] between the two muons must be greater than 0.05 radians. We further require |∆zDCA| < 3.0 cm between
the muon tracks, where zDCArefers to the location along
the beam axis where the track has its distance of closest approach to the beamline. Also, we impose the require-ment that ∆R > 0.2 between all possible electron-muon pairings. Both the muon pair and electron pair invari-ant masses must exceed 30 GeV. There is no opposite charge requirement placed on the lepton pairs in order to maximize acceptance.
C. µµµµ final state
In the four-muon final state, there must be at least four muon candidates satisfying the requirements in Sec. IV, and at least two of the muons must be matched to tracks found in the muon system. The four-muon system must be charge neutral (P4i=1qi = 0), and only oppositely
charged pairs are considered as Z boson candidates. If more than four muons are reconstructed in the event, we consider only the four highest-pT muons. We further
require |∆zDCA| < 3.0 cm between all muons. We also
require that one of the two possible sets of dimuons has a dimuon mass Mµµ > 30 GeV for both dimuons.
VI. INSTRUMENTAL BACKGROUND
The instrumental background primarily arises from Z(→ ℓℓ) + jets and Z(→ ℓℓ) + γ + jets production (with smaller contributions from W Z + jets, W W + jets, W + jets, and multijet production with ≥4 jets). These events contaminate the four-lepton channels when a jet is falsely reconstructed as an isolated lepton. Z(→ ℓℓ) + γ + jets production where a photon and a jet are mis-identified as an electron contaminates the eeee and eeµµ channels. We estimate the instrumental background using the data. We first find the probability for a jet to be mis-identified as a lepton, Pjℓ. A tag and probe method is
used to determine Pjℓ where di-jet activity is considered
with jet pT > 15 GeV. The tagged jet must be associated
with a jet that fired a single jet trigger and be the highest-pT jet in the event. We then look for a probe jet with
|∆φ| > 3.0 with respect to the tag jet, where φ is the
azimuthal angle. To suppress contamination from W +jet events, we require E/T < 20 GeV in the tag and probe sample. The probe jets form the denominator of the Pjℓ
calculation.
To calculate the numerator of the Pje estimate, we
first find all good electrons in the event with a pT > 15
GeV. We then select those electrons that satisfy the same criteria imposed on the probe jets, noted above. The Pje
estimate is parametrized as a function of the jet pT and
ηd.
The Pjµ estimate is determined using a similar
method. The tagged jet is defined as was done for elec-tron events, but in the numerator, rather than have an electron, we use any muon that has |∆φ| > 3.0 from the tag jet, and Pjµ is taken as the number of muons
di-vided by the number of probe jets in the sample. The Pjµ estimate is parameterized in terms of pT and η.
The Pjℓ estimates for both electrons and muons are on
the order of 10−3.
To estimate the instrumental background for the eeee final state, Pje is applied to events with three
recon-structed electrons and one or more jet. The jet kinemat-ics are used to model the electron kinematkinemat-ics in the event. This method accounts for events where either a photon or a jet is misreconstructed as one electron and a jet is misreconstructed as the other. This method overesti-mates the background from events with two real electrons and two jets misreconstructed as electrons. To determine the rate, we look at events with two reconstructed elec-trons and two or more reconstructed jets and apply Pje
to both jets. The number of ee plus two jet events after Pje is applied to both jets is found to be negligible, so
only eee+jet events are used to model the instrumental background distributions in the eeee final state.
The instrumental background in the eeµµ channel is calculated from two different contributions. The first contribution is from events with eµµ plus one or more jet, where we apply Pje to the jet. This method gives
an estimate of a background due to Z(→ µµ) + jets and Z(→ µµ) + γ + jets where a jet has been reconstructed as an electron. We also consider the ee plus two jet or more case, where we apply Pjµto the jets. This method
gives an estimate of the background due to Z(→ ee) + jets where the jets can contain muons.
The Pjµ is applied to jets in µµ plus two or more jets
data to determine the instrumental background for the µµµµ channel.
Background estimates derived from the above method can be found in Tables I–III in each final state.
VII. SYSTEMATIC UNCERTAINTIES
The following factors contribute to the systematic un-certainty on this measurement. We assess a 1% trigger efficiency uncertainty. Lepton identification uncertain-ties are calculated by studying Z → ℓℓ events; lepton identification uncertainties of 3.7% per CC and EC
elec-TABLE I: Contributions from non-negligible backgrounds in the eeee subchannels, plus expected t-channel ZZ and Higgs boson signals and number of observed events. Uncertainties are statistical followed by systematic.
2 CC 3 CC 4 CC ≥2 CC 2 EC 1 EC 1 ICR Instrumental backg. 0.15 ± 0.01 ± 0.03 0.12 ± 0.01 ± 0.02 0.05 ± 0.01 ± 0.01 0.29 ± 0.04+0.03 −0.12 Migration 0.014 ± 0.001 ± 0.002 0.023 ± 0.001 ± 0.004 0.025 ± 0.001 ± 0.004 0.024 ± 0.001 ± 0.003 Total non-ZZ 0.17 ± 0.01 ± 0.03 0.14 ± 0.01 ± 0.02 0.08 ± 0.01 ± 0.01 0.32 ± 0.04+0.03−0.12 background Expected 0.48 ± 0.01 ± 0.07 1.14 ± 0.01 ± 0.17 1.03 ± 0.01 ± 0.15 1.47 ± 0.01 ± 0.19 t-channel Z/γ∗ Z/γ∗ Expected gg → H < 0.001 0.001 0.004 0.002 MH= 125 GeV Expected ZH 0.003 0.006 0.010 0.008 MH= 125 GeV
Total Higgs boson 0.003 0.007 0.014 0.010
MH= 125 GeV
Observed 0 1 2 2
Events
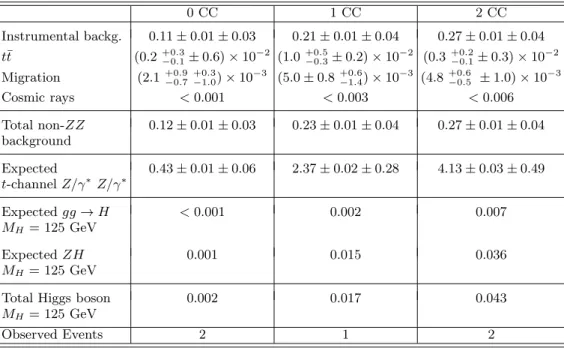
TABLE II: Contributions from non-negligible backgrounds in the eeµµ subchannels, plus expected signal and number of observed events. Uncertainties are statistical followed by systematic.
0 CC 1 CC 2 CC Instrumental backg. 0.11 ± 0.01 ± 0.03 0.21 ± 0.01 ± 0.04 0.27 ± 0.01 ± 0.04 t¯t (0.2+0.3 −0.1±0.6) × 10 −2 (1.0+0.5 −0.3±0.2) × 10 −2 (0.3+0.2 −0.1±0.3) × 10 −2 Migration (2.1+0.9 −0.7 +0.3 −1.0) × 10 −3 (5.0 ± 0.8+0.6 −1.4) × 10 −3 (4.8+0.6 −0.5 ±1.0) × 10 −3 Cosmic rays < 0.001 < 0.003 < 0.006 Total non-ZZ 0.12 ± 0.01 ± 0.03 0.23 ± 0.01 ± 0.04 0.27 ± 0.01 ± 0.04 background Expected 0.43 ± 0.01 ± 0.06 2.37 ± 0.02 ± 0.28 4.13 ± 0.03 ± 0.49 t-channel Z/γ∗Z/γ∗ Expected gg → H < 0.001 0.002 0.007 MH= 125 GeV Expected ZH 0.001 0.015 0.036 MH= 125 GeV
Total Higgs boson 0.002 0.017 0.043
MH= 125 GeV
Observed Events 2 1 2
tron, 6% per ICR electron, and 3.2% per muon are used. There is a 10%–50% systematic uncertainty on the in-strumental background expectation in the various final states that is due to observed variations in Pjℓ when
changing selection requirements for the di-jet sample as well as limited statistics in the data samples used. We assign 20% uncertainty to the t¯t background. This cov-ers uncertainty on the theoretical production rate of 7% for mtop= 172 GeV [31], plus variation in the cross
sec-tion due to uncertainty on the top quark mass, and also
that on the rate at which the b quark from top quark decays is misidentified as an isolated lepton. We esti-mate a PDF uncertainty of 2.5% on all MC samples. We assign a 7.1% uncertainty on the ZZ cross section used to estimate the migration background and the ZZ back-ground to the Higgs boson search. A systematic uncer-tainty of 6.1% is assessed on the luminosity measurement [37]. We assess a systematic uncertainty on the ZZ pT
distribution by reweighting the pythia ZZ pT to match
pT systematic is between 1% and 7% for signal t-channel
ZZ events, but has up to a 40% effect on the migration background. We also assess systematic uncertainties on the muon and electron energy resolution [38], which lead to an uncertainty on the cross section measurements and Higgs boson production limits of less than 2%. For the Higgs boson search, we assess a theoretical uncertainty on the expected gluon fusion and ZH associated cross sections of 10.9% and 6.2%, respectively [27, 28].
TABLE III: Contributions from non-negligible backgrounds in the µµµµ channel, plus expected t-channel ZZ and Higgs boson signal and number of observed events. Uncertainties are statistical followed by systematic.
Number of Events Instrumental backg. 0.12 ± 0.01+0.07 −0.05 Migration (0.34 ± 0.02+0.07 −0.04) × 10 −1 Cosmic rays <0.01 Total non-ZZ 0.15 ± 0.01+0.07 −0.05 background Expected 4.26 ± 0.02 ± 0.43 t-channel Z/γ∗ Z/γ∗ Expected gg → H 0.007 MH= 125 GeV Expected ZH 0.033 MH= 125 GeV
Total Higgs boson 0.040
MH= 125 GeV
Observed Events 3
VIII. CROSS SECTION MEASUREMENT
The data are used to measure the production cross sec-tion p¯p → ZZ at √s = 1.96 TeV. The integrated lumi-nosities analyzed for the three channels are 9.8, 9.6, and 9.6 fb−1 for the eeee, eeµµ, and µµµµ channels,
respec-tively. A summary of the signal and background event expectations are included in Tables I–III for the three channels.
We observe five eeee candidate events, five eeµµ candi-date events, and three µµµµ candicandi-date events, for 13 data events total, with a total of 16.8 ± 1.9 (stat+syst+lumi) expected events.
A negative log-likelihood function is constructed by taking as input the expected signal acceptance, the num-ber of expected background events, and the numnum-ber of observed events in each of the subchannels. The signal acceptance times efficiency for each channel are shown in Tables IV–VI. The branching ratio for each chan-nel is calculated using the relevant Z boson branch-ing ratios from Ref. [39]. The cross section, σ, is varied to minimize the negative log-likelihood, which gives σ(p¯p → Z/γ∗Z/γ∗) = 1.26+0.44
−0.36(stat) +0.17
−0.15(syst) ±
0.08 (lumi) pb for M (Z/γ∗) > 30 GeV. We then
calcu-late the ratio of σ(p¯p → Z/γ∗Z/γ∗) to σ(p¯p → ZZ)
for this mass region using mcfm [25], and from this correction determine the p¯p → ZZ cross section to be 1.05+0.37−0.30(stat)+0.14−0.12(syst) ± 0.06 (lumi) pb. We combine this measurement with the p¯p → ZZ cross section mea-sured in the ℓ+ℓ−ν ¯ν final state using data from the D0
detector [11], giving a total combined p¯p → ZZ cross sec-tion of 1.32+0.29−0.25(stat) ± 0.12 (syst) ± 0.04 (lumi) pb. The measured cross section values are consistent with the SM expectation of 1.43 ± 0.10 pb [25].
IX. HIGGS BOSON PRODUCTION LIMITS
The main Higgs boson production mechanisms that can result in four final state charged leptons are gluon fusion and ZH associated production.
For Higgs boson events produced through gluon fu-sion, final states with four charged leptons arise from the decay H → ZZ, where both Z bosons then decay lepton-ically. As all of the decay products of the Higgs boson in this decay are well measured, the best discriminating variable between the gluon fusion Higgs boson signal and the backgrounds is the four-lepton invariant mass.
In the case of associated ZH production, two of the leptons in each event can come from the decay of the associated Z boson, so Higgs decay modes with two or more final state leptons will contribute to our signal. The majority of the ZH signal arises from H → τ+τ−
, H → W W , and H → ZZ decays. We expect large E/T in these
events, due to the neutrinos from the τ and W boson decays, as well as in events where one Z boson from the H → ZZ decays to neutrinos.
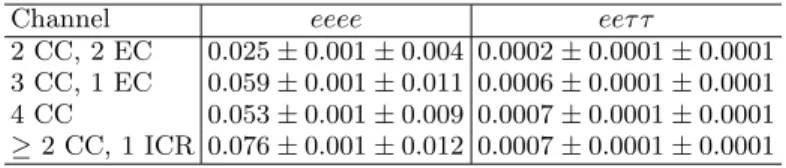
TABLE IV: Acceptance × efficiency for the eeee subchannels, for ZZ → eeee and ZZ → eeτ τ decays. Uncertainties are statistical followed by systematic.
Channel eeee eeτ τ
2 CC, 2 EC 0.025 ± 0.001 ± 0.004 0.0002 ± 0.0001 ± 0.0001 3 CC, 1 EC 0.059 ± 0.001 ± 0.011 0.0006 ± 0.0001 ± 0.0001 4 CC 0.053 ± 0.001 ± 0.009 0.0007 ± 0.0001 ± 0.0001 ≥2 CC, 1 ICR 0.076 ± 0.001 ± 0.012 0.0007 ± 0.0001 ± 0.0001
TABLE V: Acceptance × efficiency for the eeµµ subchannels, for ZZ → eeµµ, ZZ → eeτ τ , and ZZ → µµτ τ decays. Uncertainties are statistical followed by systematic.
Channel eeµµ eeτ τ µµτ τ
0 CC 0.011 ± 0.001 ± 0.001 0.0001 ± 0.0001 ± 0.0001 0.0002 ± 0.0001 ± 0.0001 1 CC 0.063 ± 0.001 ± 0.007 0.0007 ± 0.0001 ± 0.0001 0.0007 ± 0.0001 ± 0.0001 2 CC 0.110 ± 0.001 ± 0.012 0.0014 ± 0.0001 ± 0.0002 0.0019 ± 0.0001 ± 0.0002
TABLE VI: Acceptance × efficiency for the µµµµ channel, for ZZ → µµµµ and ZZ → µµτ τ decays. Uncertainties are statistical followed by systematic.
µµµµ µµτ τ
0.224 ± 0.002 ± 0.022 0.0032 ± 0.0002 ± 0.0003
using the four-lepton invariant mass and the E/T. The four-lepton mass and E/T are shown in Fig. 2, with the ex-pected Higgs boson signal distributions for a Higgs boson mass, MH, of 125 GeV. Additional differential
distribu-tions are provided in Appendix A. The expected yields for each production and decay mode for each Higgs bo-son mass considered are shown in Table VII. For events with E/T < 30 GeV, the four-lepton mass is used to dis-criminate the Higgs boson signal from all backgrounds; in events with E/T ≥ 30 GeV, the E/T is used. For the Higgs boson search, the t-channel Z/γ∗Z/γ∗background
is fixed to the SM expectation.
We find no evidence of SM Higgs boson production and proceed to set limits. We consider potential MH
values between 115 and 200 GeV, in 5 GeV increments. We calculate limits on the SM Higgs boson production cross section using a modified frequentist approach [40– 42]. A log-likelihood ratio (LLR) test statistic is formed using the Poisson probabilities for estimated background yields, the expected signal acceptance, and the number of observed events for each considered Higgs boson mass hy-pothesis. The confidence levels are derived by integrating the LLR distribution in pseudo-experiments using both the signal-plus-background hypothesis (CLs+b) and the
background-only hypothesis (CLb). The excluded
pro-duction cross section is taken to be the cross section for which the confidence level for signal, CLs= CLs+b/CLb,
is less than or equal to 0.05.
The calculated limits are listed in Table VIII. At MH = 125 GeV, we expect to set a limit of 42.8 times
the SM cross section at the 95% C.L., and observe a limit
of 42.3 times the SM cross section. The limits vs. MH
are shown in Fig. 3, along with the associated LLR dis-tribution.
X. CONCLUSIONS
We have measured the production cross section for p¯p → Z/γ∗ Z/γ∗ with M (Z/γ∗) > 30 GeV to
be 1.26+0.44−0.36(stat)+0.17−0.15(syst) ± 0.08 (lumi) pb. We correct this measurement by the expected ratio of σ(p¯p → Z/γ∗Z/γ∗) to σ(p¯p → ZZ) for this mass
region and obtain a p¯p → ZZ cross section of 1.05+0.37−0.30(stat)+0.14−0.12(syst) ± 0.06 (lumi) pb. We also searched for the Higgs boson in the four lepton final state, assuming that the t-channel ZZ pair is produced with the cross section predicted by the SM. At MH = 125 GeV,
we expect a limit of 42.8 times the SM cross section, and set a limit of 42.3 times the SM cross section at the 95% C.L.
We thank the staffs at Fermilab and collaborating in-stitutions, and acknowledge support from the DOE and NSF (USA); CEA and CNRS/IN2P3 (France); MON, NRC KI and RFBR (Russia); CNPq, FAPERJ, FAPESP and FUNDUNESP (Brazil); DAE and DST (India); Col-ciencias (Colombia); CONACyT (Mexico); NRF (Ko-rea); FOM (The Netherlands); STFC and the Royal So-ciety (United Kingdom); MSMT and GACR (Czech Re-public); BMBF and DFG (Germany); SFI (Ireland); The Swedish Research Council (Sweden); and CAS and CNSF (China).
[1] G. Aad et al. (ATLAS Collaboration), Phys. Lett. B 716, 1 (2012).
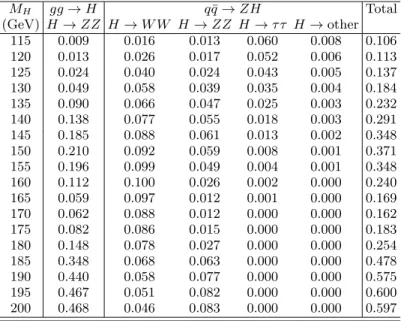
TABLE VII: Expected numbers of Higgs boson events for each mass point for the given production and decay mode. The H → γγ, H → µµ, and H → Zγ contributions are summed together in the H → other decays column.
MH gg → H q ¯q → ZH Total (GeV) H → ZZ H → W W H → ZZ H → τ τ H → other 115 0.009 0.016 0.013 0.060 0.008 0.106 120 0.013 0.026 0.017 0.052 0.006 0.113 125 0.024 0.040 0.024 0.043 0.005 0.137 130 0.049 0.058 0.039 0.035 0.004 0.184 135 0.090 0.066 0.047 0.025 0.003 0.232 140 0.138 0.077 0.055 0.018 0.003 0.291 145 0.185 0.088 0.061 0.013 0.002 0.348 150 0.210 0.092 0.059 0.008 0.001 0.371 155 0.196 0.099 0.049 0.004 0.001 0.348 160 0.112 0.100 0.026 0.002 0.000 0.240 165 0.059 0.097 0.012 0.001 0.000 0.169 170 0.062 0.088 0.012 0.000 0.000 0.162 175 0.082 0.086 0.015 0.000 0.000 0.183 180 0.148 0.078 0.027 0.000 0.000 0.254 185 0.348 0.068 0.063 0.000 0.000 0.478 190 0.440 0.058 0.077 0.000 0.000 0.575 195 0.467 0.051 0.082 0.000 0.000 0.600 200 0.468 0.046 0.083 0.000 0.000 0.597 716, 30 (2012).
[3] R. Barate et al. (ALEPH Collaboration), Phys. Lett. B 469, 287 (1999).
[4] J. Abdallah et al. (DELPHI Collaboration), Eur. Phys. J. C 30, 447 (2003).
[5] M. Acciarri et al. (L3 Collaboration), Phys. Lett. B 465, 363 (1999).
[6] G. Abbiendi et al. (OPAL Collaboration), Eur. Phys. J. C 32, 303 (2003).
[7] J. Alcaraz et al. (ALEPH and DELPHI and L3 and OPAL and LEP Electroweak Working Group Collabo-rations), hep-ex/0612034 (2006).
TABLE VIII: Expected and observed 95% C.L. upper limits on the SM Higgs boson production cross section relative to the value expected in the SM.
MH (GeV) Expected Observed
115 57.3 78.9 120 54.9 60.6 125 42.8 42.3 130 30.6 33.5 135 21.5 21.0 140 16.2 18.2 145 13.4 13.9 150 12.4 12.1 155 13.4 14.2 160 20.8 20.6 165 29.6 28.3 170 32.3 39.0 175 30.4 28.4 180 22.9 19.6 185 13.3 9.7 190 11.8 8.6 195 11.8 9.5 200 12.4 9.9
[8] V. M. Abazov et al. (D0 Collaboration), Phys. Rev. Lett. 100, 131801 (2008).
[9] V. M. Abazov et al. (D0 Collaboration), Phys. Rev. Lett. 100, 171803, (2008).
[10] V. M. Abazov et al. (D0 Collaboration), Phys. Rev. D 78, 072002 (2008).
[11] V. M. Abazov et al. (D0 Collaboration), Phys. Rev. D 85, 112005 (2012).
[12] T. Aaltonen et al. (CDF Collaboration), Phys. Rev. Lett. 100, 201801 (2008).
[13] G. Aad et al. (ATLAS Collaboration), Phys. Rev. Lett. 108, 041804 (2012).
[14] S. Chatrchyan et al. (CMS Collaboration), J. High En-ergy Phys. 01, 063 (2013).
[15] S. Chatrchyan et al. (CMS Collaboration), J. High En-ergy Phys. 12, 034 (2012).
[16] V. M. Abazov et al. (D0 Collaboration), Phys. Rev. D, 84, 011103 (2011).
[17] V. M. Abazov et al. (D0 Collaboration), Nucl. In-strum. Methods Phys. Res. A 565, 463 (2006).
[18] R. Angstadt et al., Nucl. Instrum. Methods Phys. Res. A 622, 298 (2010).
[19] S. N. Ahmed et al., Nucl. Instrum. Methods Phys. Res. A 643, 8 (2011).
[20] M. Abolins et al., Nucl. Instrum. Methods Phys. Res. A 584, 75 (2008).
[21] The pseudorapidity is given by η = − ln[tan(θ/2)], where θ is the polar angle with respect to the proton beam direction. We define η with respect to the pp interaction vertex and ηdwith respect to the nominal center of the
detector.
[22] V. M. Abazov et al., Nucl. Instrum. Methods Phys. Res. A 552, 372 (2005).
[23] T. Sj¨ostrand, S. Mrenna, and P. Skands, J. High Energy Phys. 05, 026 (2006); we use version 6.323.
[24] T. Gleisberg et al., J. High Energy Phys. 0402, 56 (2004); T. Gleisberg et al., J. High Energy Phys. 0902, 7 (2009); we use version 1.0.11.
Four-Lepton Invariant Mass (GeV) 0 50 100 150 200 250 300 350 400 450 500
Events per 20 GeV
0 1 2 3 4 5 Data ZZ Instrumental Migration 40 × Higgs Signal =125 GeV H M ZZ → H → gg ZH -1 9.8 fb ≤ D0, L (a) (GeV) T E 0 20 40 60 80 100 120 140
Events per 30 GeV
0 2 4 6 8 10 12 14 16 Data ZZ Instrumental Migration 40 × Higgs Signal =125 GeV H M ZZ → H → gg ZH -1 9.8 fb ≤ D0, L (b)
FIG. 2: Distributions of (a) the four lepton invariant mass and (b) the E/T in data, and of expected signal and background. The Higgs boson signal for MH of 125 GeV is shown scaled
by a factor of 40.
[25] J. M. Campbell and R. K. Ellis, Phys. Rev. D 60, 113006 (1999); we use version 6.2.
[26] J. Pumplin et al., J. High Energy Phys. 0207, 012 (2002). [27] D. de Florian and M. Grazzini, Phys. Lett. B 674, 291
(2009).
[28] J. Baglio and A. Djouadi, J. High Energy Phys. 10, 064 (2010); we use version 3.53.
[29] A. Djouadi, J. Kalinowski, and M. Spira, Com-put. Phys. Commun. 108, 56 (1998).
[30] M. L. Mangano et al., J. High Energy Phys. 07, 1 (2003); we use version 2.11.
[31] S. Moch and P. Uwer, Phys. Rev. D 78, 034003 (2008). [32] R. Brun and F. Carminati, CERN Program Library Long
Writeup W5013 (1993).
[33] The variable ∆R between two objects i and j is defined as ∆R = p(ηi−ηj)2+ (φi−φj)2, where φ is the
az-imuthal angle.
[34] G. Blazey et al., in Proceedings of Physics at Run II: QCD and Weak Boson Physics Workshop: Final General Meeting, eds. U. Bauer, R. Ellis, D. Zeppenfeld (Fermi-lab, Batavia, USA, 2000), p. 47, arXiv: hep-ex/0005012. [35] V. M. Abazov et al. (D0 Collaboration), Phys. Rev. D
85, 052006 (2012).
[36] The acoplanarity is given by φ1−φ2−π, where φ is the
azimuthal angle.
[37] T. Andeen et al., FERMILAB-TM-2365 (2007). [38] O. Brandt et al., FERMILAB-TM-2540-PPD (2012). [39] J. Beringer et al. (Particle Data Group), Phys. Rev. D
86, 010001 (2012).
[40] T. Junk, Nucl. Instrum. Methods Phys. Res. A 434, 435 (1999).
[41] A. Read, J. Phys. G 28, 2693 (2002). [42] W. Fisher, FERMILAB-TM-2386-E (2006). [43] Q. Cao et al., Phys. Rev. D 81, 015010 (2010).
Appendix A: Differential Distributions
Figs. 4–9 show differential distributions of the events used in the t-channel ZZ cross section measurement and Higgs boson search. Some of these distributions are
kine-[GeV] H M 120 140 160 180 200 9 5 % C L L im it /S M 1 10 2 10 3 10 (a) -1 9.8 fb ≤ D0, L Obs. Limit Exp. Limit 1 s.d. ± Exp. 2 s.d. ± Exp. Standard Model = 1.0 [GeV] H M 120 140 160 180 200 LLR -1 0 1 2 3 2 s.d. ± B LLR 1 s.d. ± B LLR B LLR S+B LLR OBS LLR (b) -1 9.8 fb ≤ D0, L
FIG. 3: The (a) expected and observed 95% C.L. upper limits on the SM Higgs boson production cross section relative to the value expected in the SM, and the (b) log-likelihood ratio for all four lepton channels combined.
matic properties of dilepton systems; in the eeµµ final state, the pairings of ee and µµ are always used. In the eeee and µµµµ final states, there may be multiple combinations passing our selection requirements. If there are multiple passing combinations, we use the combina-tion that yields a dilepton pair with an invariant mass closest to the nominal Z boson mass of 91.2 GeV [39]. Fig. 4 shows the dilepton invariant mass and the pT of
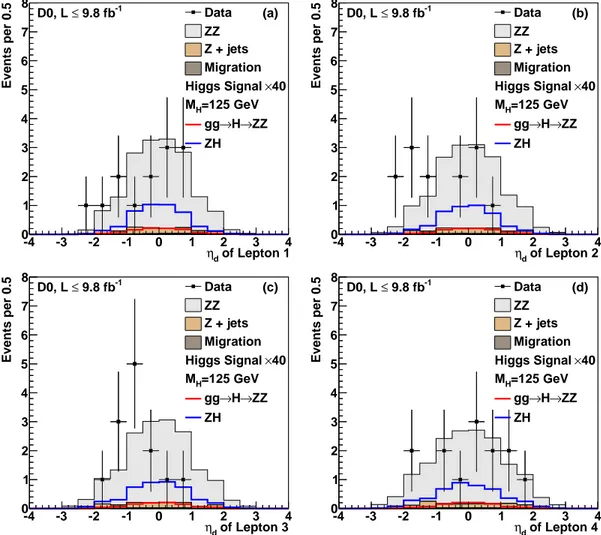
the four-lepton system. The pT and ηd distributions for
each lepton in our events are shown in Fig. 5 and 6,
re-spectively. The Z/γ∗ p
T distributions for the highest-pT
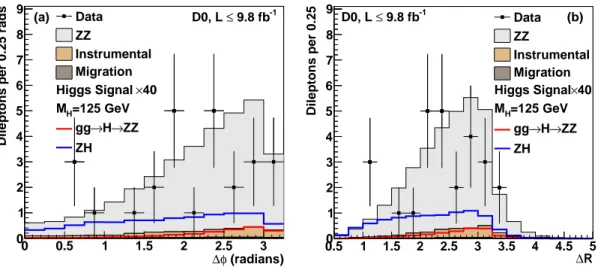
(leading) and second lepton pair are in Fig. 7. Fig. 8 shows the distributions of the opening angles between the best matched lepton pairs in each event in the azimuthal angle, ∆φ, and ∆R. Fig. 9 shows the angle φdecay, which
is the angle through which the lepton side of one of the Z/γ∗ boson decay planes is rotated into the lepton side
of the other Z/γ∗ boson decay plane, and measured in
Dilepton invariant mass (GeV) 0 20 40 60 80 100 120 140 160 180 200
Dileptons per 10 GeV
0 2 4 6 8 10 12 Data ZZ Z + jets Migration 40 × Higgs Signal =125 GeV H M ZZ → H → gg ZH -1 9.8 fb ≤ D0, L (a) (GeV) T * p γ * Z/ γ Z/ 0 20 40 60 80 100 120 140 160
Events per 10 GeV
0 1 2 3 4 5 6 7 8 Data ZZ Instrumental Migration 40 × Higgs Signal =125 GeV H M ZZ → H → gg ZH -1 9.8 fb ≤ D0, L (b)
FIG. 4: Distributions of (a) the dilepton invariant mass and (b) the transverse momentum of the four-lepton system in data, expected signal and background. There are two entries per event in the dilepton invariant mass distribution. The Higgs boson signal for MH of 125 GeV is shown scaled by a factor of 40.
of Lepton 1 (GeV)
T
p
0 20 40 60 80 100 120 140 160 180 200
Events per 10 GeV
0 1 2 3 4 5 6 7 8 9 Data ZZ Z + jets Migration 40 × Higgs Signal =125 GeV H M ZZ → H → gg ZH -1 9.8 fb ≤ D0, L (a) of Lepton 2 (GeV) T p 0 20 40 60 80 100 120 140 160 180 200
Events per 10 GeV
0 1 2 3 4 5 6 7 8 9 Data ZZ Z + jets Migration 40 × Higgs Signal =125 GeV H M ZZ → H → gg ZH -1 9.8 fb ≤ D0, L (b) of Lepton 3 (GeV) T p 0 20 40 60 80 100 120 140 160 180 200
Events per 10 GeV
0 1 2 3 4 5 6 7 8 9 Data ZZ Z + jets Migration 40 × Higgs Signal =125 GeV H M ZZ → H → gg ZH -1 9.8 fb ≤ D0, L (c) of Lepton 4 (GeV) T p 0 20 40 60 80 100 120 140 160 180 200
Events per 10 GeV
0 1 2 3 4 5 6 7 8 9 Data ZZ Z + jets Migration 40 × Higgs Signal =125 GeV H M ZZ → H → gg ZH -1 9.8 fb ≤ D0, L (d)
FIG. 5: Distributions of the transverse momentum in data, expected signal, and backgrounds for the (a) highest-pT, (b)
second-highest-pT, (c) third-highest-pT, and (d) lowest-pT leptons in each event. The Higgs boson signal for MH of 125 GeV is shown
of Lepton 1 d η -4 -3 -2 -1 0 1 2 3 4 Events per 0.5 0 1 2 3 4 5 6 7 8 Data ZZ Z + jets Migration 40 × Higgs Signal =125 GeV H M ZZ → H → gg ZH -1 9.8 fb ≤ D0, L (a) of Lepton 2 d η -4 -3 -2 -1 0 1 2 3 4 Events per 0.5 0 1 2 3 4 5 6 7 8 Data ZZ Z + jets Migration 40 × Higgs Signal =125 GeV H M ZZ → H → gg ZH -1 9.8 fb ≤ D0, L (b) of Lepton 3 d η -4 -3 -2 -1 0 1 2 3 4 Events per 0.5 0 1 2 3 4 5 6 7 8 Data ZZ Z + jets Migration 40 × Higgs Signal =125 GeV H M ZZ → H → gg ZH -1 9.8 fb ≤ D0, L (c) of Lepton 4 d η -4 -3 -2 -1 0 1 2 3 4 Events per 0.5 0 1 2 3 4 5 6 7 8 Data ZZ Z + jets Migration 40 × Higgs Signal =125 GeV H M ZZ → H → gg ZH -1 9.8 fb ≤ D0, L (d)
FIG. 6: Distributions of ηdin data, expected signal, and backgrounds for the (a) highest-pT, (b) second-highest-pT, (c)
third-highest-pT, and (d) lowest-pT leptons in each event. The Higgs boson signal for MH of 125 GeV is shown scaled by a factor of
40. (GeV) T * p γ Leading Z/ 0 50 100 150 200 250
Events per 20 GeV
0 1 2 3 4 5 6 7 8 Data ZZ Instrumental Migration 40 × Higgs Signal =125 GeV H M ZZ → H → gg ZH -1 9.8 fb ≤ D0, L (a) (GeV) T * p γ Second Z/ 0 50 100 150 200 250
Events per 20 GeV
0 1 2 3 4 5 6 7 8 Data ZZ Instrumental Migration 40 × Higgs Signal =125 GeV H M ZZ → H → gg ZH -1 9.8 fb ≤ D0, L (b)
FIG. 7: Distributions of the Z/γ∗p
T for the (a) leading and (b) second highest-pT lepton pairings in each event. In the eeee
and µµµµ channels, the combination shown is that with one dilepton mass most consistent with a Z mass of 91.2 GeV. The Higgs boson signal for MH of 125 GeV is shown scaled by a factor of 40.
(radians)
φ ∆
0 0.5 1 1.5 2 2.5 3
Dileptons per 0.25 rads
0 1 2 3 4 5 6 7 8 9 Data ZZ Instrumental Migration 40 × Higgs Signal =125 GeV H M ZZ → H → gg ZH -1 9.8 fb ≤ D0, L (a) R ∆ 0.5 1 1.5 2 2.5 3 3.5 4 4.5 5 Dileptons per 0.25 0 1 2 3 4 5 6 7 8 9 Data ZZ Instrumental Migration 40 × Higgs Signal =125 GeV H M ZZ → H → gg ZH -1 9.8 fb ≤ D0, L (b)
FIG. 8: Distributions of (a) the opening azimuthal angle, ∆φ, and (b) the ∆R, between the two leptons of a Z/γ∗. In the eeee
and µµµµ channels, the combination shown is that with one dilepton mass most consistent with a Z mass of 91.2 GeV. There are two entries per event in both distributions. The Higgs boson signal for MH of 125 GeV is shown scaled by a factor of 40.
(a) (radians) decay φ 0 1 2 3 4 5 6 /4 rads π Events per 0 1 2 3 4 5 6 7 8 Data ZZ Instrumental Migration 40 × Higgs Signal =125 GeV H M ZZ → H → gg ZH -1 9.8 fb ≤ D0, L (b)
FIG. 9: Shown in (a) is definition of φdecay, adapted from Ref. [43] with permission. Shown in (b) is the distribution of the
azimuthal φdecayangle. In the eeee and µµµµ channels, φdecayis calculated between the combination is most consistent with a