Photon reconstruction in the ATLAS Inner Detector and Liquid Argon Barrel Calorimeter at
the 2004 Combined Test Beam
This article has been downloaded from IOPscience. Please scroll down to see the full text article. 2011 JINST 6 P04001
(http://iopscience.iop.org/1748-0221/6/04/P04001)
Download details:
IP Address: 137.138.124.233
The article was downloaded on 27/07/2012 at 08:36
Please note that terms and conditions apply.
View the table of contents for this issue, or go to the journal homepage for more Home Search Collections Journals About Contact us My IOPscience
2011 JINST 6 P04001
PUBLISHED BYIOP PUBLISHING FORSISSARECEIVED: December 19, 2010 REVISED: February 15, 2011 ACCEPTED: March 13, 2011 PUBLISHED: April 1, 2011
Photon reconstruction in the ATLAS Inner Detector
and Liquid Argon Barrel Calorimeter at the 2004
Combined Test Beam
E. Abat,k,1J.M. Abdallah,f T.N. Addy,agP. Adragna,ccM. Aharrouche,ba
A. Ahmad,cm,2 T.P.A. Akesson,ayM. Aleksa,sC. Alexa,nK. Anderson,t
A. Andreazza,be,b f F. Anghinolfi,sA. Antonaki,eG. Arabidze,eE. Arik,k T. Atkinson,bd
J. Baines,c f O.K. Baker,dd D. Banfi,be,b f S. Baron,sA.J. Barr,bsR. Beccherle,a j H.P. Beck,i B. Belhorma,awP.J. Bell,bb,3 D. Benchekroun,qD.P. Benjamin,ac
K. Benslama,cg E. Bergeaas Kuutmann,cp,4 J. Bernabeu,czH. Bertelsen,v S. Binet,bq
C. Biscarat,ad V. Boldea,nV.G. Bondarenko,bk M. Boonekamp,c j M. Bosman,f
C. Bourdarios,bqZ. Broklova,ca D. Burckhart Chromek,sV. Bychkov,anJ. Callahan,ai
D. Calvet,u M. Canneri,bw M. Cape ´ans Garrido,sM. Caprini,n L. Cardiel Sas,s T. Carli,sL. Carminati,be,b f J. Carvalho,p,by M. Cascella,bwM.V. Castillo,cz
A. Catinaccio,sD. Cauz,ak D. Cavalli,be M. Cavalli Sforza,f V. Cavasinni,bw
S.A. Cetin,k H. Chen,j R. Cherkaoui,cd L. Chevalier,c jF. Chevallier,awS. Chouridou,cx M. Ciobotaru,cvM. Citterio,be A. Clark,ae B. Cleland,bxM. Cobal,akE. Cogneras,i
P. Conde Muino,byM. Consonni,be,b f S. Constantinescu,n T. Cornelissen,s,5
S. Correard,wA. Corso Radu,sG. Costa,beM.J. Costa,czD. Costanzo,cl S. Cuneo,a j
P. Cwetanski,ai D. Da Silva,ch M. Dam,vM. Dameri,a jH.O. Danielsson,s
D. Dannheim,s G. Darbo,a jT. Davidek,caK. De,d P.O. Defay,uB. Dekhissi,axJ. Del Peso,azT. Del Prete,bwM. Delmastro,sF. Derue,avL. Di Ciaccio,arB. Di Girolamo,s
S. Dita,nF. Dittus,s F. Djama,wT. Djobava,csD. Dobos,aa,6M. Dobson,s
B.A. Dolgoshein,bkA. Dotti,bw G. Drake,bZ. Drasal,ca N. Dressnandt,buC. Driouchi,v J. Drohan,cwW.L. Ebenstein,acP. Eerola,ay,7 I. Efthymiopoulos,sK. Egorov,ai
1Deceased.
2Now at SUNY, Stony Brook U.S.A.
3Now at Universit´e de Gen`eve, Geneva Switzerland. 4Now at DESY, Zeuthen Germany.
5Now at INFN Genova and Universit`a di Genova, Genova Italy. 6Now at CERN, Geneva Switzerland.
7Now at University of Helsinki, Helsinki Finland.
c
2011 CERN for the benefit of the ATLAS collaboration, published under license by IOP Publishing Ltd and
SISSA. Content may be used under the terms of the Creative Commons Attribution-Non-Commercial-ShareAlike 3.0 license. Any further distribution of this work must maintain attribution to the author(s) and the published article’s title, journal citation and DOI.
2011 JINST 6 P04001
T.F. Eifert,sK. Einsweiler,hM. El Kacimi,asM. Elsing,sD. Emelyanov,c f,8 C. Escobar,czA.I. Etienvre,c j A. Fabich,sK. Facius,vA.I. Fakhr-Edine,o M. Fanti,be,b f A. Farbin,d
P. Farthouat,sD. Fassouliotis,e L. Fayard,bqR. Febbraro,uO.L. Fedin,bv A. Fenyuk,cb
D. Fergusson,hP. Ferrari,s,9R. Ferrari,bt B.C. Ferreira,ch A. Ferrer,czD. Ferrere,ae
G. Filippini,u T. Flick,dc D. Fournier,bqP. Francavilla,bwD. Francis,sR. Froeschl,s,10 D. Froidevaux,sE. Fullana,bS. Gadomski,aeG. Gagliardi,a j P. Gagnon,aiM. Gallas,s
B.J. Gallop,c f S. Gameiro,sK.K. Gan,bpR. Garcia,azC. Garcia,czI.L. Gavrilenko,b j
C. Gemme,a j P. Gerlach,dcN. Ghodbane,uV. Giakoumopoulou,eV. Giangiobbe,bw N. Giokaris,e G. Glonti,anT. Goettfert,bmT. Golling,h,10 N. Gollub,sA. Gomes,at,au,by M.D. Gomez,ae S. Gonzalez-Sevilla,cz,3M.J. Goodrick,rG. Gorfine,boB. Gorini,s D. Goujdami,oK-J. Grahn,aqP. Grenier,u,11N. Grigalashvili,anY. Grishkevich,bl
J. Grosse-Knetter,l,12M. Gruwe,sC. Guicheney,uA. Gupta,t C. Haeberli,i
R. Haertel,bm,13 Z. Hajduk,y H. Hakobyan,deM. Hance,buJ.D. Hansen,v P.H. Hansen,v K. Hara,cu A. Harvey Jr.,agR.J. Hawkings,sF.E.W. Heinemann,bsA. Henriques
Correia,sT. Henss,dcL. Hervas,sE. Higon,czJ.C. Hill,r J. Hoffman,zJ.Y. Hostachy,aw I. Hruska,ca F. Hubaut,w F. Huegging,l W. Hulsbergen,s,9M. Hurwitz,t
L. Iconomidou-Fayard,bqE. Jansen,ceI. Jen-La Plante,t P.D.C. Johansson,cl
K. Jon-And,cp M. Joos,sS. Jorgensen,f J. Joseph,hA. Kaczmarska,y,14M. Kado,bq A. Karyukhin,cb M. Kataoka,s,15F. Kayumov,b j A. Kazarov,bvP.T. Keener,bu
G.D. Kekelidze,anN. Kerschen,clS. Kersten,dcA. Khomich,bc G. Khoriauli,an
E. Khramov,an A. Khristachev,bvJ. Khubua,an T.H. Kittelmann,v,16 R. Klingenberg,aa
E.B. Klinkby,acP. Kodys,caT. Koffas,sS. Kolos,cvS.P. Konovalov,b j
N. Konstantinidis,cw S. Kopikov,cbI. Korolkov,f V. Kostyukhin,a j,17 S. Kovalenko,bv T.Z. Kowalski,xK. Kr ¨uger,s,18V. Kramarenko,bl L.G. Kudin,bvY. Kulchitsky,bi
C. Lacasta,czR. Lafaye,ar B. Laforge,av W. Lampl,c F. Lanni,jS. Laplace,arT. Lari,be
A-C. Le Bihan,s,19 M. Lechowski,bqF. Ledroit-Guillon,aw G. Lehmann,sR. Leitner,ca D. Lelas,bqC.G. Lester,rZ. Liang,zP. Lichard,sW. Liebig,bo A. Lipniacka,g
M. Lokajicek,bzL. Louchard,uK.F. Loureiro,bpA. Lucotte,awF. Luehring,ai B. Lund-Jensen,aqB. Lundberg,ayH. Ma,j R. Mackeprang,v A. Maio,at,au,by
8Now at Joint Institute for Nuclear Research, Dubna Russia.
9Now at Nikhef National Institute for Subatomic Physics, Amsterdam Netherlands. 10Now at Yale University, New Haven U.S.A.
11Now at SLAC, Stanford U.S.A.
12Now at Georg-August-Universit¨at, G¨ottingen Germany. 13Now at Versicherungskammer Bayern, Munich Germany.
14Now at Universit´e Pierre et Marie Curie (Paris 6) and Universit´e Denis Diderot (Paris-7), Paris France. 15Now at Laboratoire de Physique de Particules (LAPP), Annecy-le-Vieux France.
2011 JINST 6 P04001
V.P. Maleev,bvF. Malek,awL. Mandelli,beJ. Maneira,by M. Mangin-Brinet,ae,20A. Manousakis,eL. Mapelli,sC. Marques,byS.Marti i Garcia,czF. Martin,bu
M. Mathes,l M. Mazzanti,be K.W. McFarlane,agR. McPherson,daG. Mchedlidze,cs
S. Mehlhase,ahC. Meirosu,sZ. Meng,ck C. Meroni,be V. Mialkovski,anB. Mikulec,ae,6 D. Milstead,cpI. Minashvili,anB. Mindur,xV.A. Mitsou,cz S. Moed,ae,21 E. Monnier,w G. Moorhead,bd P. Morettini,a j S.V. Morozov,bkM. Mosidze,csS.V. Mouraviev,b j
E.W.J. Moyse,sA. Munar,buA. Myagkov,cb A.V. Nadtochi,bv K. Nakamura,cu,22 P. Nechaeva,a j,23 A. Negri,bt S. Nemecek,bzM. Nessi,sS.Y. Nesterov,bv
F.M. Newcomer,buI. Nikitine,cb K. Nikolaev,anI. Nikolic-Audit,av H. Ogren,ai S.H. Oh,ac
S.B. Oleshko,bvJ. Olszowska,yA. Onofre,bg,by C. Padilla Aranda,sS. Paganis,cl,24 D. Pallin,u D. Pantea,nV. Paolone,bxF. Parodi,a j J. Parsons,bn S. Parzhitskiy,an
E. Pasqualucci,ciS.M. Passmored,sJ. Pater,bb S. Patrichev,bv M. Peez,azV. Perez
Reale,bnL. Perini,be,b f V.D. Peshekhonov,anJ. Petersen,sT.C. Petersen,vR. Petti,j,25 P.W. Phillips,c f J. Pilcher,t J. Pina,at,au,byB. Pinto,byF. Podlyski,uL. Poggioli,bq
A. Poppleton,sJ. Poveda,db P. Pralavorio,wL. Pribyl,sM.J. Price,sD. Prieur,c f C. Puigdengoles,f P. Puzo,bqF. Ragusa,be,b f S. Rajagopalan,j K. Reeves,dc,26
I. Reisinger,aaC. Rembser,sP.A.Bruckman.de. Renstrom,bsP. Reznicek,caM. Ridel,av
P. Risso,a j I. Riu,ae,27 D. Robinson,rC. Roda,bwS. Roe,sO. Røhne,brA. Romaniouk,bk D. Rousseau,bqA. Rozanov,wA. Ruiz,czN. Rusakovich,an D. Rust,ai Y.F. Ryabov,bv
V. Ryjov,sO. Salto,f B. Salvachua,bA. Salzburger,al,6H. Sandaker,gC. Santamarina
Rios,sL. Santi,ak C. Santoni,uJ.G. Saraiva,at,au,byF. Sarri,bwG. Sauvage,arL.P. Says,u
M. Schaefer,awV.A. Schegelsky,bv C. Schiavi,a j J. Schieck,bmG. Schlager,s
J. Schlereth,b C. Schmitt,ba J. Schultes,dc P. Schwemling,av J. Schwindling,c j J.M. Seixas,chD.M. Seliverstov,bvL. Serin,bqA. Sfyrla,ae,6 N. Shalanda,bhC. Shaw,a f
T. Shin,agA. Shmeleva,b j J. Silva,by S. Simion,bq M. Simonyan,arJ.E. Sloper,s
S.Yu. Smirnov,bk L. Smirnova,bl C. Solans,cz A. Solodkov,cb O. Solovianov,cb
I. Soloviev,bv V.V. Sosnovtsev,bk F. Span `o,bnP. Speckmayer,sS. Stancu,cvR. Stanek,b
E. Starchenko,cbA. Straessner,abS.I. Suchkov,bk M. Suk,caR. Szczygiel,x F. Tarrade,j F. Tartarelli,beP. Tas,caY. Tayalati,u F. Tegenfeldt,amR. Teuscher,ct
M. Thioye,cq V.O. Tikhomirov,b jC.J.W.P. Timmermans,ceS. Tisserant,wB. Toczek,x
L. Tremblet,sC. Troncon,beP. Tsiareshka,biM. Tyndel,c f M.Karagoez. Unel,bs G. Unal,sG. Unel,ai G. Usai,t R. Van Berg,buA. Valero,cz S. Valkar,caJ.A. Valls,cz
W. Vandelli,sF. Vannucci,av A. Vartapetian,d V.I. Vassilakopoulos,agL. Vasilyeva,b j 20Now at Laboratoire de Physique Subatomique et de Cosmologie CNRS/IN2P3, Grenoble France.
21Now at Harvard University, Cambridge U.S.A. 22Now at ICEPP, Tokyo Japan.
23Now at P.N. Lebedev Institute of Physics, Moscow Russia. 24Corresponding author.
25Now at University of South Carolina, Columbia U.S.A. 26Now at UT Dallas, Dallas U.S.A.
2011 JINST 6 P04001
F. Vazeille,uF. Vernocchi,a jY. Vetter-Cole,zI. Vichou,cyV. Vinogradov,anJ. Virzi,hI. Vivarelli,bwJ.B.de. Vivie,w,28 M. Volpi,f T. Vu Anh,ae,29 C. Wang,ac M. Warren,cw
J. Weber,aaM. Weber,c f A.R. Weidberg,bsJ. Weingarten,l,12P.S. Wells,sP. Werner,s
S. Wheeler,aM. Wiessmann,bmH. Wilkens,sH.H. Williams,buI. Wingerter-Seez,ar
Y. Yasu,apA. Zaitsev,cb A. Zenin,cbT. Zenis,mZ. Zenonos,bwH. Zhang,wA. Zhelezkobk and N. Zhoubn
aUniversity of Alberta, Department of Physics, Centre for Particle Physics, Edmonton, AB T6G 2G7, Canada
bArgonne National Laboratory, High Energy Physics Division, 9700 S. Cass Avenue, Argonne IL 60439, U.S.A.
cUniversity of Arizona, Department of Physics, Tucson, AZ 85721, U.S.A.
dUniversity of Texas at Arlington, Department of Physics, Box 19059, Arlington, TX 76019, U.S.A.
eUniversity of Athens, Nuclear & Particle Physics Department of Physics, Panepistimiopouli Zografou, GR 15771 Athens, Greece
fInstitut de Fisica d’Altes Energies, IFAE, Universitat Aut`onoma de Barcelona, Edifici Cn, ES-08193 Bellaterra (Barcelona) Spain
gUniversity of Bergen, Department for Physics and Technology, Allegaten 55, NO-5007 Bergen, Norway
hLawrence Berkeley National Laboratory and University of California, Physics Division, MS50B-6227, 1 Cyclotron Road, Berkeley, CA 94720, U.S.A.
iUniversity of Bern, Laboratory for High Energy Physics, Sidlerstrasse 5, CH-3012 Bern, Switzerland
jBrookhaven National Laboratory, Physics Department, Bldg. 510A, Upton, NY 11973, U.S.A.
kBogazici University, Faculty of Sciences, Department of Physics, TR-80815 Bebek-Istanbul, Turkey
lPhysikalisches Institut der Universitaet Bonn, Nussallee 12, D-53115 Bonn, Germany
mComenius University, Faculty of Mathematics Physics & Informatics, Mlynska dolina F2, SK-84248 Bratislava, Slovak Republic
nNational Institute of Physics and Nuclear Engineering (Bucharest -IFIN-HH), P.O. Box MG-6, R-077125 Bucharest, Romania
oUniversit´e Cadi Ayyad, Marrakech, Morocco
pDepartment of Physics, University of Coimbra, P-3004-516 Coimbra, Portugal
qUniversit´e Hassan II, Facult´e des Sciences Ain Chock, B.P. 5366, MA-Casablanca, Morocco
2011 JINST 6 P04001
sEuropean Laboratory for Particle Physics (CERN), CH-1211 Geneva 23, Switzerland
tUniversity of Chicago, Enrico Fermi Institute, 5640 S. Ellis Avenue, Chicago, IL 60637, U.S.A.
uLaboratoire de Physique Corpusculaire (LPC), IN2P3-CNRS, Universit´e Blaise-Pascal, Clermont-Ferrand, FR-63177 Aubiere, France
vNiels Bohr Institute, University of Copenhagen, Blegdamsvej 17, DK-2100 Kobenhavn 0, Denmark
wUniversit´e M´editerran´ee, Centre de Physique des Particules de Marseille, CNRS/IN2P3, F-13288 Marseille, France
xFaculty of Physics and Applied Computer Science of the AGH-University of Science and Technology, (FPACS, AGH-UST),
al. Mickiewicza 30, PL-30059 Cracow, Poland
yThe Henryk Niewodniczanski Institute of Nuclear Physics, Polish Academy of Sciences, ul. Radzikowskiego 152, PL-31342 Krakow Poland
zSouthern Methodist University, Physics Department,
106 Fondren Science Building, Dallas, TX 75275-0175, U.S.A. aaUniversitaet Dortmund, Experimentelle Physik IV,
DE-44221 Dortmund, Germany
abTechnical University Dresden, Institut fuer Kern- und Teilchenphysik, Zellescher Weg 19, D-01069 Dresden, Germany
acDuke University, Department of Physics, Durham, NC 27708, U.S.A.
adCentre de Calcul CNRS/IN2P3, Lyon, France
aeUniversit´e de Gen`eve, section de Physique,
24 rue Ernest Ansermet, CH-1211 Gen`eve 4, Switzerland a fUniversity of Glasgow, Department of Physics and Astronomy,
Glasgow G12 8QQ, U.K.
agHampton University, Department of Physics, Hampton, VA 23668, U.S.A.
ahInstitute of Physics, Humboldt University, Berlin, Newtonstrasse 15, D-12489 Berlin, Germany aiIndiana University, Department of Physics,
Swain Hall West 117, Bloomington, IN 47405-7105, U.S.A. a jINFN Genova and Universit`a di Genova, Dipartimento di Fisica,
via Dodecaneso 33, IT-16146 Genova, Italy
akINFN Gruppo Collegato di Udine and Universit`a di Udine, Dipartimento di Fisica, via delle Scienze 208, IT-33100 Udine, Italy and
INFN Gruppo Collegato di Udine and ICTP, Strada Costiera 11, IT-34014 Trieste, Italy alInstitut fuer Astro- und Teilchenphysik,
Technikerstrasse 25, A-6020 Innsbruck, Austria
amIowa State University, Department of Physics and Astronomy, Ames High Energy Physics Group, Ames, IA 50011-3160, U.S.A.
2011 JINST 6 P04001
anJoint Institute for Nuclear Research, JINR Dubna, RU-141 980 Moscow Region, Russia
aoInstitut fuer Prozessdatenverarbeitung und Elektronik, Karlsruher Institut fuer Technologie, Campus Nord, Hermann-v.Helmholtz-Platz 1, D-76344 Eggenstein-Leopoldshafen, Germany apKEK, High Energy Accelerator Research Organization,
1-1 Oho Tsukuba-shi, Ibaraki-ken 305-0801, Japan aqRoyal Institute of Technology (KTH), Physics Department,
SE-106 91 Stockholm, Sweden
arLaboratoire de Physique de Particules (LAPP), Universit´e de Savoie, CNRS/IN2P3, Annecy-le-Vieux Cedex, France
asLaboratoire de Physique de Particules (LAPP), Universit´e de Savoie, CNRS/IN2P3, Annecy-le-Vieux Cedex, France and
Universit´e Cadi Ayyad, Marrakech, Morocco
atDepartamento de Fisica, Faculdade de Ciˆencias, Universidade de Lisboa, P-1749-016 Lisboa, Portugal
auCentro de F´ısica Nuclear da Universidade de Lisboa, P-1649-003 Lisboa, Portugal
avUniversit´e Pierre et Marie Curie (Paris 6) and Universit´e Denis Diderot (Paris-7), Laboratoire de Physique Nucl´eaire et de Hautes Energies, CNRS/IN2P3,
Tour 33 4 place Jussieu, FR-75252 Paris Cedex 05, France
awLaboratoire de Physique Subatomique et de Cosmologie CNRS/IN2P3, Universit´e Joseph Fourier INPG, 53 avenue des Martyrs, FR-38026 Grenoble Cedex, France
axLaboratoire de Physique Th´eorique et de Physique des Particules, Universit´e Mohammed Premier, Oujda, Morocco
ayLunds universitet, Naturvetenskapliga fakulteten, Fysiska institutionen, Box 118, SE-221 00, Lund, Sweden
azUniversidad Autonoma de Madrid, Facultad de Ciencias, Departamento de Fisica Teorica, ES-28049 Madrid, Spain
baUniversit¨at Mainz, Institut f¨ur Physik, Staudinger Weg 7, DE-55099, Germany
bbSchool of Physics and Astronomy, University of Manchester, Manchester M13 9PL, U.K.
bcUniversitaet Mannheim, Lehrstuhl fuer Informatik V, B6, 23-29, DE-68131 Mannheim, Germany
bdSchool of Physics, University of Melbourne, AU-Parkvill, Victoria 3010, Australia beINFN Sezione di Milano,
via Celoria 16, IT-20133 Milano, Italy b fUniversit`a di Milano, Dipartimento di Fisica,
via Celoria 16, IT-20133 Milano, Italy bg
2011 JINST 6 P04001
biB.I. Stepanov Institute of Physics, National Academy of Sciences of Belarus, Independence Avenue 68, Minsk 220072, Republic of Belarus and
Joint Institute for Nuclear Research, JINR Dubna, RU-141 980 Moscow Region, Russia
b jP.N. Lebedev Institute of Physics, Academy of Sciences, Leninsky pr. 53, RU-117 924, Moscow, Russia
bkMoscow Engineering & Physics Institute (MEPhI), Kashirskoe Shosse 31, RU-115409 Moscow, Russia
blLomonosov Moscow State University, Skobeltsyn Institute of Nuclear Physics, RU-119 991 GSP-1 Moscow Lenskiegory 1-2, Russia
bmMax-Planck-Institut f¨ur Physik, (Werner-Heisenberg-Institut), F¨ohringer Ring 6, 80805 M¨unchen, Germany
bnColumbia University, Nevis Laboratory, 136 So. Broadway, Irvington, NY 10533, U.S.A. boNikhef National Institute for Subatomic Physics,
Kruislaan 409, P.O. Box 41882, NL-1009 DB Amsterdam, Netherlands bpOhio State University,
191 West WoodruAve, Columbus, OH 43210-1117, U.S.A. bqLAL, Universit´e Paris-Sud, IN2P3/CNRS,
Orsay, France
brUniversity of Oslo, Department of Physics, P.O. Box 1048, Blindern T, NO-0316 Oslo, Norway bsDepartment of Physics, Oxford University,
Denys Wilkinson Building, Keble Road, Oxford OX1 3RH, U.K.
btUniversit`a di Pavia, Dipartimento di Fisica Nucleare e Teorica and INFN Pavia, Via Bassi 6 IT-27100 Pavia, Italy
buUniversity of Pennsylvania, Department of Physics, High Energy Physics, 209 S. 33rd Street Philadelphia, PA 19104, U.S.A.
bvPetersburg Nuclear Physics Institute, RU-188 300 Gatchina, Russia
bwUniversit`a di Pisa, Dipartimento di Fisica E. Fermi and INFN Pisa, Largo B.Pontecorvo 3, IT-56127 Pisa, Italy
bxUniversity of Pittsburgh, Department of Physics and Astronomy, 3941 O’Hara Street, Pittsburgh, PA 15260, U.S.A.
byLaboratorio de Instrumentacao e Fisica Experimental de Particulas — LIP, and SIM/Univ. de Lisboa,
Avenida Elias Garcia 14-1, PT-1000-149, Lisboa, Portugal
bzAcademy of Sciences of the Czech Republic, Institute of Physics and Institute for Computer Science, Na Slovance 2, CZ-18221 Praha 8, Czech Republic
caCharles University in Prague, Faculty of Mathematics and Physics, Institute of Particle and Nuclear Physics,
V Holesovickach 2, CZ-18000 Praha 8, Czech Republic
cbInstitute for High Energy Physics (IHEP), Federal Agency of Atom. Energy, Moscow Region, RU-142 284 Protvino, Russia
ccQueen Mary, University of London, Mile End Road, E1 4NS, London, U.K.
2011 JINST 6 P04001
cdUniversit´e Mohammed V, Facult´e des Sciences, BP 1014, MO-Rabat, Morocco
ceRadboud University Nijmegen/NIKHEF, Dept. of Exp. High Energy Physics, Toernooiveld 1, NL-6525 ED Nijmegen, Netherlands
c fRutherford Appleton Laboratory, Science and Technology Facilities Council, Harwell Science and Innovation Campus, Didcot OX11 0QX, U.K.
cgUniversity of Regina, Physics Department, Wascana Parkway, Regina, SK, S4S 0A2, Canada
chUniversidade Federal do Rio De Janeiro, Instituto de Fisica,
Caixa Postal 68528, Ilha do Fundao, BR-21945-970 Rio de Janeiro, Brazil ciUniversit`a La Sapienza, Dipartimento di Fisica and INFN Roma I,
Piazzale A. Moro 2, IT- 00185 Roma, Italy
c jCommissari`at a l’Enegie Atomique (CEA), DSM/DAPNIA, Centre d’Etudes de Saclay, 91191 Gif-sur-Yvette, France
ckInsitute of Physics, Academia Sinica, TW-Taipei 11529, Taiwan and
Shandong University, School of Physics, Jinan, Shandong 250100, P. R. China
clUniversity of Sheffield, Department of Physics & Astronomy, Hounseld Road, Sheffield S3 7RH, U.K.
cmInsitute of Physics, Academia Sinica, TW-Taipei 11529, Taiwan
cnSLAC National Accelerator Laboratory, Stanford, California 94309, U.S.A.
coUniversity of South Carolina, Columbia, U.S.A.
cpStockholm University, Department of Physics and The Oskar Klein Centre, SE-106 91 Stockholm, Sweden
cqDepartment of Physics and Astronomy, Stony Brook, NY 11794-3800, U.S.A. crInstitute of Physics, Academia Sinica,
TW-Taipei 11529, Taiwan and
Sun Yat-sen University, School of physics and engineering, Guangzhou 510275, P. R. China
csTbilisi State University, High Energy Physics Institute, University St. 9, GE-380086 Tbilisi, Georgia
ctUniversity of Toronto, Department of Physics,
60 Saint George Street, Toronto M5S 1A7, Ontario, Canada cuUniversity of Tsukuba, Institute of Pure and Applied Sciences,
1-1-1 Tennoudai, Tsukuba-shi, JP-Ibaraki 305-8571, Japan cvUniversity of California, Department of Physics & Astronomy,
Irvine, CA 92697-4575, U.S.A. cw
2011 JINST 6 P04001
cyUniversity of Illinois, Department of Physics,
1110 West Green Street, Urbana, Illinois 61801 U.S.A.
czInstituto de F´ısica Corpuscular (IFIC), Centro Mixto UVEG-CSIC, Apdo. 22085, ES-46071 Valencia, Spain and
Dept. F´ısica At., Mol. y Nuclear, Univ. of Valencia, Valencia Spain and Instituto de Microelectr´onica de Barcelona (IMB-CNM-CSIC), 08193 Bellaterra, Barcelona, Spain
daUniversity of Victoria, Department of Physics and Astronomy, P.O. Box 3055, Victoria B.C., V8W 3P6, Canada
dbUniversity of Wisconsin, Department of Physics,
1150 University Avenue, WI 53706 Madison, Wisconsin, U.S.A. dcBergische Universitaet, Fachbereich C, Physik,
Postfach 100127, Gauss-Strasse 20, DE-42097 Wuppertal, Germany ddYale University, Department of Physics,
PO Box 208121, New Haven, CT06520-8121, U.S.A. deYerevan Physics Institute,
Alikhanian Brothers Street 2, AM-375036 Yrevan, Armenia
E-mail:stathes.paganis@cern.ch
ABSTRACT: The reconstruction of photons in the ATLAS detector is studied with data taken during the 2004 Combined Test Beam, where a full slice of the ATLAS detector was exposed to beams of particles of known energy at the CERN SPS. The results presented show significant differences in the longitudinal development of the electromagnetic shower between converted and unconverted photons as well as in the total measured energy. The potential to use the reconstructed converted photons as a means to precisely map the material of the tracker in front of the electromagnetic calorimeter is also considered. All results obtained are compared with a detailed Monte-Carlo simulation of the test-beam setup which is based on the same simulation and reconstruction tools as those used for the ATLAS detector itself.
KEYWORDS: Transition radiation detectors; Calorimeters; Large detector systems for particle and astroparticle physics; Particle tracking detectors (Solid-state detectors)
2011 JINST 6 P04001
Contents1 Introduction 2
2 Experimental setup 3
2.1 The H8 SPS beam line 3
2.2 The CTB reference system 3
2.3 Photon beam line 3
2.4 The detectors 4
3 Monte Carlo simulation of the test beam setup 7
3.1 Particle generation 7
3.2 Beam conditions 8
3.3 Digitization 8
4 Event reconstruction and selection 8
4.1 Data sample 8
4.2 Track reconstruction 9
4.3 Cluster reconstruction in the LAr calorimeter 9
4.4 Event selection 10
5 Comparison of calorimeter response for converted and unconverted photons 11
5.1 Single photon cluster selection 11
5.2 Calorimeter response to photons contained within a single cluster 11
5.3 Systematic uncertainties on the fractional energy difference 15
6 Reconstruction of converted photon vertices 17
6.1 Tracks used in the photon conversion reconstruction 17
6.2 Converted photon event selection 17
6.2.1 Tracking efficiency and purity 19
6.3 Vertex reconstruction 19
6.3.1 Vertex reconstruction efficiency and purity 21
6.4 Conversion reconstruction efficiency 21
7 Inner detector material estimation using photon conversions 23
7.1 Description of the method 23
7.2 Number of reconstructed vertices 24
7.2.1 Efficiency (AMC) and background (PMC) correction per layer 25
7.3 Systematic uncertainties and material estimations 25
2011 JINST 6 P04001
1 IntroductionIn 2004 the ATLAS collaboration embarked on a Combined Test Beam (CTB) campaign, where a full slice of the barrel detector was exposed to particle beams (electrons, pions, muons, protons and photons) of energy ranging from 1 to 350 GeV. The main goals of this campaign were to study the detector performance in a controlled environment, to validate the description of the data by the Monte-Carlo (MC) simulation and to perform combined studies in a setup close to that of ATLAS (e.g. studies using the inner tracker with electromagnetic and hadronic calorimetry). One of these combined studies focuses on photon reconstruction. In the specific beam setup used for this study, photons were produced via Bremsstrahlung from 180 GeV electrons incident on a thin target upstream of the experimental apparatus. The goal of these runs was to study the reconstruction of converted and unconverted photons with and without magnetic field.
In ATLAS the photon energy is measured with the Liquid Argon (LAr) electromagnetic ca-lorimeter [1]. The significant amount of material upstream of the LAr calorimeter (due to the tracker, services, cryostat etc., amounting to an average of ∼ 4X0 in the pseudorapidity range
−2.5 <η< 2.5) necessitates a photon energy calibration which is different from the electron
cal-ibration in ATLAS [2]. This particle specific calibration is currently based on MC relying on the best knowledge of the amount of material upstream of the calorimeter. Photon calibration is a challenging task given that converted photons require different calibration from unconverted ones. Converted photons are those which convert in or upstream of the TRT tracker, while unconverted photons are those which arrive at the LAr cryostat without creating an e+e− pair. The identifi-cation of conversions by means of the inner tracker becomes thus a necessary step in the photon calibration. Both the reconstruction of converted photons and a careful calibration of the calorime-ter response for photons are of great importance for physics measurements involving photons in their final state, e.g. the decay of the Higgs boson into two photons.
Several aspects of the photon beam analysis are presented in this note. By exploiting the full inner detector capabilities combined with the LAr calorimeter, the study of the reconstruction of photon conversions is performed. In addition, the difference in the reconstructed energy using the LAr calorimeter for e+e− pairs (from converted photons) and unconverted photons of the same energy is investigated. Finally the use of the converted photons for an estimation of the amount of the material in the different pixel layers is studied.
The detector layout is described in section 2, whereas the simulation of the experimental setup is discussed in section 3. Section 4 deals with the global event reconstruction and selection for further analysis. The reconstruction of converted photons contained in the same LAr cluster and unconverted photons, is presented in section 5. A detailed comparison of the response of the calorimeter to converted and unconverted photons is given, together with the systematic uncertain-ties of the analysis. The converted photon reconstruction is presented in section 6 and its appli-cation to evaluating the amount of material in the tracker in section 7 together with a study of the corresponding systematic uncertainties .
2011 JINST 6 P04001
2 Experimental setup2.1 The H8 SPS beam line
The H8 beam line in the North Area of CERN provides secondary and tertiary beams of hadrons, electrons or muons with energies from 1 to 350 GeV for the ATLAS test beam [3]. For this test beam, the secondary beam is produced by a proton beam with energies up to 400 GeV, extracted from the Super Proton Synchrotron. The protons impinge on the primary target (T4) producing showers of secondary particles from which the secondary beams are extracted. The creation of tertiary beams is handled by placing a second target 130m downstream of the primary target.
The H8 beam line consists of a number of quadrupole and dipole magnets, for focusing and bending the particle trajectories, and for defining the particle momentum by controlling the magnet currents. A large spectrometer constructed of six standard dipole magnets is used for the momen-tum definition.
2.2 The CTB reference system
The reference system is defined to be as consistent as possible with the ATLAS reference system. The(x, y, z) coordinates are defined as follows:
• x-axis along the H8-beam; • y-axis vertically upwards; • z-axis horizontally;
• x= y = z = 0 on the nominal axis of the H8-beam, at the front surface of the CTB magnet
used to emulate the ATLAS solenoidal magnetic field (MBPS).
The CTB magnet is a dipole providing a magnetic field of 1.4 Tesla over a length of 1.5 m re-sulting in the deflection of positively charged particles along positive y. Therefore, the y and z measurements in the CTB setup correspond to theφandηmeasurements in ATLAS.
2.3 Photon beam line
As illustrated in figure 1, the secondary 180 GeV positron beam impinges on the Pb target at x= −27500 mm, where in turn Bremsstrahlung photons are emitted. Downstream, there are
two-magnet systems MBPL12 (1.5 T) and MBPL13 (1.35 T), located at x = −11702 mm and
x= −15500 mm respectively. The magnets are used to separate the primary positron from the
radiated photon. The first magnet separates the positron from the photon in the z direction, while the second one deflects it in the y direction. The separation changes by applying different magnetic fields. Each magnet has a maximum bending power of 3.8 Tm. Positrons are triggered by a small scintillator (8x8 mm2), placed at x = −1675 mm, which determines therefore the position, i.e.
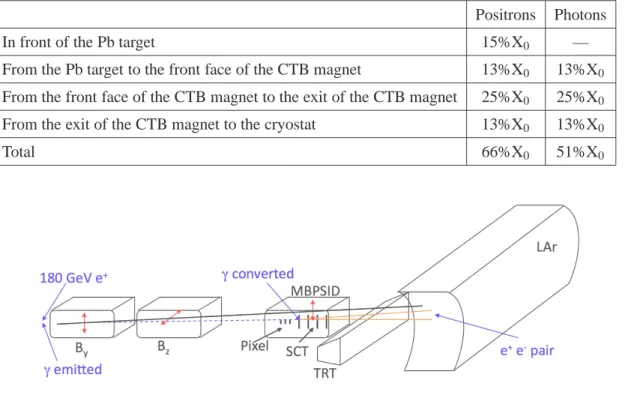
the momentum, of the outgoing positron. This has a mean value of about 120 GeV with a 10 GeV spread coming from the spread of the incident positron position and the width of the scintillator. Given that both positrons and photons lose energy as they traverse material - 0.66 X0and 0.51 X0 respectively - before hitting the LAr Calorimeter, it is essential to accurately account for the total amount of material along the beam line (see table1).
2011 JINST 6 P04001
Table 1. Breakdown of the amount of material in the H8 beam line for the photon setup.Positrons Photons
In front of the Pb target 15%X0 —
From the Pb target to the front face of the CTB magnet 13%X0 13%X0 From the front face of the CTB magnet to the exit of the CTB magnet 25%X0 25%X0
From the exit of the CTB magnet to the cryostat 13%X0 13%X0
Total 66%X0 51%X0
Figure 1. Schematic view of the photon beam setup.
The photon runs can be divided into two main categories depending on whether the B-field is on or not. In the second case the silicon trackers have been removed from the beam line. In this paper results from runs with the B-field on are presented, while the B-field off runs are used for studying various systematic effects.
2.4 The detectors
The entire volume of the test beam setup (see figure 3) has been designed to include all detectors in addition to the pre-existing beam line elements. Exact coordinates for each sub-detector can be found in [4]. The relevant detectors for the measurements presented in this paper are the tracker, which consists of three sub-systems, the pixel, the silicon strips tracker (SCT) and the transition radiation tracker (TRT) (see figure2), and the calorimeter.
The pixel detector consists of three layers (Pixel B, Pixel 1 and 2). Each layer has two modules, and each module has an active size of z × y= 60.8 × 16.4 mm2. Each module is positioned at an angle of 20◦and with superposition of the two modules in Layer 1 and 2 of 0.2 mm. For the photon
runs, a thin copper foil was placed at a distance of 77 mm upstream from the front of the pixel box. It is 37µm in thickness corresponding to 0.25 X0in radiation lengths with transverse dimensions of 55 × 105 mm. It provides a reference point for the material measurement described in section7. The SCT detector consists of 4 layers with 2 modules per layer, each module covering an area z × y= 120 × 60 mm2. There is a 4 mm overlap between the upper and lower modules in the layer. The two middle modules are centered vertically with respect to the beam axis, while the first and
2011 JINST 6 P04001
Figure 2. Event display of a converted photon as seen in the CTB setup. The three tracker sub-systems are visualized. Starting from the left these are the pixel, the silicon strips and the transition radiation tracker. See text for a more detailed description of each one of them.
last ones are offset in y by −5 mm and+5 mm respectively. Everything is enclosed within a box
of dx= 330 mm, dy = 300 mm and dz = 200 mm, and the box starts from x = 347 mm. The
front silicon side of the lower module in the third SCT layer was not operational.
The TRT detector is made of two barrel wedges. Each barrel wedge is equivalent to 1/16 of
the circumference of a cylinder, with inner radius of 558 mm and outer radius of 1080 mm and overall length of 1425.5 mm. The center of the cylindrical wedge is located at x = 1152 mm,
z= 550 mm, while its y position is located at −8 mm for the photon runs. Its angular extent,
in-cluding the support structures, is∆φ= 28.125◦, starting atφ= −17.375◦. One TRT barrel wedge
consists of three modules.
The distance in ATLAS between the last SCT layer and the first TRT plane is 40 mm, while in the Combined Test Beam layout it is increased to ≈ 1114 mm, leaving a clearance of about 345 mm between the magnet coils and the TRT support structure.
Both the SCT and pixel modules are placed inside a permanent dipole magnet called the MBPS magnet that generates the magnetic field necessary for the track reconstruction. Due to space considerations, the TRT module is kept outside.
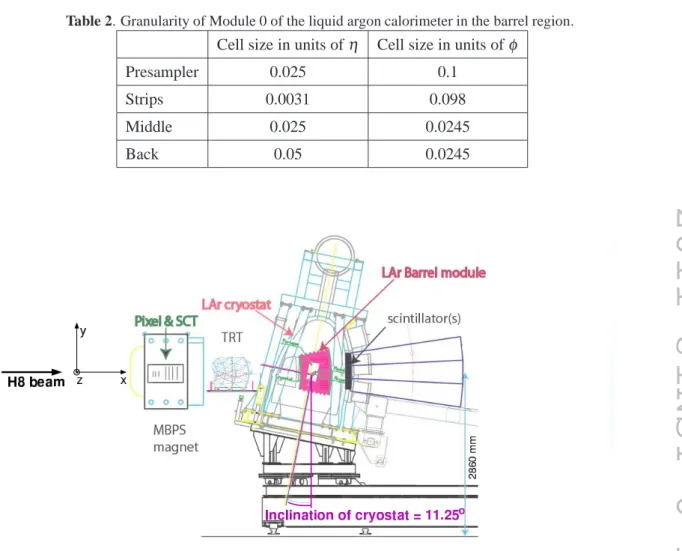
The calorimeter is positioned after the TRT sub-detector. Module 0 of the Liquid Argon (LAr) electromagnetic barrel calorimeter is placed inside a cryostat. Due to the large size and shape of the
2011 JINST 6 P04001
Table 2. Granularity of Module 0 of the liquid argon calorimeter in the barrel region.Cell size in units ofη Cell size in units ofφ
Presampler 0.025 0.1
Strips 0.0031 0.098
Middle 0.025 0.0245
Back 0.05 0.0245
Figure 3. Schematic of the test beam setup. The beam particles first hit the pixel and SCT modules and then continue towards the TRT, calorimeters and muon modules.
cryostat, an argon excluder (a block of Rohacell1) was installed in front of the module to minimize the amount of passive material just in front of the EM calorimeter. Its total thickness is greater than 22 radiation lengths (X0) in the barrel. The calorimeter, being of accordion shape, is segmented into three longitudinal sections called layers (“front” or “strips”, “middle” and “back”). The calorimeter is preceded by a presampler device. The granularity of the calorimeter and presampler (cell size) is described in table2[2].
Behind the back wall of the cryostat, three hadronic calorimeter modules are stacked. These are iron scintillating tile sampling calorimeters. All calorimeter modules (82 tons) are placed per-pendicular to the beam line and are supported on a rotating table. The table rotates about the vertical axis and translates along the z (horizontal) axis. These two motions allow for the simu-lation of different impact points in η. The table, however, cannot be rotated inφ, therefore, to simulate different impact points inφ a deflecting magnetic field is needed.
1Rohacell is a rigid-foam with very low density.
2011 JINST 6 P04001
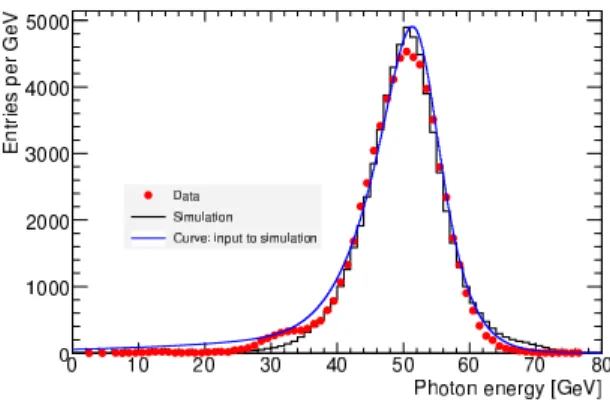
Figure 4. Measured energy spectrum for triggered unconverted photons (full circles). Also shown are the functional form used as an input to the simulation for the photon energy spectrum (curve) and the resulting reconstructed energy spectrum for the simulation (histogram).3 Monte Carlo simulation of the test beam setup
One of the most challenging aspects of the analysis reported here, is the Monte Carlo simulation of the photon run. This section describes the necessary steps for the production of the Monte Carlo samples using the ATLAS software framework for the photon runs, as well as the needed correc-tions applied to the Monte Carlo in order to obtain as close as possible a description of the data.
3.1 Particle generation
At the particle generator level, one can determine the type of particle to be generated, its energy, the calorimeter coordinates, the beam spot as well as the starting point of the beam. The particles, are then sent to Geant4 [5] for a complete detector simulation. Geant4 uses Monte Carlo methods to simulate the physics processes when particles pass through matter. For a detailed description of the CTB experimental setup in Geant4 see [6].
In the case of the photon runs, the photon beam is created from an original positron beam with nominal energy of 180 GeV. This results to two correlated particles (a positron and a photon) being present, whose momentum spectra are not monochromatic and which for each event add up to the nominal original beam energy. Therefore, to properly simulate this configuration, the particle gen-erator is modified in order to be able to handle two particles with known energy spectra. The photon spectrum is derived from the data using triggered unconverted photons and reconstructing the clus-ter energy as described in [4] without any corrections applied. This spectrum is then parametrized and its functional form is fed into the particle generator. During successive iterations the input photon spectrum to the particle generator is adjusted so that the agreement of the reconstructed photon spectrum between the data and the simulation is good. In figure4such a measured photon spectrum is shown. Also shown is the functional form used as an input to the particle generator and the resulting reconstructed energy spectrum after the simulation. The small bump present in the data at ∼ 30 GeV is due to secondary photons due to bremsstrahlung losses of the primary high energy positron upstream of the tracker. Finally the corresponding positron energy is determined by subtracting the photon energy from the original positron beam nominal energy.
2011 JINST 6 P04001
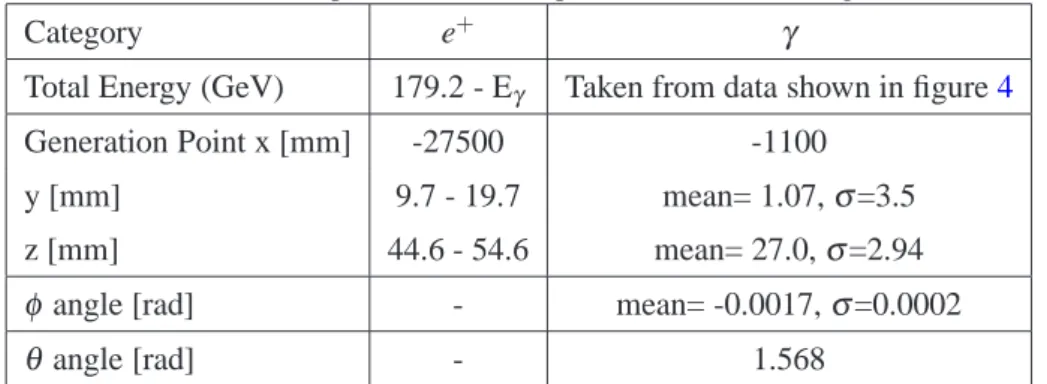
Table 3. Monte Carlo parameters for the photon test-beam event generationCategory e+ γ
Total Energy (GeV) 179.2 - Eγ Taken from data shown in figure4
Generation Point x [mm] -27500 -1100
y [mm] 9.7 - 19.7 mean= 1.07,σ=3.5
z [mm] 44.6 - 54.6 mean= 27.0,σ=2.94
φangle [rad] - mean= -0.0017,σ=0.0002
θangle [rad] - 1.568
3.2 Beam conditions
To ensure optimal agreement between the simulation and the collected data, the beam conditions, such as the profile and the divergence of the produced photon beam, need to be properly estimated. This is done by using the track parameters at the perigee of the converted photons reconstructed in the silicon tracker. The perigee is a reference point located at the entrance of the bending magnet enveloping the silicon tracker (MBPS). Since the photon beam conditions using converted photons can only be derived from the data at a location right in front of the MBPS magnet, the origin of the photon beam in the simulation is placed 1.1 m in front of it. All the upstream material that the photons should have traversed up to this point,is then condensed into an aluminum block with an equivalent thickness of 13% of a radiation length positioned 1 m in front of the MBPS magnet. The original positrons on the other hand are created much earlier at -27.5 m allowing them to pass through the upstream bending magnets and deflected away from the photon beam. The simulation of the beam profiles of both the original positrons and the photons ensures that the two beams traverse the CTB line and impact the electromagnetic calorimeter realistically reproducing the data behavior. The parameters used by the simulation for the runs with the MBPS magnet enveloping the silicon tracker turned on, are listed in table3.
3.3 Digitization
The output of the Geant4 simulation needs to be digitized before it can be reconstructed. Digitiza-tion is a process whereby the output of the detector simulaDigitiza-tion called hits is converted to a raw-data format. This stage emulates the effects of the readout chain such as electronic noise and cross-talk. The file obtained during the digitization can then be processed by the reconstruction software. 4 Event reconstruction and selection
In this section a summary of the inner tracker and LAr calorimeter reconstruction algorithms rele-vant to the photon reconstruction is presented.
4.1 Data sample
For the work presented in this paper, only runs with an incoming photon beam and with magnetic field on are presented. For these runs the silicon tracker is present in the beam line and the magnetic field is at its nominal value. They amount to ∼300000 events.
2011 JINST 6 P04001
4.2 Track reconstruction
In order to properly identify photon conversions a dedicated track reconstruction sequence has been implemented and adapted to the specific geometry of the CTB setup. The standard tracking method used is the so-called Inside − Out tracking. The name stems from the fact that the track reconstruction starts from the silicon tracker and progresses towards the TRT tracker. First a silicon track segment is reconstructed starting from the largest number of silicon (both pixel and SCT) hits that fall into a line (straight line when the magnetic field is off, a circle when on). Fast fits are performed to determine which of these hits will be retained starting from the first three silicon hits and then gradually adding more. This substantially reduces the combinatorics without any loss in efficiency. As soon as the silicon track segment has been formed in this manner, TRT extensions are added to it assuming that the track stays within the fiducial acceptance of the TRT detector. The final track parameters are then determined by a global χ2minimization of the residuals (defined as the difference between the measurement position and the one predicted by the track) and their errors. For more details see [7]. The Inside − Out tracking is very efficient in reconstructing tracks in particularly busy environments since the high granularity of the silicon trackers can provide the necessary resolution for recovering the track-hit pattern. However, this algorithm is limited to re-constructing tracks that originate in the pixels or the first SCT layer, since a minimum of seven silicon hits are required for a track in order to be reconstructed.
To remedy for this, a complementary algorithm aiming at reconstructing primarily tracks from secondary particles, such as those originating from photon conversions, is also used. This will be referred to as the Back-tracking algorithm. Here track segments are first reconstructed inside the TRT tracker. The reconstructed TRT track segments are then extrapolated backwards towards the silicon tracker. Silicon space-point seeds are then searched for in the three SCT layers closest to the TRT. A minimum of two space-points is required in this case. After the space-point seed formation additional hits are then added layer-by-layer and the track parameters are computed using the Kalman-filter formalism [8]. The track parameters are updated after every successive hit has been added and outliers are immediately eliminated through their large contribution to theχ2of the track fit. For more details on the Back-tracking reconstruction algorithm and on how the tracks are used afterwards for the reconstruction of photon conversions in the ATLAS tracker, see [9].
Finally, the tracks reconstructed by the two algorithms are combined and any overlap between the resulting track collections is removed as explained in more detail in section6.1. This then con-stitutes the final track collection to be used for reconstructing photon conversions inside the tracker.
4.3 Cluster reconstruction in the LAr calorimeter
A cluster in the LAr calorimeter is formed by a group of cells. A simple projective cone algorithm is used to collect the cell energies in clusters (see [4] and references therein). Starting from cells in the middle layer, the most energetic cell is taken as the seed of the cluster and a fixed window
∆η×∆φ= 0.075× 0.125 (corresponding to 3× 5 middle cells) is built around the seed. The choice
of the cluster size is a compromise between electronic noise and shower energy containment. The size alongη is consistent with the Moliere radius of an EM shower in the calorimeter, while the larger size alongφis chosen in order to contain the conversion electrons separated by no more than half a cell while entering the calorimeter. A geometrical projection is then made to the other layers
2011 JINST 6 P04001
of the calorimeter. The total cluster energy is obtained from the sum of the energy deposits in each layer of the cluster. For the analysis reported here, no cluster energy corrections were applied in contrast to [4] and [10].4.4 Event selection
After the reconstruction of tracks and clusters, events can then be selected by exploiting their char-acteristics. The selected events fall into two complementary categories according to the aim of the final analysis. The first category includes events with two well separated clusters of size η×φ
= 3×5 in the LAr calorimeter. One cluster corresponds to the photon with an approximate en-ergy of 60 GeV (converted or unconverted) and the other to the primary positron with enen-ergy ≃ 120 GeV. The second category involves events with 3 clusters corresponding to the well separated e+e− conversion pair and the high energy positron. Further event selection involves examining the characteristics of the reconstructed TRT track segments. Those produced by electrons from photon conversions tend to cluster closer to the central region along the vertical direction of the TRT volume. In contrast to conversions, the original positron having been deflected upwards in order to avoid the silicon tracker, will reach the TRT detector at a much higher position. TRT track segments that point towards the center of the silicon tracker when extrapolated backwards, should therefore belong to converted photons, whereas the ones pointing higher missing the silicon tracker altogether, should be due to the original positron. Figure5shows the distributions of the vertical y-positions after a straight line extrapolation to the center of curvature of the TRT barrel wedge of the observed TRT track segments located downstream of the last silicon tracker layer outside the MBPSID magnet. The charge can be defined by looking at the segment slopes during the extrap-olation and the positively charged tracks are plotted separately in the same figure. As expected, the TRT track segments due to the original positron are indeed characterized by higher vertical displacements. Events for both analysis categories can therefore be selected by requiring the tracks from the photon conversions to be closer to the TRT central vertical region as figure5suggests. The larger separation of the converted photon tracks in the simulation plot (left) as compared to that in the data is largely due to the TRT detector misplacement along the beam line (x-axis) with respect to the silicon sub-systems in the tracker. This is primarily due to the fact that the TRT was outside the tracker magnetic field making it thus difficult to identify shifts along the beam axis. The larger num-ber of tracks on the data side characterized by large positive displacements from the TRT central vertical region as compared to the simulation, is due to the fact that the original positron traverses in reality a larger amount of material upstream of the tracker than that introduced in the simula-tion. This results in larger track activity, due for example to secondary tracks from electromagnetic showers. This discrepancy does not in any way affect the converted photon analysis presented in section 6. To ensure an even cleaner photon sample selection, an additional requirement is that there be no tracks outside the central TRT region. These stringent selection criteria do not exclude the possibility of very asymmetric conversions where the electron/positron with the lower energy is swept out of the TRT detector acceptance. From simulation studies it is expected that these events account for less than 0.4% in the overall selected sample; thus rendering their impact negligible.
The events in the first category are used for the the measurement of the small difference in the calorimeter response expected between converted and unconverted photon energy depositions. This procedure is described in detail in section5. The events in the second category are used to study
2011 JINST 6 P04001
Figure 5. Extrapolated y-position of the TRT track segments at the center of the TRT barrel wedge for sim-ulated (left) and real data (right). TRT track segments due to the original positron are clearly characterized by higher vertical displacements.the reconstruction of converted photons in the first tracker layers (pixels) with the main goal of estimating the amount of material in front of the calorimeter. This is presented in detail in section6. 5 Comparison of calorimeter response for converted and unconverted photons The main goal of the analysis presented in this section is to study the differences of the calori-metric response to photons that have not converted inside or before the TRT, to photons that have converted. Differences are expected in the presampler and the three layers of the calorimeter due to the early commencement of the shower in the case of a conversion. In addition, the total energy (the sum of the energy in the four LAr compartments) is also expected to exhibit a difference. This difference is not only due to the additional energy loss in the upstream material in the case of a conversion, but also due to the drop of the effective sampling fraction in the calorimeter as a result of the early showering [10].
These variations in calorimetric response between converted and unconverted photons reported here, and their subsequent agreement with MC, support the use of distinct calibrations for electrons and photons applied in ATLAS.
5.1 Single photon cluster selection
In this work results from photon runs in the first category with two clusters and B-field on are presented. These runs provide a particular topology for most events as can be seen in the schematic of figure 6. In order to proceed with the study, events with the separation shown in figure6 are selected. The selection criteria imposed in this work are described in table4.
5.2 Calorimeter response to photons contained within a single cluster
The presence of material upstream of the LAr calorimeter complicates the photon reconstruction since a 25% of the photons convert before reaching the cryostat. The CTB provides us with the opportunity to study the response of the LAr calorimeter with the presence of magnetic field in the
2011 JINST 6 P04001
Table 4. Selection criteria for Data and MC for photon runs with the magnetic field on.Run B6=0
Photon Positron
Cluster-η 0.538 <η< 0.542 0.455 <η< 0.46
Cluster-φ 0.001 <φ< 0.01 0.07 <φ< 0.085
No. of cells 79 79
Figure 6. Expected topology in the(η×φ) plane of energy deposits from the beam positron and the radiated photon in the middle layer of the EM Calorimeter.
silicon tracker region. For the final analysis the separation between converted and unconverted pho-tons is performed using the TRT. For the identification of converted phopho-tons the following selection is applied:
• At least one TRT track in the photon path.
• One TRT track in the primary positron path or number of high level (HL) charge threshold
hits in the TRT greater than zero. This cut is necessary in order to ’tag’ the positron.
• No TRT tracks outside the photon/positron paths.
For the identification of unconverted photons the following selection is applied:
• No TRT tracks in the photon path. • No HL hits in the photon path.
• At least one TRT track in the primary positron path or number of HL hits greater than zero.
The efficiency of the TRT-based selection was confirmed by performing a simulation and compar-ing the calorimetric distributions of true converted and unconverted photons with the correspondcompar-ing
2011 JINST 6 P04001
Figure 7. Total energy deposited in each compartment of the calorimeter for data and Monte Carlo for unconverted photons for a run with the magnetic field on.
distributions obtained when the TRT was used for the tagging. The comparison showed that the TRT can separate the two photon populations very efficiently (99.5% of the converted photons are tagged by the TRT) thus effectively removing any systematic effect coming from the TRT tagging. Figures7and8show the four layer energy distributions for data (bullets) and MC (histograms) for unconverted and converted photons respectively. The observed agreement between the data and the Monte-Carlo for both samples indicates an accurate description of the material by the simula-tion.
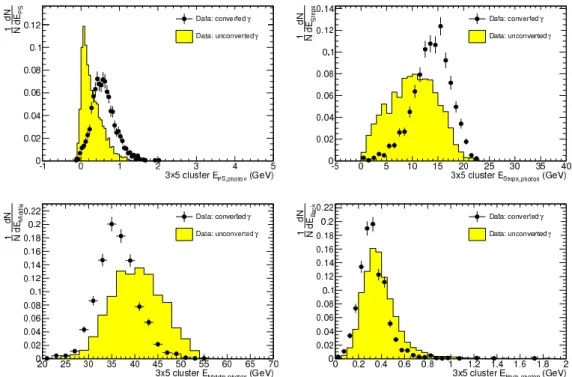
Figure9compares directly for the data the layer energy distributions for converted and un-converted photons. A clear discrimination in the longitudinal shower development is observed: photons which convert before the beginning of the TRT develop an earlier shower, thus depositing more energy in the presampler and strip layer of the calorimeter.
In figure10 the sum of the energies of the four layers of the positron and photon clusters (i.e. the total cluster energy) is presented for converted and unconverted photons. Given that the positrons remain unaffected by the conversion/no-conversion separation, the shift in the energy measured in the calorimeter can be seen either in the photon total energy distribution or in the total combined photon and positron energy (see figure10).
The differences between converted and unconverted photons in the total cluster energy, de-fined here as the sum of the raw energies of all cells in the cluster, can be expressed in terms of a
2011 JINST 6 P04001
Figure 8. Total energy deposited in each compartment of the calorimeter for data and Monte Carlo for converted photons for a run with the magnetic field on.
Table 5. Photon energy scale shift measurement obtained from the total positron-photon energy, and the photon energy alone, for runs with the magnetic field on.
R: fractional energy shift for converted vs unconverted photons
Method Data MC
B6=0, Eγ+Ee+ 1.45±0.14 (stat) ± 0.15 (sys) % 1.54±0.09 (stat) %
B6=0, Eγ 1.16±0.22 (stat) ± 0.15 (sys) % 1.39±0.26 (stat) %
fractional difference R as follows:
R=ETot,Unconvertedγ− ETot,Convertedγ
EUnconvertedγ . (5.1)
The ratio R is a useful measure of how well the MC describes the data. This is shown in table5
using two methods. The first method uses the sum of the energy of the two clusters for the two types of events, and attributes the measured energy difference to the energy difference between converted and uncoverted photons. The second method uses only the energy of the photon cluster. A problem with the latter is that although the initial beam energy is fixed, the photon cluster energy is not monochromatic leading to difficulties in the fitting procedure. This is reflected in the larger statistical uncertainty systematic, dominated by uncertainties in the fit. In the data a fractional shift of 1–1.5% is observed consistent with the prediction of the MC simulation.
2011 JINST 6 P04001
Figure 9. Energy distributions in the four layers of the calorimeter for a data run with the magnetic field on. The separation between converted (bullets) and unconverted (histogram) photons using the TRT is shown. A clear discrimination in the longitudinal shower development is observed: photons which convert up to the TRT develop an earlier shower, thus depositing more energy in the presampler and first sampling of the calorimeter, and less energy in the middle and back samplings.
5.3 Systematic uncertainties on the fractional energy difference
A comprehensive list of the systematic uncertainties is given below along with their calculation method and their values. Variations of analysis cuts and correction factors have been applied in order to get an estimate of the uncertainties. Their effect on the energy scale difference has also been computed and tabulated. The effect of uncertainties in the amount of material upstream of the calorimeter has also been studied. The most important sources of systematic uncertainties are:
• Beam absolute energy scale: The nominal positron beam energy in the region of 180 GeV
has an uncertainty of 0.5-0.7% [4]. To test possible systematic effects of this uncertainty the incident positron energy scale was varied by ±1%. The overall effect on the ratio R is less than 0.05% since this uncertainty affects both samples in the same way.
• Presampler uncertainty (MC only): Uncertainties in the knowledge of the absolute energy
response in the presampler are of order 6% and may also affect the ratio R. A conservative 10% variation of the presampler energy response in the MC results in a 0.1% uncertainty on the ratio R.
• Cross-talk effects in the LAr calorimeter: They are measured by pulsing cells and measuring
2011 JINST 6 P04001
Figure 10. Top: the combined positron and photon cluster energy distribution for converted (bullets) and unconverted (histogram) photons for Data (left graph) and MC (right graph) for a magnetic field on run. The obtained difference in the photon cluster energy before calibration is 1.45 ± 0.14% for data and 1.54 ± 0.09% for MC. Bottom: photon energy distribution for converted (bullets) and unconverted (histogram) photons for Data (left graph) and MC (right graph) for a magnetic field on run. The obtained difference is 1.16 ± 0.22% for data and 1.39 ± 0.26% for MC consistent with the total energy fractional shifts.
implemented in the MC simulation. The impact of such cross-talk effects to the ratio R can be studied by varying the level of cross-talk in the simulation. The largest effects are due to uncertainties in the inter-strip cross-talk correction which can lead to variations of 1% in the strip layer energy response. The induced systematic uncertainty on the ratio R is less than 0.04%.
• Upstream material: Uncertainties in the knowledge of the amount of material upstream of
the CTB experimental setup may also impact the ratio R. This was studied by running the full analysis after varying the amount of material upstream, from 0 to 20% X0. Even such large a variation did not produce a significant change on the ratio R.
Table6summarizes the systematic uncertainties on the fractional shift R of the cluster energy for converted photons. The total systematic uncertainty is no more than 0.15%.
In summary, the obtained values of the ratio R are in good agreement with MC expectations. The fact that R6=0 is the main reason for providing specific calibrations for electrons, unconverted
and converted photons within the ATLAS electron-photon reconstruction software.