HAL Id: hal-01645481
https://hal.archives-ouvertes.fr/hal-01645481
Submitted on 26 May 2020
HAL is a multi-disciplinary open access
archive for the deposit and dissemination of sci-entific research documents, whether they are pub-lished or not. The documents may come from teaching and research institutions in France or
L’archive ouverte pluridisciplinaire HAL, est destinée au dépôt et à la diffusion de documents scientifiques de niveau recherche, publiés ou non, émanant des établissements d’enseignement et de recherche français ou étrangers, des laboratoires
F. Acerbi, Valérie Guillard, M. Saubanère, C. Guillaume, N. Gontard
To cite this version:
F. Acerbi, Valérie Guillard, M. Saubanère, C. Guillaume, N. Gontard. Modelling CO 2 transfer in foil ripened semi-hard Swiss-type cheese. Journal of Food Engineering, Elsevier, 2018, 222, pp.73 - 83. �10.1016/j.jfoodeng.2017.10.025�. �hal-01645481�
Version postprint
Modelling CO2 transfer in foil ripened semi-hard Swiss-type cheese F. Acerbi, V. Guillard, M. Saubanere, C. Guillaume, N. Gontard PII: S0260-8774(17)30458-2
DOI: 10.1016/j.jfoodeng.2017.10.025
Reference: JFOE 9058
To appear in: Journal of Food Engineering
Received Date: 30 May 2017 Revised Date: 27 October 2017 Accepted Date: 28 October 2017
Please cite this article as: Acerbi, F., Guillard, V., Saubanere, M., Guillaume, C., Gontard, N., Modelling CO2 transfer in foil ripened semi-hard Swiss-type cheese, Journal of Food Engineering (2017), doi: 10.1016/j.jfoodeng.2017.10.025.
This is a PDF file of an unedited manuscript that has been accepted for publication. As a service to our customers we are providing this early version of the manuscript. The manuscript will undergo copyediting, typesetting, and review of the resulting proof before it is published in its final form. Please note that during the production process errors may be discovered which could affect the content, and all legal disclaimers that apply to the journal pertain.
Version postprint
M
AN
US
CR
IP
T
AC
CE
PT
ED
Modelling CO
2transfer in foil ripened cheese with CO
2production
1
Modelling CO
2transfer in foil ripened semi-hard Swiss-type cheese
2
3
F. Acerbia, V. Guillarda*, M. Saubanereb, C. Guillaumea, N. Gontarda
4
a
UMR 1208 IATE Agro-polymer Engineering and Emerging Technologies, Montpellier (France),
5
University of Montpellier, INRA - 2 place Viala - bât. 31, F-34060 Montpellier Cedex 01
6
b
UMR 5253 - Institut Charles Gerhardt, Montpellier (France), Place Eugène Bataillon, 34090 Montpellier
7
* corresponding author: valerie.guillard@umontpellier.fr
8
Version postprint
M
AN
US
CR
IP
T
AC
CE
PT
ED
Abstract
10Eye growth in cheese with intense CO2 production during ripening mainly depends on CO2
11
production and transfer properties. Despite CO2 production and diffusion during ripening of
12
semi-hard Swiss-type cheese eyes in such cheeses are considered as important quality parameters,
13
the research concerning key gas production and transfer in cheese remains widely overlooked. In
14
this study, experimentally assessed CO2 production was coupled with transfer coefficients in a
15
mathematical model in order to predict CO2 gradients formed inside the cheese during ripening.
16
The permeability coefficient of CO2 through the multilayer barrier packaging which wraps the
17
cheese during ripening was also included in the model. The presented model was validated by
18
assessing the CO2 concentration in the cheese and its partial pressure in the packaging headspace.
19
CO2 production rate was found to be the most important input parameter affecting CO2 gradients
20
formed in cheese during ripening whereas the other input parameters (solubility, diffusivity,
21
permeability) had little effect on the total CO2 gradient.
22
23
Keywords: solubility, diffusivity, permeability, CO2, cheese ripening
Version postprint
M
AN
US
CR
IP
T
AC
CE
PT
ED
Nomenclature 25α Level of statistical significance Surface (m2)
Bi Biot number (non-dimensional) Bottom rind position of the cheese C Concentration (kg/m3)
ch Relative to cheese
D Effective diffusivity coefficient of CO2 in cheese (m2 s-1)
exp Experimental values HS Packaging headspace
I Relative to the interface j Relative to a gas specie
k External mass transfer coefficient (m/s)
K Degree in Kelvin, with K = 273.15 + degree in Celsius
KP Gas permeability through the packaging film (cm3 µm-1 m-2 d-1 bar-1) l Cheese thickness (m)
M Molar mass (kg/mol) p Partial pressure (Pa)
Total pressure (atm)
Pe Gas permeability through the packaging film (mol m-1 s-1 Pa-1) PAB Propionic Acid Bacteria
pred Predicted values
PTATN ratio of phosphotungstic acid soluble nitrogen on total nitrogen (g/100g) S or SCO2 Solubility coefficient of CO2 in cheese (mol m
-3
Pa-1 or mmol kg-1 atm-1) or CO2
solubility
SM Salt in moisture ratio (g/100g) t Time (s)
T Temperature (K)
R Universal gas constant: 8.314 (J mol-1 K-1)
CVRMSD Coefficient of variation of the root mean squared deviation V Volume (m3)
x Position in the cheese (m)
y Experimental or predicted variable
µ average
Mass flow (kg s-1)
ν Production rate (kg m-3 s-1)
Version postprint
M
AN
US
CR
IP
T
AC
CE
PT
ED
26Version postprint
M
AN
US
CR
IP
T
AC
CE
PT
ED
1. Introduction
27In food engineering, mathematical modelling of physical mechanisms such as heat or mass
28
transfer was used for many years to simulate and optimize/control operation units such as drying
29
or salting (Bona et al., 2007; Mayor and Sereno, 2004; Payne and Morison, 1999; Santapaola et
30
al., 2013). More recently these models were coupled to biological ones such as Mickaëlis Menten
31
equation that formalize the aerobic respiration (Ho et al., 2011; Guillard et al., 2012), chemical
32
reaction for oxidation (Bacigalupi et al., 2013) or predictive microbiology models in order to
33
better represent the evolution of the packed food during storage (Chaix et al., 2015).
34
This modelling approach coupling equations coming from different disciplinary fields was
35
recently applied to semi-hard Swiss-type cheese in order to model the eyes’ growth during
36
ripening (Laridon, 2014; Laridon et al., 2016). CO2-source in this type of cheese is propionic acid
37
bacteria (PAB) which means that CO2-production rate and amount in such cheese is much higher
38
compared to that of lactic acid bacteria. The ripening of these cheeses includes a step during
39
which cheeses are stored at warm temperature (about 1-2 weeks at 20-25°C) for stimulating the
40
PAB fermentation. During this step, CO2 is intensively produced, leading to the growth of eyes
41
(Fröhlich-Wyder and Bachmann, 2004). Cheeses are often foil ripened and a plastic packaging is
42
used to wrap the cheeses during the whole ripening period for avoiding excessive loss of gaseous
43
compounds. The modelling approach proposed by Laridon (2014) therefore concomitantly took
44
into account mass transfer of gas (CO2 produced by bacteria and responsible of eyes’ growth),
45
production of the CO2 and mechanical constraint imposed to cheese paste by this production.
46
This model was based on experimentally assessed rheological parameters (stress) and CO2
47
production rate in simplified condition, but some input parameters such as CO2 diffusivity and
48
solubility into the cheese were estimated from the literature and assumed constant throughout the
49
cheese paste and the ripening age. The sensitivity analysis performed by these authors revealed
Version postprint
M
AN
US
CR
IP
T
AC
CE
PT
ED
afterwards the higher influence of CO2 production and diffusion parameters compared to the
51
rheological ones in semi-hard cheese (Laridon, 2014).
52
Faced to the importance of CO2 diffusion and CO2 production rate in the ripening of semi-hard
53
Swiss-type cheese, this paper aimed at deepening these two phenomena by coupling them in a
54
mathematical model in order to simulate and predict evolution with time of CO2 gradients in the
55
cheese paste and in the packed cheese (including CO2 permeation through the ripening foil). In
56
this purpose, the aim of this study was to develop and experimentally validate in various
57
conditions, mimicking the ripening conditions of Swiss-type cheese, a mathematical
diffusion-58
reaction model to predict CO2 gradients in packed cheeses during ripening.
59 60
2. Materials and methods
61
2.1 Cheese and packaging
62
Semi-hard cheese blocks of 1 kg were kindly supplied by a cheese company. The cheeses
63
included about 42% w/w moisture and 26.5% w/w fat, with pH varying from 5.50 to 5.70 from
64
14 to 28 days from renneting. The cheeses used for the model validation without CO2 production
65
(same batch) did not include any intentionally added CO2 producing bacteria (PAB and
hetero-66
fermentative lactic acid bacteria or LAB) and was produced from pasteurized milk to avoid any
67
sources of hetero-fermentative LAB or PAB. The cheeses used for the validation with CO2
68
production included PAB (106 CFU ml-1 cheese milk) as main source of CO2 production. They
69
were produced from a second, dedicated batch from pasteurized milk. After brining, all cheeses
70
were packed in a multilayer barrier packaging film made of PE/PVDC/PE. Indicatively, the
71
permeability to CO2 at 19°C equalled 40000 cm3 µm m-2 d-1 bar-1 (Acerbi et al., 2016c). The
72
ripening schedule of all ripened cheeses was as follows: 13°C until 14 days from renneting, 19°C
Version postprint
M
AN
US
CR
IP
T
AC
CE
PT
ED
for 14 days, 2–3 days at 13°C, longer storage at 6°C. The target chemical composition of cheeses
74
used in this study is described in Table 1.
75
Cheese blocks were about 15 to 8 cm square in shape (see Supplementary Material A) and were
76
sampled in their core, orthogonally to the interface exposed to headspace/surrounding atmosphere
77
(Figure 1), at least 3 cm away from side rinds, resulting in a cylinder of 8 cm height and about 2
78
cm of diameter. The sampling region was then cut in thin slices of minimum 0.5 cm of thickness
79
for assessment of chemical composition gradient or CO2 gradient.
80 81 Table 1 82 83 2.2 Chemical analyses 84
The chemical composition (fat, moisture, pH, total nitrogen (TN) and fractions of TN, salt,
85
organic acids) of three cheeses per production was measured, in order to verify that the cheese
86
production was on target. Dry matter and sodium chloride were measured according to the ISO
87
5534 (Anonymous, 2004a) and ISO 5943 (Anonymous, 2006) standards. Total nitrogen (TN),
88
water soluble nitrogen (SN) and phosphotungstic acid soluble nitrogen (PTA-N) were measured
89
using Kjeldahl based methods according to ISO 8968-3 standard (Anonymous, 2004b; Bütikofer
90
et al., 1993). The ratio of PTA-N on TN (g/100g) was considered as a good proteolytic indicator.
91
pH and fat content were characterized according to respectively, FD V04-035 (Anonymous,
92
2009) and NF V04-287 (Anonymous, 2002) French standards. Organics acids were assayed using
93
internal method based on high-performance liquid chromatography.
94
CO2 determination in cheese was carried out with the protocol described in Acerbi et al. (2016b).
95
The protocol included a first step where CO2 was extracted from the cheese sample by immersing
96
it in acidic solution. The extracted CO2 was then scavenged by a soda solution of known
Version postprint
M
AN
US
CR
IP
T
AC
CE
PT
ED
molarity, which was finally titrated with hydrochloric acid. The difference between the initial and
98
final soda molarity related to the moles which reacted with CO2.
99
2.3 Microbiology analyses
100
Propionic acid bacteria were enumerated with a method based on the count of the diluted colonies
101
grown on agar plates enriched mainly with sodium lactate and yeast extract after 1 week of
102
incubation at 30°C. The results were expressed in colony-forming unit per gram of cheese (CFU
103
g-1).
104
2.4 Gas chromatography for headspace analyses
105
The partial pressure of N2, O2 and CO2 was measured (resolution: 0.005%) by injecting 10 µl of
106
headspace of cheese packs inside a micro gas chromatography unit including a thermal
107
conductivity detector (MicroGC 3000, SRA Instruments). Homogeneity of the gas composition
108
was ensured by pumping few millilitres of sample gas inside the micro gas chromatography unit
109
before each measurement. The cheese packs were not kept after the analyses because of the too
110
low amount of headspace volume. Therefore, new cheese packs produced from the same batch
111
were used for each analysis in order to follow the kinetics of headspace composition during
112
ripening. The gas chromatography unit was previously calibrated with gas bottles of known
113
compositions. At least two measurements were carried out per each sample.
114
2.5 Description of the model
115
Evolution of CO2 partial pressures in the foil packed blind cheese during ripening relies on the
116
interplay of four mechanisms: (1) CO2 production due to the activity of microorganisms (PAB),
117
(2) gas transport within the cheese paste, (3) gas transfer at the cheese rind/headspace interface
118
and (4) gas transmission through the packaging film. The four described mechanisms are
119
illustrated in figure 1.
Version postprint
M
AN
US
CR
IP
T
AC
CE
PT
ED
121 Figure 1 122 123 2.5.1 Model assumptions 124The following assumptions were made in the present mono-directional modelling study:
125
-
The composition of the atmosphere surrounding the packed cheese during ripening is126
constant and equals to 78.1% for N2, 20.9% for O2 and 0.03% for CO2 (Widory and
127
Javoy, 2003).
128
-
Temperature in the packed cheese system and surrounding atmosphere is constant,129
without gradients.
130
-
Total pressure of the system is constant and it equals atmospheric pressure (101325 Pa).131
-
The solubilization of N2 inside the cheese was considered negligible compared to CO2,132
because of its lower solubility in water (about 50 times less soluble than CO2 in water at
133
20°C) (Dean, 1999). O2 solubility and diffusivity in the cheese were set to constant values
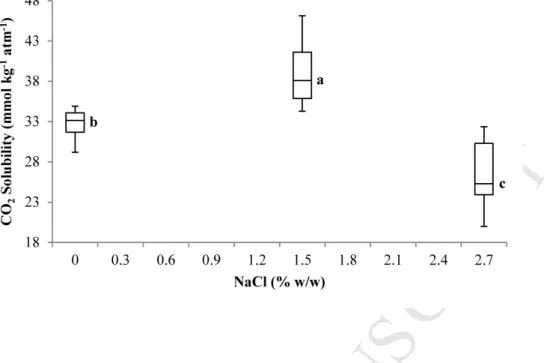
134
of 2.5 10-9 m2 s-1 and 1.3 mmol kg-1 atm-1 respectively and which correspond to solubility
135
and diffusivity of the gas in water at 20°C (Chaix et al., 2014).
136
-
The mechanical resistance to deformation of the cheese packaging is not taken into137
account in the model. Thus, volume changes according to moles content inside the pack
138
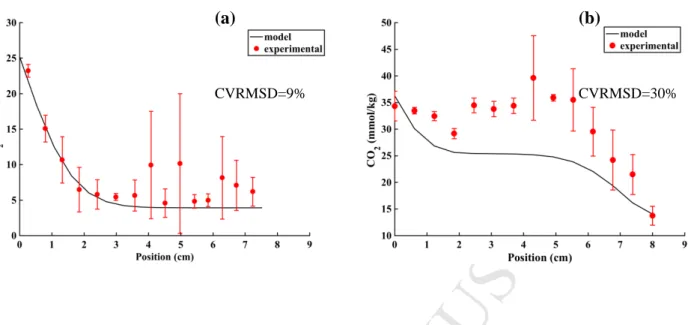
and total pressure of headspace remains equal to external atmospheric pressure.
139
Measuring volume changes during experiment has revealed that they are negligible and
140
that the flexible pouch could easily compensate the small volume change due to its
141
property of elongation.
Version postprint
M
AN
US
CR
IP
T
AC
CE
PT
ED
- For the cheese with salt gradient, the initial NaCl gradient was measured in cheeses
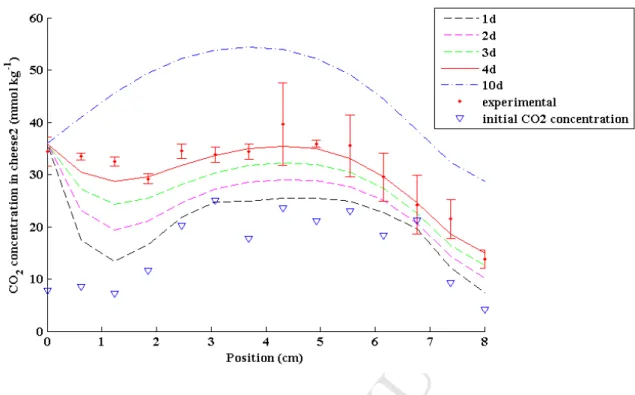
143
produced within the same production day and it was considered to remain constant during
144
the experiment. Same assumption was used to quantify the proteolytic indicator
145
(PTATN).
146
- Gradients in chemical composition in the cheese from its upper rind to its core are
147
symmetric to the gradients from lower rind to the core.
148
2.5.2 Gas balance in headspace
149
The variation of concentration of the gas species in the packaging headspace depends on the
150
mass flow of gas permeating the packaging film from the surrounding atmosphere (kg/s)
151
and the mass flow of the gas species occurring at the interface between the cheese and the
152
headspace .
153
Assuming that the packaging film does not oppose any mechanical resistance to deformation,
154
when the amount of gas species in the headspace varies, the headspace volume (m3) changes,
155
whereas the total pressure in the headspace remains constant and equal to atmospheric
156
pressure (101325 Pa). The global mass balance of species in the headspace can hence be written
157
as follows:
158
+ = + (Eq. 1)
159
where (kg/m3)is theconcentration of the gas in the headspace and is time (s).
160
Assuming that the gas mixture in the headspace obeys the ideal gas law, can be calculated as
161
a pondered sum of the different aforementioned mass flow , as follows:
162 =!" # ( %&'( ) %&'( *&'( + %'( )+'( *'( + %,( *,() (Eq.2) 163
Version postprint
M
AN
US
CR
IP
T
AC
CE
PT
ED
where . is the gas molar mass (kg/mol), R the universal gas constant (J mol-1 K-1) and T the
164
temperature in Kelvin (K).
165
The concentration of the gas in the headspace can be calculated according to (Eq. 3)
166
/0 ∑ ,
*
2{45, 45,65} = = 10: ; (Eq. 3)
167
and similarly, for the partial pressure of the gas in the headspace < (Eq. 4),
168
< = * ! (Eq. 4)
169
2.5.3 Gas permeation through the maturation foil
170
The gas permeation through the packaging film (maturation foil), assuming that the partial
171
pressures in the atmosphere surrounding the cheese are constant, could be conveniently described
172
by the Fick’s first law (steady state regime). Therefore, the mass flow = of gases j (N2, O2, CO2)
173
through the packaging film was calculated according to first Fick’s law (Fick, 1855) as stated in
174
Eq. 5.
175
= . > ?@ A<B − < D (Eq. 5)
176
where > is the permeability coefficient of the gas j through the film (mol m-1 s-1 Pa-1), E= is the
177
thickness of the film (m), = is the film surface (m2) and <Band < are the partial pressure of
178
the gas in the surrounding atmosphere (denoted by symbol ∞) and the packaging headspace,
179
denoted by .
180
2.5.4 Mass flow at the cheese rind/gaseous interface
181
The mass flow at the cheese/rind gaseous interface was calculated as follows (Eq. 6):
182
= G (* ?! )(< , − < ) (Eq. 6)
183
Where G(m/s) is the mass transfer coefficient at the interface between the cheese rind and the
184
headspace and H and < , are the surface at the interface and the partial pressure at the
Version postprint
M
AN
US
CR
IP
T
AC
CE
PT
ED
immediate vicinity of the cheese surface. The mass transfer coefficient Gis calculated according
186
to Eq. 7
187
G =IJ×LM (Eq. 7)
188
Where NO is the non-dimensional Biot number, assumed to be equal to 105 (ratio between
189
diffusivity of CO2 in air and cheese) (Laridon, 2014), P is the diffusivity of CO2 in cheese (about
190
10-10 m2 s-1) and L is the characteristic length of the considered material (length of the cheese
191
equalled about 0.008m).
192
Assuming that the gaseous species in headspace are in thermodynamic equilibrium with the
193
dissolved species at the cheese surface, the concentration of dissolved gas species at the cheese
194
surface QR,STU (kg/m3) relates to < , according to Henry's law:
195
< , = QR,STU
* (Eq. 8)
196
Where is the solubility coefficient of the considered gas (mol m-3 Pa-1).
197
2.5.5 Gas diffusion inside the cheese paste and CO2 production
198
The CO2 diffusion within the cheese paste was represented by making use of Fick’s second law of
199
diffusion for the transient state of diffusion and it was coupled to CO2 production by adding
200
production term ν (kg m-3 s-1) to Fick’s second law, leading to Eq. 9.
201 V&&'(QR VW = P 45 V5&&'(QR VX5 + Y 45 (Eq. 9) 202 Where V&&'(QR
VW is the partial derivative of the concentration of CO2 in the cheese as regard to time,
203
in the direction Z (m). Z represents the distance from the interface of the cheese rind to headspace
204
and the considered position inside the cheese. Z varies from 0 to 8 (cheese thickness in cm). P 45
205
is the effective diffusivity coefficient of CO2 in cheese (m2/s).
Version postprint
M
AN
US
CR
IP
T
AC
CE
PT
ED
The same equation without the production term was used to model O2 diffusion within the cheese
207
paste.
208
2.5.6 Boundary conditions
209
Equality of flows was considered at the interface between the cheese rind and the headspace:
210
P V& QRVX = %? = G (*! )(< , − < ) ; Z = 0 (Eq. 10)
211
where j stands for either CO2 or O2.
212
Since the cheese is pressed on continuous impermeable material during ripening due to gravity,
213
we assumed no diffusion at the cheese bottom rind ( ), (Z = ):
214
P V& QRVX = 0 ; Z = (Eq. 11)
215
Assuming that the food sample was initially in equilibrium with a gas of fixed partial pressure <U
216
(Pa), the initial conditions take the form:
217
QR(Z, 0) = . <U(Z, 0) [ = 0 (Eq. 12) 218
2.5.7 Prediction of model input parameters for different ripening conditions
219
The following empirical equation was used in the model for predicting the changes in CO2
220
production rate, Y 45 (mmol kg-1 d-1) as a function of salt to moisture ratio, SM and temperature,
221
T (Acerbi et al., 2016a):
222
Y 45 = 8.527 + 0.0862 T5 − 1.621 T + 5.367 SM − 0.415 SM T (Eq. 13)
223
SM (g/100g) is calculated as the percentage of the mass ratio between sodium chloride and
224
moisture.
225
The following empirical equation was used in the model for predicting the value of P 45 at
226
different temperatures, 0 salt to moisture ratio, . and 0 0g (ratio of phosphotungstic acid
227
soluble nitrogen on total nitrogen). The latter coefficient is a ripening indicator related to the
Version postprint
M
AN
US
CR
IP
T
AC
CE
PT
ED
proteolytic phenomena (especially amount of free amino acids) which relates to structure changes
229
in the cheese during ripening (Acerbi et al., 2016d).
230
P 45 = (−0.0428 T5 + 1.3689 T − 0.6188 SM + 12.2421 PTATN − 9.6910) × 10lmn 231
(Eq. 14)
232
The value of 45 (in mmol kg-1 atm-1) was calculated by using a modified version of the
233
equation given by Acerbi et al. (2016b):
234
45= 37.35879 − 0.83414 .5+ 4.4619 . − 0.34768 0 (Eq. 15)
235
The modification consisted in the use of a quadratic term for the salt effect instead of a linear
236
term in the view of more recent results (figure 2).
237 238
Figure 2
239 240
The value of permeability (KP) of the gas (O2 CO2, N2) was estimated at different ripening
241
temperatures by interpolating the results of permeability coefficients o given by Acerbi et al.
242
(2016c) in units cm3 µm m-2 d-1 bar-1. The o values were converted into > values (mol m-1 s-1
243
Pa-1) to be used in the model (Eq. 5).
244 o 45 = −108.03 05 + 4551.5 0 − 3242.6 (Eq. 16) 245 o 45 = 386.53 0 + 6313.6 (Eq. 17) 246 o 65= 188.78 0 + 3422 (Eq. 18) 247
2.5.8 Numerical solving and identification procedure
248
This system of equations governing the coupled diffusion and production of gas in the cheese and
249
the gas transfer and permeation in the cheese packaging headspace was solved using a dedicated
250
algorithm “ode15s” developed in Matlab® computing software (The Mathworks Inc., Natick,
Version postprint
M
AN
US
CR
IP
T
AC
CE
PT
ED
Mass, USA) and adapted to stiff systems where each of unknown variables may exhibit radically
252
different variation kinetics. This algorithm adjusted automatically the size of the time step used
253
for numerical integration of the equations. To evaluate goodness of fit between experimental and
254
predicted data, the coefficient of variation of the root mean square deviation (CVRMSD) was
255 calculated as follows: 256 /. P = ( p (qrstuvqtSr)( (,) wtSr ) × 100 (Eq.19) 257
Where ypred and yexp are respectively the experimental and the simulated residual value, N is the
258
number of experimental measurements and μyXz is the average of the experimental values.
259
CVRMSD enables to compare the quality of the model with other models present in literature. A
260
good quantitative model is considered to have CVRSMD ≤ 10%.
261
2.6 Model validation
262
The experimental validation was made in three steps of increasing complexity which are
263
summarized in Table 1.
264
Firstly, the mono-directional CO2 diffusion within the cheese and transfer at the cheese rind
265
interface was validated on an old ripened high salted cheese (namely “old cheese”) with no salt
266
gradient and without CO2 production (no CO2 producing bacteria). The cheese was high salted
267
via brining (about 5% NaCl/dm, salt content on dry matter) in order to avoid possible gas
268
production from unwanted microorganisms in such old cheese. The cheese, apart for its upper
269
rind, was fully covered with a gas impermeable membrane (see Supplementary Material A) and it
270
was housed in a controlled temperature cabinet (set at 19°C) with a continuous flow of wet CO2
271
(gas supposed to be equilibrated at 100% of relative humidity after bubbling in a flask containing
272
pure water at the temperature of the experiment). After 3 days, the CO2 dissolved in different
273
positions (e.g. the sample is sliced parallel to the interface) from the upper rind (x=0) to the
Version postprint
M
AN
US
CR
IP
T
AC
CE
PT
ED
bottom rind (x=8) was assessed with the CO2 determination method described above. Two
275
repetitions were made in order to validate the diffusion phenomenon. For two other repetitions,
276
after 3 days of CO2 sorption, the cheese samples were then kept 3 days in a continuous flow of
277
wet (100% RH) N2 (desorption step). The gradient of dissolved CO2 into the paste after these 3
278
days of desorption was then assayed as previously described for the sorption step (2 repetitions).
279
Secondly the coupling of CO2 diffusion and production was experimentally assessed by using
280
a cheese with PAB and average salt concentration (about 2.5% NaCl/dm, salt on dry matter, in
281
the cheese, namely “young cheese”). This cheese also included a salt gradient due to its younger
282
age (15 days from renneting) when salt is still slowly diffusing from rind to core of the cheese
283
(brined cheese). The same experimental procedure previously described was used, apart for the
284
following: the cheese stayed 1 day at 19°C, before the experiment with the contact of wet CO2
285
from upper rind (x=0) started and it lasted for 4.4 days.
286
The initial CO2 concentration gradient in the cheese was measured just before the experiment
287
started (i.e. about 9.5 weeks from renneting for the first validation step and 15 days from
288
renneting for the second more complex validation step including CO2 production). This initial
289
CO2 gradient is indispensable to parametrize initial conditions in the numerical algorithm.
290
Thirdly, in order to compare the output of gas concentration in the headspace given by the
291
model including permeation phenomenon, gas headspace composition was measured in the
292
headspace of packed cheeses (2 replications). The headspace gas analyses were repeated on
293
different cheeses during ripening (about at 10, 14, 16 ripening days at 19°C).
294 295
In each case of these aforementioned steps, the model was adapted accordingly to experimental
296
conditions: system of Eq. (6) to (15) for the first and second steps - without the production term
Version postprint
M
AN
US
CR
IP
T
AC
CE
PT
ED
299 2.7. Statistics 300Statistical tests were performed by using R software for statistical computing (R, 2014).
301
Comparisons between the chemical compositions were performed by pairwise comparisons using
302
t test with pooled standard deviation. The Holm method for the multiplicity of error was used to
303
adjust the p-value of multiple pairwise comparisons. Different letters were used for denoting
304
significant difference between data sets (level of significance α = 0.05, unless stated).
305 306
3. Results and discussion
307
Our model takes into account experimentally assessed parameters for describing CO2 production
308
and overall transfer in and out a cheese/packaging system during foil ripening. The focus was on
309
the exhaustive description of the gas transport properties in the continuous cheese paste and at its
310
interface with the surrounding atmosphere. We therefore used a model blind cheese (without
311
eyes). We experimentally assessed the following parameters: transport of CO2 in the cheese paste
312
(effective diffusivity), transfer of CO2 at the interface between cheese and headspace (solubility),
313
oxygen, nitrogen and carbon dioxide transmission rate through the maturation foil (permeability)
314
and CO2 production rate from the bacteria. The cited parameters were previously assessed in
315
function of the main ripening variables (different temperatures, ripening time, salt content
316
amongst others) (Acerbi et al., 2016a, 2016b, 2016c, 2016d).
317 318
3.1 Compositional analyses
319
The chemical composition of the cheese without PAB (old cheese – data not shown) was not
320
significantly different (α=0.05) as a function of the position in the cheese, whereas a relevant
321
gradient in PTATN (ratio of phosphotungstic acid soluble nitrogen on total nitrogen) and SM
Version postprint
M
AN
US
CR
IP
T
AC
CE
PT
ED
(salt in moisture ratio) was confirmed from analyses made on cheese with PAB analysed at 15
323
and 20 days from renneting (figure 3).
324
Although the transfer properties of nitrogen components (PTATN) and salt were not
325
experimentally assessed within this study and not included in the model, the initial heterogeneous
326
composition was considered and a linear interpolation was used for predicting the initial
327
composition in all positions of the cheese including PAB. The composition in the position 4 to 8
328
cm was considered symmetrical to the position 0 to 4 cm.
329 330
Figure 3
331 332
A relevant gradient in organic acid concentration was found in the cheese with PAB both at 15
333
and 20 days from renneting (figure 4). No propionate and acetate was found in the outer rind (0
334
cm) at 15 days from renneting. The observed delay in PAB fermentation in the outer part of the
335
cheese was probably due to the negative effect of high salt to moisture ratio on the bacteria cells
336
(Guinee, 2004) and it was already demonstrated by Huc et al. (2014) in similar cheeses. The
337
molar ratio between propionate and acetate in the core of the cheese equalled about 2. The ratio
338
of 2 is obtained if PAB convert lactate exclusively via the Fitz pathway (Fröhlich-Wyder and
339
Bachmann, 2004; Piveteau, 1999; Fedio et al., 1994). We can therefore confirm that, in the
340
studied cheese, PAB fermented lactate primarily via the Fitz pathway and that probably no other
341
metabolic activity (producing acetate) occurred.
342 343
Figure 4
344 345
Version postprint
M
AN
US
CR
IP
T
AC
CE
PT
ED
The pH of the cheese was measured because pH changes may affect both the solubility of carbon
346
dioxide dissolved in the water phase of the cheese (Chaix et al., 2014) and its diffusivity
347
coefficient due to a different organisation of the casein matrix structure (Lawrence et al., 1987).
348
The pH in the studied cheese did not relevantly vary in the considered experimental time (figure
349
5a).
350
The enumeration of PAB cells confirmed the higher metabolic activity observed in the core of the
351 cheese (figure 5b). 352 353 Figure 5 354 355 3.2 Initial CO2 concentration 356
The initial CO2 concentration in different positions (from upper to bottom rind) of the cheese was
357
measured in 2 to 3 cheeses produced within the same production batch. Whereas the CO2
358
distribution was low and rather homogeneous for the old ripened cheese with no intentionally
359
added CO2 producing bacteria (figure 6a, 3 repetitions), the initial CO2 gradient was relevant in
360
the cheese with PAB (figure 6b, 2 repetitions). The low and homogeneous initial CO2
361
concentration observed in the older cheese was expected because this cheese did not contain
362
intentionally added CO2 producing bacteria, while the CO2 gradient observed in the cheese with
363
PAB at 15 days from renneting (14 days at 13°C and 1 days at 19°C) reflected the effect of salt
364
gradient on PAB. There is an inhibition of PAB growth (Figure 5b) by the higher salt content
365
close to the rinds with a consequently lower production of CO2 and propionic acid close to the
366
rinds compare to the core of the product leading to this “bell like curve” for initial CO2 gradient
367
in salted cheese with PAB. This evolution of salt content that is spatially-dependant, due to
368
diffusion of salt from the periphery towards the centre of cheeses, has been found in previous
Version postprint
M
AN
US
CR
IP
T
AC
CE
PT
ED
studies (Huc et al., 2014; Guinee, 2004; Hollywood & Doelle, 1984) and before by Mocquot
370
(1979), Geurts et al. (1974, 1980) and Pauchard et al. (1980). Therefore, the median value for
371
initial CO2 concentration was used (4 mmol/kg) for the model validated for the cheese without
372
PAB and the real gradient was used as input vector for initial CO2 concentration for the cheese
373 with PAB. 374 375 Figure 6 376 377
3.3. Investigating effect of salt content on CO2 solubility
378
Prior model validation, additional points of solubility of CO2 within the cheese paste were
379
measured to complete the work of Acerbi et al. (2016b) and obtain more precise 45 prediction
380
(eq. 15). According to these new values (Figure 2), 45 increased with light NaCl content, while
381
it decreased at very high NaCl content, following a similar behaviour compared to salting in and
382
salting out effect of protein. This phenomenon was ascribed to the possibly higher sorption of
383
CO2 in highly hydrated protein during salting in phase (Guinee, 2004), while the overall 45
384
would decrease due to lower level of protein hydration at high salt concentration (salting out).
385
Guinee (2004) suggested that salting out effect of protein in cheese (Mozzarella) may take place
386
for salt to moisture ratio (S/M) higher than 6.3% w/w, which is close to the highest salt level
387
investigated in Figure 2 (about 6.7% S/M).
388
3.4 Model validation
389
The simplest model form describing CO2 diffusion inside the cheese paste (without PAB and CO2
390
production) and the transfer at the cheese rind/gaseous interface (100% CO2) was successfully
391
validated because the difference between predicted and experimental data was below 10% (figure
Version postprint
M
AN
US
CR
IP
T
AC
CE
PT
ED
7a). Same good validation with a 100% N2 flux at the cheese rind surface was obtained
393
(CVRMSD < 8%) (see Supplementary Material B).
394
When increasing the complexity of the model, including CO2 production rate and considering a
395
cheese with salt gradient, the observed error between experimental and predicted data was found
396
higher (30%) (figure 7b). In the latter more complex model, the predicted line was generally
397
underestimating the experimental gradient, leading to a high CVRMSD. The lack of fit of the
398
more complex model could be due to (1) the adoption of a mono-directional model which may
399
not be fully appropriate for diffusion in cheeses with gas production and/or (2) underestimations
400
in either the prediction of CO2 production rate and/or in the initial CO2 concentration gradient.
401
Underestimation of the CO2 production rate may be due to the linear approximation used by
402
Acerbi et al. (2016a) to describe the effect of salt content. Indeed, lower salt contents were
403
investigated in the previous work, which provided the predictive equation for CO2 production
404
rate, compared to the current study. Therefore, effect of high SM ratio is probably not well
405
predicted by Eq.13 which was never validated for such SM ratio. This underestimation may be
406
overcome by carrying out more experimental measurements of CO2 production rate at higher salt
407
content. A possible underestimation of the initial CO2 concentration gradient in the cheese may
408
be ascribed to natural deviations in metabolic activity of the PAB in different cheeses produced
409
from the same batch. Both hypotheses were confirmed by simulating a 1.7 folds higher CO2
410
production rate (figure 8) and then, a 2 folds higher initial CO2 concentration (figure 9). In both
411
cases, the predicted curve fit very well the experimental data.
412 413 Figure 7 414 415 Figure 8 416
Version postprint
M
AN
US
CR
IP
T
AC
CE
PT
ED
417 Figure 9 418 419Then, the full model considering permeation through ripening foil in addition to
420
solubilisation/diffusion and production of CO2 within the food was then used to predict the CO2
421
partial pressure in headspace. A third set of experiments conducted on cheeses packed in ripening
422
foils were conducted in the objective to validate it. Experimental difficulties arose because gas
423
headspace analysis could not be assessed continuously in the pack (because of too high gas
424
volume injected) therefore only a few experimental points have been collected (See
425
supplementary material C). However, it has been noted that the model tended to underestimate
426
the headspace partial pressure when CO2 production occurs (in cheese with PAB). But, once
427
again, considering a 1.7 fold higher CO2 production rate, the prediction fitted better the
428
experimental data. A better fit may also be obtained by reducing the value for CO2 permeability
429
of the packaging or increasing the initial CO2 concentration gradient (results not shown). But this
430
hypothesis does not sound well founded and therefore was not applied. The permeability values
431
were especially assessed in the conditions encountered in the present work and were therefore
432
considered relevant.
433
3.5 Exploratory analysis of model simulations
434
Simulations were carried by considering the min and max values of 4 parameters in their range of
435
variation (table 2): CO2 solubility (figure 10a), diffusivity (figure 10b), permeability (figure 10c)
436
and production coefficients (figure 10d). During the simulation, only one of the mentioned input
437
parameters was varied from the lowest to the highest value described in Table 2. The boundary
Version postprint
M
AN
US
CR
IP
T
AC
CE
PT
ED
conditions used during these simulations included that the packed cheese was in contact with the
439
atmosphere (20.9% O2, 0.03% CO2, 78.1% N2) from one rind (upper rind) and in contact with a
440
non-permeable support from the below rind (shelf). The range of values for solubility and
441
diffusivity was chosen in agreement with the min and max observed in the experimental
442
campaign described by Acerbi et al. (2016b, 2016d). The values for permeability were decided to
443
vary of factor 10 of the predicted value of Equation 16, 17, 18. The value of production rate was
444
decided to vary of 4 units compared to the predicted value of equation 13, because it was
445
considered a realistic variation for the different salt contents observed in different positions of the
446 studied cheese at 19°C. 447 448 Table 2 449 450
The other input parameters were kept fixed (medium value) as respect of their position. This
451
simplified sensitivity analysis had the goal of highlighting which input parameter had the
452
strongest effect on the output (CO2 gradients formed in cheese). Logically, changing SCO2 led to
453
light differences in CO2 concentration only close to the gaseous interface (figure 10a) because
454
this parameter only intervenes in the boundary condition at cheese/headspace interface: the lower
455
the solubility, the lower the CO2 content at the interface. Changing DCO2 slightly affected the
456
shape of the CO2 gradient close to the cheese rinds, probably because these positions were
457
characterized by lower υCO2 due to the higher salt content (figure 10b) and it affected the overall
458
shape of the curve. υCO2 showed the highest effect on the CO2 gradients, from -10 to +20
459
mmol/kg of difference for the lowest and highest υCO2 respectively compared to the median value
460
in the core of the cheese. Concerning the effect of different permeability, the lower the gas
Version postprint
M
AN
US
CR
IP
T
AC
CE
PT
ED
permeability of the packaging, the higher was the CO2 concentration at the cheese rind, but the
462
overall change in CO2 gradient due to different permeability was negligible.
463 464
Figure 10
465 466
This paper presents an unprecedented modelling approach that successfully describes the
467
mechanisms of CO2 diffusion, solubilisation and production by Swiss-type cheese with intensive
468
PAB-based CO2 production and also CO2 permeation through the ripening foil. All mechanisms
469
were dynamically coupled and experimentally validated permitting to achieve the initial objective
470
of this paper which was to predict evolution with time of CO2 gradients into the packed cheese.
471
The developed model is the most complete one compare to precedent similar approach of the
472
literature. For instance, the one of Jakobsen and Risbo, (2009), developed for prediction, among
473
others, of the changes in solubilised carbon dioxide in semi-hard cheese packed in modified
474
atmosphere packaging, neglected all mechanisms of CO2 diffusion and production in their
475
approach.
476
This model could be further used to predict CO2 gradients into blind cheese or, once coupled with
477
a mechanical model of bubble growth such as the one proposed by Laridon et al., (2014), could
478
be used to predict eye growth in Swiss type cheese and then pilot the ripening step.
479 480
4. Conclusion
481
We presented the first experimentally validated model which couples the phenomena of CO2
482
production, solubilisation/diffusion and permeation in a packed cheese system for predicting the
483
CO2 gradients formed in the cheese during ripening. A three steps validation procedure enabled
Version postprint
M
AN
US
CR
IP
T
AC
CE
PT
ED
without CO2 production by PAB and including the phenomena of CO2 diffusion in the cheese
486
paste and transfer at the gaseous interface. The model was able to describe the shape of the CO2
487
gradient formed in the cheese with, nevertheless, less precision when CO2 production happens.
488
This term was probably less accurately characterized for the conditions used in this paper and
489
induces less performant prediction. A simplified sensitivity analysis highlighted CO2 production
490
as the most important input parameter affecting the CO2 gradients formed in cheese during
491
ripening. Results presented in this paper represent a solid basis for the description of the most
492
important phenomena affecting the quality of cheese with intense CO2 production during
493
ripening.
Version postprint
M
AN
US
CR
IP
T
AC
CE
PT
ED
References
495Anonymous 2004a. ISO 5534. Cheese and processed cheese -- Determination of the total solids content 496
(Reference method). International Organization for Standardization, Geneva 497
Anonymous 2004b. ISO 8968-3. Milk -- Determination of nitrogen content -- Part 3: Block-digestion 498
method (Semi-micro rapid routine method). International Organization for Standardization, Geneva 499
Anonymous 2006. ISO 5943. Cheese and processed cheese products -- Determination of chloride content 500
-- Potentiometric titration method. International Organization for Standardization, Geneva 501
Anonymous 2009. FD V04-035. Lait et produits laitiers - Détermination du pH. Afnor, France 502
Anonymous 2002. NF V04-287. Fromages - Détermination de la teneur en matière grasse - Méthode 503
acido-butyrométrique, Afnor, France 504
Acerbi, F., Guillard, V., Aliani, M., Guillaume, C., Gontard, N., 2016a. Impact of salt concentration, 505
ripening temperature and ripening time on CO2 production of semi-hard cheese with propionic acid 506
fermentation. J. Food Eng. 177, 7279. doi:http://dx.doi.org/10/2016/j/jfoodeng.2015.12.022 507
Acerbi, F., Guillard, V., Guillaume, C., Gontard, N., 2016b. Impact of selected composition and ripening 508
conditions on CO2 solubility in semi-hard cheese. Food Chem. 192, 805–812. 509
doi:10.1016/j.foodchem.2015.07.049 510
Acerbi, F., Guillard, V., Guillaume, C., Gontard, N., 2016c. Assessment of gas permeability of the whole 511
packaging system mimicking industrial conditions. Food Packag. Shelf Life 8, 81–85. 512
doi:https://doi.org/10.1016/j.fpsl.2016.04.003 513
Acerbi, F., Guillard, V., Guillaume, C., Saubanere, M., Gontard, N., 2016d. An appraisal of the impact of 514
compositional and ripening parameters on CO2 diffusivity in semi-hard cheese. Food Chem. 194, 515
1172–1179. doi:10.1016/j.foodchem.2015.08.020 516
Bacigalupi, C., Lemaistre, Marie Hélène Peyron, S., Guillard, V., Chalier, P., 2013. Changes in nutritional 517
and sensory properties of orange juice packed in PET bottles: an experimental and modelling 518
Version postprint
M
AN
US
CR
IP
T
AC
CE
PT
ED
approach. Food Chem. 141, 3827–3836. 519
Bona, E., Silva, R. S. S. F. d., Borsato, D., Silva, L. H. M., & Fidelis, D. A. d. S. (2007). Multicomponent 520
diffusion modeling and simulation in prato cheese salting using brine at rest: The finite element 521
method approach. Journal of Food Engineering, 79(3), 771-778. 522
doi:10.1016/j.jfoodeng.2006.02.041 523
Bütikofer, U., Ruegg, M., Ardo, Y., 1993. Determination of nitrogen fractions in cheese: evaluation of a 524
collaborative study. Food Sci. Technol. - Leb. - Wiss. Technol. doi:10.1006/fstl.1993.1056 525
Chaix, E., Couvert, O., Guillaume, C., Gontard, N., & Guillard, V. (2015). Predictive Microbiology Coupled 526
with Gas (O2/CO2) Transfer in Food/Packaging Systems: How to Develop an Efficient Decision 527
Support Tool for Food Packaging Dimensioning. Comprehensive Reviews in Food Science and 528
Food Safety, 14(1), 1-21. doi:10.1111/1541-4337.12117 529
Chaix, E., Guillaume, C., & Guillard, V. (2014). Oxygen and Carbon Dioxide Solubility and Diffusivity in 530
Solid Food Matrices: A Review of Past and Current Knowledge. Comprehensive Reviews in Food 531
Science and Food Safety, 13(3), 261-286. doi:10.1111/1541-4337.12058 532
Dean, J. A. (1999). Physical Properties. Solubilities of gases in water. In J. A. Dean (Ed.), Lange's Handbook 533
of Chemistry (15 ed., pp. 375-380): McGraw-Hill Inc. 534
Fedio WM, Ozimek L, Wolfe FH. 1994. Gas production during the storage of Swiss cheese. 535
Milchwissenschaft-Milk Science International 49(1):3-8. 536
Fick, A., 1855. On liquid diffusion. J. Memb. Sci. 100, 33–38.
537 538
Fröhlich-Wyder MT, Bachmann HP. 2004. Cheeses with propionic acid fermentation. In: Fox PF, 539
McSweeney PLH, Cogan TM, Guinee TP, editors. Cheese: Chemistry, Physics and Microbiology. 3 540
ed. London: Elsevier Academic Press. p. 141-156. 541
Geurts, T. J., Walstra, P., & Mulder, H. (1974). Transport of salt and water during salting of cheese. 1. 542
Analysis of the processes involved. Netherlands Milk and Dairy Journal, 28,102-129. 543
Version postprint
M
AN
US
CR
IP
T
AC
CE
PT
ED
Geurts, T. J., Walstra, P., & Mulder, H. (1980). Transport of salt and water during salting of cheese. 2. 544
Quantities of salt taken up of moisture lost. Netherlands Milk and Dairy Journal, 34, 229-254. 545
Guillard, V., Guillaume, C., Destercke, S., 2012. Parameter uncertainties and error propagation in 546
modified atmosphere packaging modelling. Postharvest Biol. Technol. 67, 154–166. 547
doi:10.1016/j.postharvbio.2011.12.014 548
Guinee, T. P. (2004). Salting and the role of salt in cheese. International Journal of Dairy Technology, 549
57(2-3), 99-109. 550
Ho, Q. T., Verboven, P., Verlinden, B. E., Herremans, E., Wevers, M., Carmeliet, J., & Nicolaï, B. M. (2011). 551
A Three-Dimensional Multiscale Model for Gas Exchange in Fruit. Plant Physiology, 155(3), 1158-552
1168. 553
Hollywood, N.W., & Doelle, H.W. (1984). The effect of sampling position and age on levels of 554
propionibacteria and flavor-related compounds in Swiss-type cheese. Australian Journal of Dairy 555
Technology, 39,80-82. 556
Huc, D., Roland, N., Grenier, D., Challois, S., Michon, C., & Mariette, F. (2014). Influence of salt content 557
on eye growth in semi-hard cheeses studied using magnetic resonance imaging and CO2 558
production measurements. International Dairy Journal, 35(2), 157-165. 559
doi:http://dx.doi.org/10.1016/j.idairyj.2013.11.010 560
Jakobsen, M. & Risbo, J., (2009). Carbon dioxide equilibrium between product and gas phase of modified 561
atmosphere packaging systems: Exemplified by semihard cheese. Journal of Food Engineering. 562
92, 285–290. 563
564 565
Version postprint
M
AN
US
CR
IP
T
AC
CE
PT
ED
Laridon Y., Grenier D., Houeix D., Doursat C., Lucas T., & Flick, D. (2016). Modelling of the growth of a 566
single bubble in semi-hard cheese, with experimental verification and sensitivity analysis. Applied 567
Mathematical Modelling, 40 (23-24), 1339-1351. 568
Laridon Y. (2014). Modelling and visualization of a bubble growth in an evolutive, heterogeneous 569
medium. Mechanics [physics]. University of Rennes 1. English. NNT : 2014REN1S091 570
Lawrence R. C., Creamer, L. K., & Gilles, J. (1987). Texture Development During Cheese Ripening. Journal 571
of Dairy Science, 70(8), 1748-1760. 572
Mayor, L., & Sereno, A. M. (2004). Modelling shrinkage during convective drying of food materials: a 573
review. Journal of Food Engineering, 61(3), 373-386. doi:http://dx.doi.org/10.1016/S0260-574
8774(03)00144-4 575
Mocquot, B.Y.G., 1979. Reviews of the progress of Dairy Science : Swiss-type cheese. J. Dairy Res. 46, 576
133–160. 577
Payne, M. R., & Morison, K. R. (1999). A multi-component approach to salt and water diffusion in cheese. 578
International Dairy Journal, 9(12), 887-894. doi:http://dx.doi.org/10.1016/S0958-579
6946(99)00157-0 580
Pauchard, J.P., Flückiger, E., Bosset, J.O., Blanc, B., 1980. CO2 Löslichkeit, Konzentration bei Entstehung 581
der Löcher und Verteilung in Emmentalerkäse. Schweizerische Milchwirtsch. Forsch. 9, 69–73. 582
Piveteau, P., (1999). Metabolism of lactate and sugars by dairy propionibacteria: A review. Lait 79, 23– 583
41. 584
R. (2014). R: A language and environment for statistical computing. Vienna, Austria. Retrieved from 585
<http://www.R-project.org/>. 586
Santapaola, J., Maldonado, S., & Medina, J. L. (2013). NaCl diffusion kinetics in dry salting of goat cheese. 587
Journal of Food Engineering, 118(2), 172-177. 588
doi:http://dx.doi.org/10.1016/j.jfoodeng.2013.03.028 589
Version postprint
M
AN
US
CR
IP
T
AC
CE
PT
ED
Widory, D., Javoy, M., 2003. The carbon isotope composition of atmospheric CO2 in Paris. Earth Planet. 590
Sci. Lett. 215, 289–298. doi:10.1016/S0012-821X(03)00397-2 591
Version postprint
M
AN
US
CR
IP
T
AC
CE
PT
ED
considered (mono-directional transfer through the headspace/cheese interface, br =cheese
bottom-rind)
Figure 2. CO2 solubility in semi-hard Swiss-type cheese as a function of salt content at 13°C.
The point at intermediate NaCl content (1.5% w/w) is added to the ones reported by Acerbi et
al. (2016b) and it was measured with same protocol on the same cheese. Different letters a, b
c, …denote significant difference for α = 0.05.
Figure 3. (a) PTATN - ratio of phosphotungstic acid soluble nitrogen on total nitrogen and (b)
SM - salt in moisture ratio- in different positions of the of the semi-hard Swiss-type cheese
with PAB, from rind (0 cm) to core (4 cm) at 15 and 20 days from renneting, representing
starting time and ending time of the validation experiment.
Figure 4. Propionate (a) and acetate (b) concentrations in different positions of the semi-hard
Swiss-type cheese with PAB at 15 and 20 days from renneting (young cheese).
Figure 5. pH and PAB count in different positions of the semi-hard Swiss-type cheese with
PAB at 15 and 20 days from renneting.
Figure 6. Median values for initial CO2 concentration measured in 9.5 weeks after renneting
for old semi-hard Swiss-type cheese without PAB (a) and in 2 weeks after renneting for
young semi-hard Swiss-type cheese with PAB (b). Horizontal and vertical error bars represent
cheese position used and min and max values for assessed CO2 respectively.
Figure 7. Experimental (red dots) and predicted (solid line) CO2 concentration in the
semi-hard cheese without PAB (a) and with PAB (b) CO2 production after about 4 ripening days at
19°C. Root mean squared error (CVRMSD) is indicated on each figure. Error bars in
experimental data represent standard deviations.
Figure 8. Predicted CO2 gradients in cheese (solid lines) after 1, 2, 3, 4 and 10 days of contact
Version postprint
M
AN
US
CR
IP
T
AC
CE
PT
ED
days of contact.Figure 9. Predicted CO2 gradients in cheese (solid or dotted lines) after 1, 2, 3, 4 and 10 days
of contact with 100% CO2, calculated considering 2 folds higher initial CO2 gradient (19°C).
Red solid line and red error bars correspond to predicted and experimental CO2 gradient after
4 days of contact.
Figure 10. Effect of the intensity (low, medium and high, as stated in Table 2, in black, blue
and red respectively) of the input parameter CO2 solubility (a), diffusivity (b) permeability (c)
and production rate (d) on the predicted CO2 gradients in cheese ripened for 4 days at 19°C
Version postprint
M
AN
US
CR
IP
T
AC
CE
PT
ED
validation Type of cheese Time after renneting Target moisture % w/w Target fat absolute % d.m. Target salt content % NaCl/d.m. Target pHPAB Validation step
“Old cheese”
15 days 42 40 5 % 5.45 No CO2 diffusion only
“Young cheese” 9.5 weeks 42 8 2.5 % 5.45 Yes* CO2 diffusion + production by PAB CO2 diffusion + production by PAB + CO2 permeation
through ripening foil
Version postprint
M
AN
US
CR
IP
T
AC
CE
PT
ED
Parameter/level low medium high
Solubility (mmol kg-1 atm-1) 25 36 40
Diffusivity (10-10 m2s-1) 1 4 8
Permeability (cm3 µm m-2 d-1 bar-1) 4000 44000 440 000
Version postprint
M
AN
US
CR
IP
T
AC
CE
PT
ED
Figure 1: Scheme of the simplified food / packaging system with the four phenomena
considered (mono-directional transfer through the headspace/cheese interface, br =cheese
bottom-rind)
x=0
Version postprint
M
AN
US
CR
IP
T
AC
CE
PT
ED
Figure 10. Effect of the intensity (low, medium and high, as stated in Table 2, in black,
blue and red respectively) of the input parameter CO2 solubility (a), diffusivity (b)
permeability (c) and production rate (d) on the predicted CO2 gradients in cheese ripened for 4
Version postprint
M
AN
US
CR
IP
T
AC
CE
PT
ED
Figure 2. CO2 solubility in semi-hard Swiss-type cheese as a function of salt content at 13°C.
The point at intermediate NaCl content (1.5% w/w) is added to the ones reported by Acerbi et al. (2016b) and it was measured with same protocol on the same cheese. Different letters a, b c, …denote significant difference for a = 0.05.
Version postprint
M
AN
US
CR
IP
T
AC
CE
PT
ED
Figure 3. (a) PTATN - ratio of phosphotungstic acid soluble nitrogen on total nitrogen and (b)
SM - salt in moisture ratio- in different positions of the of the semi-hard Swiss-type cheese
with PAB, from rind (0 cm) to core (4 cm) at 15 and 20 days from renneting, representing
starting time and ending time of the validation experiment.
0.10 0.15 0.20 0.25 0.30 0.35 0.40 0.45 0.50 0 1 2 3 4 P T A T N ( % w /w ) Position (cm) 15 days 20 days 1.50 2.00 2.50 3.00 3.50 4.00 0 1 2 3 4 S M ( % w /w ) Position (cm) 15 days 20 days (a) (b)
Version postprint
M
AN
US
CR
IP
T
AC
CE
PT
ED
Figure 4. Propionate (a) and acetate (b) concentrations in different positions of the semi-hard
Swiss-type cheese with PAB at 15 and 20 days from renneting (young cheese).
0 10 20 30 40 50 60 70 80 0 1 2 3 4 p ro p io n a te ( m m o l/ k g ) Position (cm) 15 days 20 days 0 5 10 15 20 25 30 35 40 45 0 1 2 3 4 a ce ta te ( m m o l/ k g ) Position (cm) 15 days 20 days (a) (b)
Version postprint
M
AN
US
CR
IP
T
AC
CE
PT
ED
Figure 5. pH and PAB count in different positions of the semi-hard Swiss-type cheese with
PAB at 15 and 20 days from renneting.
5.45 5.50 5.55 5.60 5.65 5.70 5.75 5.80 0 1 2 3 4 p H Position (cm) 15 days 20 days 6.5 7.0 7.5 8.0 8.5 9.0 9.5 0 1 2 3 4 lo g P A B c o u n t (c fu /g ) Position (cm) 15 days 20 days (a) (b)
Version postprint
M
AN
US
CR
IP
T
AC
CE
PT
ED
Figure 6. Median values for initial CO2 concentration measured in 9.5 weeks after
renneting for old semi-hard Swiss-type cheese without PAB (a) and in 2 weeks after renneting
for young semi-hard Swiss-type cheese with PAB (b). Horizontal and vertical error bars
represent cheese position used and min and max values for assessed CO2 respectively. 0 2 4 6 8 10 12 14 16 0 1 2 3 4 5 6 7 8 C O 2 (m m o l/ k g ) Position (cm) 0 2 4 6 8 10 12 14 16 0 1 2 3 4 5 6 7 8 C O 2 ( m m o l/ k g ) Position (cm) (a) (b)
Version postprint
M
AN
US
CR
IP
T
AC
CE
PT
ED
Figure 7. Experimental (red dots) and predicted (solid line) CO2 concentration in the
semi-hard cheese without PAB (a) and with PAB (b) CO2 production after about 4 ripening days at
19°C. Root mean squared error (CVRMSD) is indicated on each figure. Error bars in
experimental data represent standard deviations. (a)
CVRMSD=9%
(b)
Version postprint
M
AN
US
CR
IP
T
AC
CE
PT
ED
Figure 8. Predicted CO2 gradients in cheese (solid lines) after 1, 2, 3, 4 and 10 days of contact
with 100% CO2, calculated considering 1.7 folds higher CO2 production rate (19°C). Red
solid line and red error bars correspond to predicted and experimental CO2 gradient after 4
Version postprint
M
AN
US
CR
IP
T
AC
CE
PT
ED
Figure 9. Predicted CO2 gradients in cheese (solid or dotted lines) after 1, 2, 3, 4 and 10 days
of contact with 100% CO2, calculated considering 2 folds higher initial CO2 gradient (19°C).
Red solid line and red error bars correspond to predicted and experimental CO2 gradient after