Publisher’s version / Version de l'éditeur:
2017 IEEE 30th Canadian Conference on Electrical and Computer Engineering
(CCECE), 2017-06-15
READ THESE TERMS AND CONDITIONS CAREFULLY BEFORE USING THIS WEBSITE. https://nrc-publications.canada.ca/eng/copyright
Vous avez des questions? Nous pouvons vous aider. Pour communiquer directement avec un auteur, consultez la première page de la revue dans laquelle son article a été publié afin de trouver ses coordonnées. Si vous n’arrivez pas à les repérer, communiquez avec nous à [email protected].
Questions? Contact the NRC Publications Archive team at
[email protected]. If you wish to email the authors directly, please see the first page of the publication for their contact information.
NRC Publications Archive
Archives des publications du CNRC
This publication could be one of several versions: author’s original, accepted manuscript or the publisher’s version. / La version de cette publication peut être l’une des suivantes : la version prépublication de l’auteur, la version acceptée du manuscrit ou la version de l’éditeur.
For the publisher’s version, please access the DOI link below./ Pour consulter la version de l’éditeur, utilisez le lien DOI ci-dessous.
https://doi.org/10.1109/CCECE.2017.7946594
Access and use of this website and the material on it are subject to the Terms and Conditions set forth at
Detection of potato diseases using image segmentation and multiclass
support vector machine
Islam, Monzurul; Dinh, Anh; Wahid, Khan; Bhowmik, Pankaj
https://publications-cnrc.canada.ca/fra/droits
L’accès à ce site Web et l’utilisation de son contenu sont assujettis aux conditions présentées dans le site LISEZ CES CONDITIONS ATTENTIVEMENT AVANT D’UTILISER CE SITE WEB.
NRC Publications Record / Notice d'Archives des publications de CNRC:
https://nrc-publications.canada.ca/eng/view/object/?id=5ec843d4-a03b-4e60-ae51-37e600fef16d https://publications-cnrc.canada.ca/fra/voir/objet/?id=5ec843d4-a03b-4e60-ae51-37e600fef16d
Detection of Potato Diseases Using Image
Segmentation and Multiclass Support Vector Machine
Monzurul Islam, Anh Dinh, Khan Wahid
Department of Electrical and Computer EngineeringUniversity of Saskatchewan Saskatoon, Canada
Pankaj Bhowmik
National Research Council CanadaSaskatoon, Saskatchewan Canada
Abstract—Modern phenotyping and plant disease detection provide promising step towards food security and sustainable agriculture. In particular, imaging and computer vision based phenotyping offers the ability to study quantitative plant physiology. On the contrary, manual interpretation requires tremendous amount of work, expertise in plant diseases, and also requires excessive processing time. In this work, we present an approach that integrates image processing and machine learning to allow diagnosing diseases from leaf images. This automated method classifies diseases (or absence thereof) on potato plants from a publicly available plant image database called ‘Plant Village’. Our segmentation approach and utilization of support vector machine demonstrate disease classification over 300 images with an accuracy of 95%. Thus, the proposed approach presents a path toward automated plant diseases diagnosis on a massive scale.
Keywords— SVM, Disease detection, Plant Phenotyping.
I. INTRODUCTION
Potato is one of the most significant food crops. The diseases causing substantial yield loss in potato are
Phytophthora infestans (late blight) and Alternaria solani
(early blight). Early detection of these diseases can allow to take preventive measures and mitigate economic and production losses. Over the last decades, the most practiced approach for detection and identification of plant diseases is naked eye observation by experts. But in many cases, this approach proves unfeasible due to the excessive processing time and unavailability of experts at farms located in the remote areas [1]. Hence, the introduction of image analysis tools turns out to be an effective method for continuous monitoring of plant health status and early detection of plant diseases. As diseases leave some visible symptoms on the plants, particular on leaves, disease detection can be performed by imaging analysis of those visible patterns on leaves. Thus imaging technique combined with machine learning offers a solution to the issue of agricultural productivity and ensures food security. So the objective of this work is to develop imaging and machine learning based effective and error-free disease detection system for plant.
The rest of the paper is organized as follows: Section II describes the previous works of diseases and deficiency detection of different plants and Section III explains the dataset of our work. The proposed approach is illustrated in section IV.
The experimental results are projected in section V and finally, section VI concludes the work including the future plans.
II. LITERATURE REVIEW
Several advancements have been made to monitor and identify crop diseases, including RGB imaging, X-ray, ultrasound, and multispectral and hyperspectral technologies [2]. The method proposed by Macedo-Cruz et al. in [3] aimed to quantify the damage caused by frost in oat crops. First, the conversion from RGB to the L*a*b* color space is performed. The authors employed three different thresholding strategies: Otsu’smethod, Isodata algorithm, and fuzzy thresholding. The system proposed by Yao et al. in [4] aimed to identify and classify three types of diseases that affect rice crops. The image is segmented by Otsu’s method, after which the diseased regions are isolated. Color, shape and texture features are extracted, the latter one comes from the HSV color space. Finally, the features are submitted to a Support Vector Machine, which performs the final classification.
The method proposed by Phadikar and Sil in [5] detects and differentiates two diseases affecting rice crops, converting the image to the HSI color space, an entropy-based thresholding is used for segmentation. An edge detector is applied to the segmented image, and then spots are detected by using the intensity of the green components. Wang et al. in [6] proposed a method to discriminate between pairs of diseases in wheat and grapevines. The images are segmented by a K-means algorithm, and then 50 color, shape and texture features are extracted. The method proposed by Wiwart et al. in [7] aimed to detect and discriminate among four types of mineral deficiencies (nitrogen, phosphorus, potassium and magnesium). Prior to the color analysis, the images are converted to the HSI and L*a*b* color spaces. Those differences are quantified by Euclidean distances calculated in both color spaces. In their two papers, Kurniawati et al. [8] proposed a method to identify and label three different kinds of diseases that affect paddy crops. As in many other methods, the segmentation of healthy and diseased regions is performed by means of thresholding. Recently, Sharada Prasanna Mohanty et al. used deep convolutional neural network to identify 14 crop species and 26 diseases (or absence thereof) [9]. Our work will utilize the salient features of RGB images and machine learning for disease detection in potato.
III. DATASET DESCRIPTION
Plant Village (www.plantvillage.org), a publicly available image database, contains 54,306 images of diseased and healthy plant leaves of 14 crop species collected under controlled conditions and the ground truths are also provided. We analyze 300 images of potato leaves, which have a spread of the following class labels assigned to them:
• Late blight affected potato leaf. • Early blight affected potato leaf. • Healthy or Non-diseased potato leaf.
IV. PROPOSED METHOD
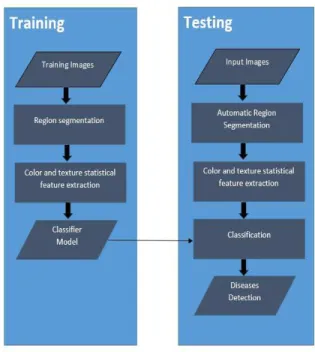
To reveal the latent characteristics of potato leaves reliably and in an easy-to-understand way, we perform segmentations on leaf images. Firstly, we mask out the background as well as the green region of the leaves. Thus we extract our region of interest (ROI) that only contains visible diseases symptoms. For a particular disease, these regions demonstrate specific color and texture properties. By training a multiclass support vector machine (SVM) classifier with these properties (features), we detect and distinguish the diseases (or absence thereof). The basic steps of proposed method of diseases detection are shown in a flowchart in Fig. 1.
Fig. 1. Flowchart of the proposed method A. Images Segmentation
We chose a technique based on a set of masks generated by analysis of the color and luminosity components of different regions of the images in L*a*b* color spaces. Samples of 3 classes of potato leaf images are shown in Fig. 2. As the region containing diseases symptom has significant difference in color and texture than the surrounding regions, we try to isolate them. The background pixels which add noise and redundancy to our region of interest are required to be
removed. Therefore, we extract the leaf-only images by masking out the background. Instead of using auto-threshold like Otsu, we determine thresholds for L*, a* and b* channel that will segmentize the leaf from the background. This task is performed by Color Thresholder app in MatLab. Based on these thresholds, we generate mask and remove the background. During training stage, the threshold ranges are determined and later on, these predefined thresholds are used in the testing stage of the classification. The threshold range selection for channel L*, a* and b* from histogram analysis are shown in Fig. 3. The leaf-only images after segmentation are presented in Fig. 4.
Fig. 2. Sample images of Potato leaf: (a) Late Blight affected (b) Early Blight affected (c) Healthy
Fig. 3. Histogram analysis of L*, a* and b* channel
On the next step, the pixels where the level of green is higher than red and blue are identified and removed by application of the mask. This is based on the fact that these green pixels most probably represent healthy areas in the leaves. Thus, after removing the background and green pixels, the region left in an image is the region of our interest. The segmented region of interest after green removal is shown in Fig. 5.
Fig. 4. Segmented leaf only image after masking background: (a) Late Blight affected (b) Early Blight affected (c) Healthy
Fig. 5. Segmented region of interest by greenness removal mask (a) Late Blight affected (b) Early Blight affected (c) Healthy
B. Feature Extraction
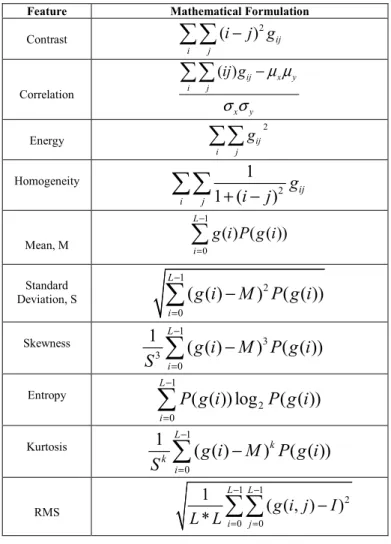
The three fundamental pattern elements used in human interpretation of images are spectral, textural and contextual features. In this work, we extracted 10 features (color and textural) from every leaf images of the dataset. The Gray Level Co-occurrence Matrix (GLCM) was used for extracting statistical texture features like contrast, correlation, energy and homogeneity. Besides, numerical indicators like mean, standard deviation, entropy, skew and energy were calculated from the histograms of the color planes. The corresponding mathematical formulations of these features are shown in Table I.
C. Classification by SVM
Support Vector Machine is supervised learning model formally defied by separating hyperplane. It needs the solution of following optimization problem for a given training set of instance label pairs
( ,
x y
l l)
, l=1, 2,....,i wherex
l∈
R
nand{1, 1} .
i ly
∈
−
, , 11
min
2
i T l u e lu u C
ξξ
=+
(1) Subjected toy
l=
(
u
Tφ
( )
x
l+
e
) 1
≥ −
ξ
l ,ξ
l≥
0
By utilizing this principle, we construct a multiclass SVM model, train it and classify our desired data of predetermined features from diseases affected leaves and healthy leaves
TABLE I. MATHEMATICAL FORMULATION OF FEATURES
Feature Mathematical Formulation
Contrast 2
(
)
ij i ji
−
j g
Correlation ( ) ij x y i j x y ij gµ µ
σ σ
−
Energy 2 ij i j g
Homogeneity 21
1 (
)
ij i jg
i
j
+ −
Mean, M 1 0( ) ( ( ))
L ig i P g i
− =
Standard Deviation, S 1 2 0( ( )
)
( ( ))
L ig i
M
P g i
− =−
Skewness 1 3 3 01
( ( )
)
( ( ))
L ig i
M
P g i
S
− =−
Entropy 1 2 0( ( )) log
( ( ))
L iP g i
P g i
− =
Kurtosis 1 01
( ( )
)
( ( ))
L k k ig i
M
P g i
S
− =−
RMS 1 1 2 0 01
( ( , )
)
*
L L i jg i j
I
L L
− − = =−
V. RESULT AND DISCUSSION
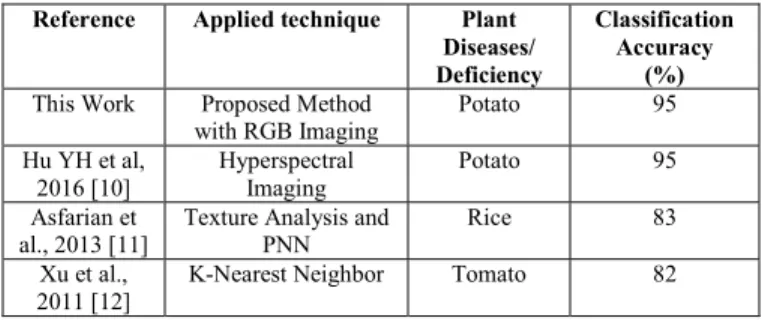
The proposed algorithm is applied on a database of 300 images of potato leaves collected from the publicly available dataset: ‘Plant Village’. Our experimental database consists of images of 100 healthy leaves and 200 diseased leaves. During the experiment, the database was divided into two sets: the training set containing 180 images (60%) and the testing set containing 120 images (40%). For classification purpose, multiclass SVM with ‘linear’ Kernel was utilized. For performance evaluation of the classification model, performance parameters such as accuracy, sensitivity, recall, and F1-score were calculated. At 60%-40% train-test split, testing accuracy of the classification is 95%. Moreover, to make the model more robust, 5-fold cross validation was applied while 93.7% accuracy was achieved. The performance measures are illustrated in Table II. Besides, this proposed work is also compared to other techniques in Table III. As much work has not been done on detection of disease on potato, we made comparison with other species alongside potato. The most recent work of Hu YH [10] requires expensive hyperspectral imaging devices while our work deals with the popular RGB imaging. In addition, though methods like deep neural network, deep learning [9] show good accuracies, they come with high computational cost.
a b c
TABLE II. PERFORMANCE MEASURES OF CLASSIFICATION Class Precision (%) Recall (%) F1-score (%) 0: late blight 89 94 92 1: early blight 97 93 95 2: non-diseased 98 98 98 Average/total 95 95 95
Fig. 6 shows the graphical representation of the confusion matrix containing test data for late blight (class 0), early blight (class 1) and non-diseased (class 2). It represents the visualization of the performance of our algorithm on the testing dataset. Fig. 7 shows that the area under the ROC curve for our classification is 96% which indicates an excellent accuracy of our classification.
Fig. 6. Plot of confusion matrix for test data
Fig. 7. ROC analysis for classification
VI. CONCLUSION
In this paper, image segmentation with multiclass SVM is utilized to develop an automated and easily accessible system. The most significant diseases in potato, late blight and early blight, are identified with a little computational effort. Our approach will offer farmers a feasible, efficient and timesaving way of disease identification. We are planning to integrate more number of diseases of various species of plant into the system. We will dedicate our future works on automatically estimating the severity of the detected disease.
Moreover, a smartphone-assisted system will be developed in future to automate the detection process.
TABLE III.COMPARISON OF VARIOUS DETECTION TECHNIQUES/ ALGORITHMS OF LEAF DISEASE DETECTION.
Reference Applied technique Plant Diseases/ Deficiency
Classification Accuracy
(%) This Work Proposed Method
with RGB Imaging Potato 95 Hu YH et al, 2016 [10] Hyperspectral Imaging Potato 95 Asfarian et al., 2013 [11]
Texture Analysis and PNN
Rice 83
Xu et al., 2011 [12]
K-Nearest Neighbor Tomato 82
ACKNOWLEDGMENT
The authors would like to acknowledge the support from the Global Institute for Food Security, Canada, and Agriculture Development Fund, Saskatchewan, Canada.
REFERENCES
[1] Vibhute A, Bodhe SK., “Applications of image processing in agriculture: a survey,” International Journal of Computer Applications. 52(2) 2012, pp. 34-40.
[2] Mirwaes Wahabzada, Anne-Katrin Mahlein, Christian Bauckhage, Ulrike Steiner, Erich Christian Oerke, Kristian Kersting, “'Plant Phenotyping using Probabilistic Topic Models: Uncovering the Hyperspectral Language of Plants,” Scientific Reports 6, Nature, Article number: 22482, 2016.
[3] Macedo-Cruz A, Pajares G, Santos M, Villegas-Romero I., “Digital image sensor-based assessment of the status of oat (Avena sativa L.) crops after frost damage,” Sensors 11(6), 2011, pp. 6015–6036. [4] Yao Q, Guan Z, Zhou Y, Tang J, Hu Y, Yang B, “Application of
support vector machine for detecting rice diseases using shape and color texture features,” 2009 International Conference on Engineering Computation, IEEE, Hong Kong, 2009, pp. 79–83.
[5] Phadikar S, Sil J, “'Rice disease identification using pattern recognition techniques,” IEEE, Khulna, 2008, pp. 420_423.
[6] Wang H, Li G, Ma Z, Li X, “Application of neural networks to image recognition of plant diseases,” Proceedings of the 2012 International Conference on Systems and Informatics (ICSAI). IEEE, Yantai, 2012, pp. 2159–2164.
[7] Wiwart M, Fordonski G, Zuk-Golaszewska K, Suchowilska E “Early diagnostics of macronutrient deficiencies in three legume species by color image analysis,” Comput Electron Agric 65, 2009, pp. 125–132. [8] Kurniawati NN, Abdullah SNHS, Abdullah S, Abdullah S,
“Investigation on image processing techniques for diagnosing paddy diseases,” 2009 International Conference of Soft Computing and Pattern Recognition, IEEE, Malacca, 2009, pp. 272–277.
[9] Sharada Prasanna Mohanty, David Hughes, Marcel Salathe, “Using Deep Learning for Image-Based Plant Disease Detection,” Computer Vision and Pattern Recognition, to be published.
[10] Hu YH, Ping XW, Xu MZ, Shan WX, He Y, “Detection of Late Blight Disease on Potato Leaves Using Hyperspectral Imaging Technique,” PubMed, 36(2), 2016, pp. 515-519.
[11] Asfarian A, Herdiyeni Y, Rauf A, Mutaqin KM., “Paddy Diseases Identification with Texture Analysis using Fractal Descriptors Based on Fourier Spectrum,” Proceeding of International Conference on Computer, Control, Informatics and Its Applications. IEEE, Jakarta, 2013, pp. 77-81.
[12] Xu G, Zhang F, Shah SG, Ye Y, Mao H., “Use of leaf color images to identify nitrogen and potassium deficient tomatoes,” Pattern Recognition Letter Vol. 32, 2011, pp. 1584-1590.