Publisher’s version / Version de l'éditeur:
Vous avez des questions? Nous pouvons vous aider. Pour communiquer directement avec un auteur, consultez la première page de la revue dans laquelle son article a été publié afin de trouver ses coordonnées. Si vous n’arrivez pas à les repérer, communiquez avec nous à [email protected].
Questions? Contact the NRC Publications Archive team at
[email protected]. If you wish to email the authors directly, please see the first page of the publication for their contact information.
https://publications-cnrc.canada.ca/fra/droits
L’accès à ce site Web et l’utilisation de son contenu sont assujettis aux conditions présentées dans le site LISEZ CES CONDITIONS ATTENTIVEMENT AVANT D’UTILISER CE SITE WEB.
ACS Nano, 14, 3, pp. 2575-2584, 2020-03-17
READ THESE TERMS AND CONDITIONS CAREFULLY BEFORE USING THIS WEBSITE.
https://nrc-publications.canada.ca/eng/copyright
NRC Publications Archive Record / Notice des Archives des publications du CNRC :
https://nrc-publications.canada.ca/eng/view/object/?id=933ed137-8471-43e1-ad62-698390423434 https://publications-cnrc.canada.ca/fra/voir/objet/?id=933ed137-8471-43e1-ad62-698390423434
NRC Publications Archive
Archives des publications du CNRC
This publication could be one of several versions: author’s original, accepted manuscript or the publisher’s version. / La version de cette publication peut être l’une des suivantes : la version prépublication de l’auteur, la version acceptée du manuscrit ou la version de l’éditeur.
For the publisher’s version, please access the DOI link below./ Pour consulter la version de l’éditeur, utilisez le lien DOI ci-dessous.
https://doi.org/10.1021/acsnano.0c01281
Access and use of this website and the material on it are subject to the Terms and Conditions set forth at
Flow batteries: how to determine electrochemical kinetic parameters
Wang, Hao; Sayed, Sayed Youssef; Luber, Erik J.; Olsen, Brian C.;
Shirurkar, Shubham M.; Venkatakrishnan, Sankaranarayanan; Tefashe,
Ushula M.; Farquhar, Anna K.; Smotkin, Eugene S.; Mccreery, Richard L.;
Buriak, Jillian M.
Redox Flow Batteries: How to Determine
Electrochemical Kinetic Parameters
Hao Wang,
⊥Sayed Youssef Sayed,
*
,⊥Erik J. Luber, Brian C. Olsen, Shubham M. Shirurkar,
Sankaranarayanan Venkatakrishnan, Ushula M. Tefashe, Anna K. Farquhar, Eugene S. Smotkin,
Richard L. McCreery, and Jillian M. Buriak
*
Cite This:ACS Nano2020, 14, 2575−2584 Read Online
ACCESS
Metrics & More Article Recommendations*
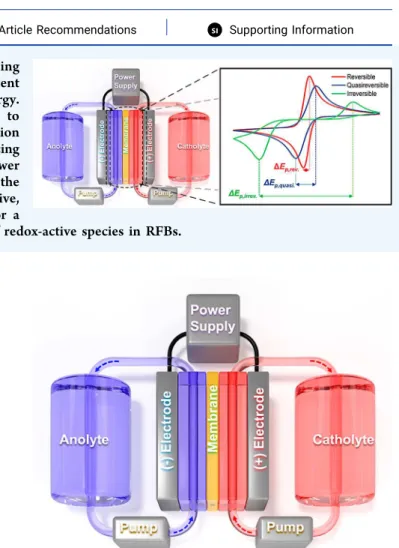
sı Supporting InformationABSTRACT: Redox flow batteries (RFBs) are promising energy storage candidates for grid deployment of intermittent renewable energy sources such as wind power and solar energy. Various new redox-active materials have been introduced to develop cost-effective and high-power-density next-generation RFBs. Electrochemical kinetics play critical roles in influencing RFB performance, notably the overpotential and cell power density. Thus, determining the kinetic parameters for the employed redox-active species is essential. In this Perspective, we provide the background, guidelines, and limitations for a
proposed electrochemical protocol to define the kinetics of redox-active species in RFBs.
R
edox flow batteries (RFBs) are of great interest as electrochemical energy storage systems, particularly for stationary applications.1 This type of batteryarchitec-ture is based on redox-active pairs in separate solutions that are contained within external storage tanks, termed the anolyte (negolyte) and the catholyte (posolyte).2−6Power is generated
upon flow of the anolyte and catholyte within a central electrochemical cell, comprising an ion exchange membrane, as shown schematically inFigure 1.7The chemical energy stored in the redox components is converted to electrical energy transmitted through the external circuit.8 The main factors
controlling RFB performance are the same as most other electrochemical cells: (1) thermodynamics, reflected in the redox potential; (2) mass transport of redox components to the electrode; and (3) the electron transfer rate, embodied in
k0, the heterogeneous electron transfer rate constant. Substantial progress has been made toward the synthesis and development of redox species that have high solubilities, a large difference in redox potentials, the necessary stability to withstand repeated cycling, and facile electrochemical kinetics.9−13 The electrochemical kinetics of a RFB
signifi-cantly impact the performance of the battery but are also critical to understand for elucidating reaction mechanisms. Developing a better understanding of the relevant reaction mechanisms is often necessary to enable further improvements of a given flow battery.
A good RFB requires favorable kinetic characteristics to enable usability over hundreds or thousands of cycles and to deliver a desirable potential window and current density. One
Published: March 17, 2020
Figure 1. Schematic diagram of a redox flow battery (RFB). Redox species, held in the tanks labeled anolyte and catholyte, are pumped into the central cell compartments to generate power.
Perspective
www.acsnano.org
© 2020 American Chemical Society
2575
https://dx.doi.org/10.1021/acsnano.0c01281
ACS Nano2020, 14, 2575−2584
Downloaded via NATL RESEARCH COUNCIL CANADA on July 15, 2020 at 13:42:08 (UTC).
should determine the reversibility of the redox reaction, kinetics, and charge-transfer mechanisms of a redox couple before integrating within a RFBthis important information will enable rational improvements to the design of the battery. “Chemical reversibility” of redox reactions is essential for good cycle life in RFBs, whereas “electron transfer reversibility” indicates the rate of electron transfer between the electrodes and the redox components. Here, and in most electrochemical literature, the term “reversible” indicates a fast electron transfer reaction that maintains thermodynamic equilibrium at the electrode/solution interface, whereas “irreversible” indicates a slow reaction that can seriously limit power output in RFBs.
“Quasireversible” refers to intermediate rates between these two extremes. In this Perspective, we walk the reader through the steps to determine the diffusion coefficient, the standard rate constant (kinetic facility of a given redox reaction), and the type of reversibility of the electron transfer (ET) mechanism when considering possible redox couples for a redox flow battery application; the Supporting Information
also provides additional information and background for the interested reader. For an excellent introduction to electro-chemistry, we strongly encourage the reader to read the recently published guide by Dempsey and co-workers.14 Figure 2. First set of cyclic voltammetry (CV) experiments to define the kinetic regimes (reversible, quasireversible, and irreversible) for an electron transfer (ET) mechanism (steps 1−3a). CVs for reversible, quasireversible, and irreversible systems were simulated using Bio-Logic EC-Lab software. Parameters: k0 = 0.5 cm s−1(reversible, red), 0.001 cm s−1(quasireversible, blue), and 1 × 10⁻⁶ cm s−1(irreversible,
green); υ = 50 mV s−1; diffusion coefficient (D
O= DR) = 1 × 10
−5cm2s−1. *The final potential range for the quasireversible system in step 2
[(200/n) mV] was chosen based on values obtained from the Nicholson equation,Table 2. Step 3b illustrates the representative linear relationship between the peak currents and the square root of scan rates υ1/2for reversible and irreversible systems. Refer toTable 1for a
The first sets of experiments one should start with are based upon cyclic voltammetry (CV), which will be used to determine if a given redox couple is reversible, quasireversible, or irreversible and to realize a rough estimation of the rate constants and diffusion coefficients of reversible and irreversible systems. For the diffusion coefficient of a quasireversible system, rotating disk electrode (RDE) ments are suggested. Second, more detailed RDE measure-ments can be deployed for further confirmation of the determined rate constants and diffusion coefficients of quasireversible and irreversible redox systems. Throughout, we will help the reader avoid missteps and pitfalls and walk through all of the steps to elucidate the important kinetic information on a candidate redox couple for RFB applications. DETERMINATION OF REVERSIBILITY AND BASIC KINETIC INFORMATION OF A NEW REDOX SYSTEM
Determination of Reversibility.To begin analyzing your new redox system for an RFB, the first two points that need to be addressed are (i) determination of the solubility/stability in different solvents and at different pH values of interest to RFB applications followed by (ii) the running of CV at different scan rates to determine the reversibility of the reaction and other important electrochemical parameters such as the diffusion coefficient. Because the determination of electro-chemical kinetic parameters varies from reversible to quasireversible or irreversible systems, experimentally defining the nature of the redox couple is the first step to be taken. As noted above, redox reactions are classified into three categories:
(i) electrochemically reversible (ii) electrochemically irreversible (iii) quasireversible
depending on the kinetics of the charge-transfer reaction between the electrodes and redox components. For reversible systems, the current is limited only by diffusional mass transport, and in contrast, the current for irreversible systems is dominated by slow charge-transfer kinetics. The CV curves of quasireversible systems have intermediate shapes dependent on both charge-transfer rate and mass-transport conditions. Although the commonly used terms imply that redox reactions fall into three distinct groups, the range of observed rates is one continuum, between “reversible” and “irreversible” depending on the time scale of the technique used to monitor charge-transfer kinetics. Figure 2 outlines the first set of
experiments that should be performed to determine whether a redox reaction is reversible, quasireversible, or irreversible and how to calculate the associated diffusion coefficient of the redox-active species in solution. We will first go through the details of reversible, quasireversible, and irreversible redox reactions and then determine the diffusion coefficients of the reactions.
As shown in Figure 2, steps 1 and 2, one begins with CV characterization of the redox couple. For reversible systems, the current is limited only by diffusional mass transport, where the peak potentials, Ep, and peak separation, ΔEp, are
independent of the scan rate. For irreversible systems, however, ΔEp increases and Ep shifts to more extreme
potentials with increasing scan rate (more positive for oxidation, negative for reduction). Quasireversible systems are influenced by both the charge-transfer kinetics and diffusional mass transport. Further criteria defining and differentiating these three categories of redox systems can be seen in theSupporting Information(section 1). As shown in
Figure 2, step 2, the shapes of the CV curves and ΔEpare used
to discern reversibility. The next step, step 3a, is to run CVs at different scan rates to determine whether Ep shifts with the
scan rate. If Epdoes not shift with the scan rate, then the redox
couple is defined as a reversible system, meaning the rate of electron transfer is fast relative to the range of scan rates employed.
Determination of the Diffusion Coefficient. The kinetics of the diffusion of a redox species are important for the performance of a redox flow battery because slow diffusion will restrict the current density and lead to larger over-potentials.15 The relationship between the peak current (corrected for the background current, Figure S1) and the square root of the scan rate, step 3b inFigure 2, is linear for reversible and irreversible systems, and the slope can be used to calculate the diffusion coefficient, D; the relevant equations are shown in step 3b.16,17 For quasireversible systems, however, the peak current is not proportional to the square root of the scan rate, and the diffusion coefficient needs to be determined through an alternate route (e.g., rotating disk electrode, RDE). A representative example for the deviation of
ipwith υ1/2for quasireversible systems is illustrated by Ohsaka
and co-workers for oxygen reduction and oxidation reactions on a sub-self-assembled monolayer/Au electrode.18 Table 1
lists all of the symbols used here, as well as their units for clarity. At this point, you will have determined whether your redox couple is reversible, quasireversible, or irreversible and Table 1. List of Commonly Used Symbolsa
symbol name units symbol name units
D diffusion coefficient cm2s−1 A electrode geometric area cm2
C* bulk concentration mol cm−3 n number of electrons none
υ scan rate V/s α charge-transfer coefficient none
E measured cell potential V E1/2 half-wave potential V
Ep peak potential V E0′ formal electrode potential V
I electric current A ip peak current A
il limiting current A ik kinetic current A
v kinematic viscosity cm2s−1
ω rotation rate or angular velocity rad s−1
F Faraday constant C mol−1 k0 standard rate constant cm s−1
R real gas constant J K−1mol−1 T temperature K
Eeq equilibrium electrode potential V id diffusion-limited current A
Ψ dimensionless Nicholson parameter none r0 radius of an electrode cm
aNote the unusual units for C* of mol cm−3, which are employed for compatibility with electrode areas in cm2and k0in cm s−1.
ACS Nano www.acsnano.org Perspective
https://dx.doi.org/10.1021/acsnano.0c01281
ACS Nano2020, 14, 2575−2584
the approximate diffusion coefficient, D, of the electroactive species in solutions for reversible and irreversible systems.
As mentioned above, for a quasireversible system, ip versus
υ1/2 is nonlinear and, thus, CV cannot be usedstep 3b in
Figure 2 is not applicable. To determine the diffusion coefficient of a quasireversible redox couple, it is suggested that a RDE be employed. Using a RDE will also enable the determination of the diffusion coefficient of reversible and irreversible systems, as well, because the mass-transport-limited diffusion current does not depend on either the electrode potential or the rate of the reaction but only on diffusion and the rotation rate.19 A RDE encounters a steady-state flux of analyte to the electrode surface, thus leading to the case where the current at a given potential is no longer dependent upon time.20 Due to the steady-state mass transport in RDEs, current−potential curves are S-shaped as opposed to the typical duck-shape of stationary (unstirred) CVs that rely on the growth of the diffusion layer thickness and diffusion of the reactive analytes to, and redox products from, the electrode throughout the scan. At high overpotentials, in a reductive RDE scan, the surface concentration of the oxidized species reaches zero, and the flux of mass transport of species to be oxidized, O, to the electrode surface approaches its maximum value. Thus, a limiting current is observed and is proportional to the square root of the angular velocity, as described by the Levich equation (Figure 3). A plot of il,c versus ω should be
linear with a slope that is a function of the number of electrons and diffusion coefficient; a representative example of il,c versus
ωcorrelation can be seen in the work of Tong et al.21 Determination of Standard Rate Constant (k0) Using
Cyclic Voltammetry.The kinetics of redox reactions can be
estimated from the standard rate constants. Low values of k0
indicate sluggish kinetics that would require more energy (a larger overpotential to overcome), which is not ideal for high-performance RFBs. Reversible electrochemical reactions are characterized by high rates of charge transfer (high standard rate constants, e.g., k0> 10−1cm s−1);22
k0values are lower for quasireversible systems, between 10−1and 10−5cm s−1and less
than 10−5cm s−1for irreversible systems.22
The determination of the standard rate constants for reversible systems is challenging due to the high values of k0 and the “kinetics are, in effect, transparent”, to quote Alan J. Bard.16 To determine the kinetic parameters for reversible systems, increasing the scan rate can principally render a reversible system quasireversible or irreversible; we have come across some examples in the literature applying and recommending this approach.17,23−25 In principle,
conven-tional voltammetry with electrodes having diameters of a few millimeters is limited in scan rate to ∼100 V/s due to ohmic potential error and a large capacitive current contribution, both of which increase with the scan rate. As a result, it has been difficult to measure k0values accurately above about 0.1 cm
s−1, and such fast-redox reactions have been considered
“reversible”. However, the development of ultra-microelectr-odes with diameters of 1−50 μm has greatly reduced uncompensated resistance errors due to the much smaller currents and resulting small iR error.26−29 Thus, the useful
range of voltammetric scan rates was increased to 1 MV/s, compared to the few hundred V/s limit with larger electrodes.27 With careful attention to cell design and sufficiently fast electronics, k0 values of ∼3 cm s−1 were
determined for ferrocene on a 5 μm diameter Au electrode.30A good test of the reliability of such high k0 values is their
constancy over a range of scan rates, which has been demonstrated for scan rates from 200 to 100,000 V/s.30 Microfabrication of very narrow band electrodes permits scan rates of >1 MV/s,31 and electrochemical measurements on microdisk electrodes in the sub-microsecond time scale have become possible.30,32,33 Although microelectrodes are highly reliable with respect to the fast scan rate approach for reversible systems, further validation is nevertheless recom-mended via simulation of the cyclic voltammograms. Thanks to the software available with modern potentiostats, most researchers can simulate their own cyclic voltammograms, similar to the ones shown in this Perspective.
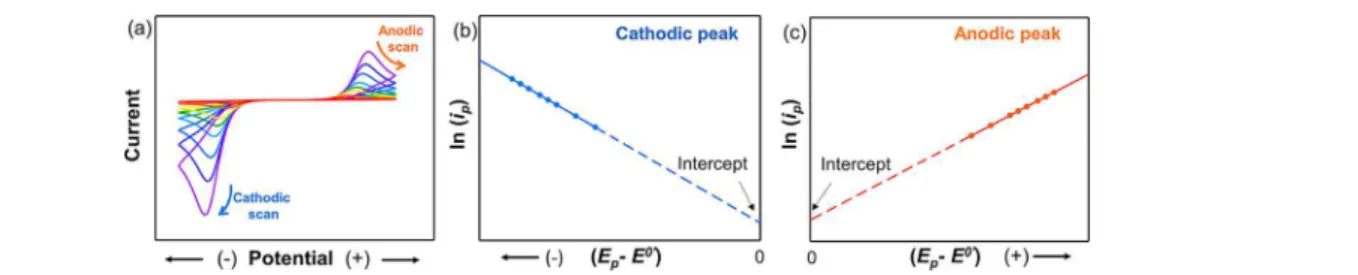
For irreversible redox reactions, the standard rate constant can be determined by using the relationship between the peak current (ip) and the overpotentials, represented in the
difference between the peak potential (Ep) and the formal
electrode potential (E0
′), at different scan rates, as shown in the following equation:
Figure 3. (a) Linear sweep voltammograms at different angular velocity. (b) Levich plot. Solving for D provides the diffusion coefficient for a quasireversible system (as well as reversible and irreversible systems).
Figure 4. (a) Cyclic voltammetry for an irreversible system at different scan rates. (b,c) Plots for ln(ip) vs (Ep− E0′) for both cathodic and
α
= * − − ′
i FAk C F RT E E
ln( )p ln(0.227 0 ) ( / )( p 0) (1)
provided that E0′is known. A linear plot of ln(i
p) versus (Ep−
E0′) at different scan rates should give a slope of −αF/RT and an intercept that is a function of the rate constant k0. A
simulated example of an irreversible system is shown inFigure 4. An actual example of the determination of the rate constant for an irreversible system can be seen in the detailed work of Zeng and co-workers.34
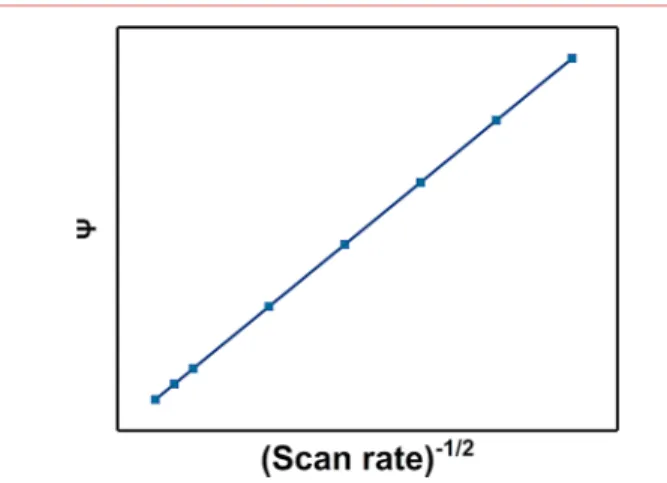
For more than five decades, the simplicity of Nicholson’s method35 has rendered it the method of choice for the determination of standard rate constants for quasireversible systems. Nicholson showed that ΔEp is a function of a
dimensionless kinetic parameter (ψ) and is insensitive to the value of the charge-transfer coefficient, α, in the range of 0.3 < α< 0.7. The only requirements for using Nicholson’s method are the measurement of ΔEpat different scan rates, followed by
determination of the corresponding values of ψ usingTable 2.
Thus, according toeq 2, k0can be extracted from the slope of a
plot of ψ versus υ1/2(Figure 5, and an example of this method
can be found in ref36). Due to the discrete points inTable 1,
for practical usage,eq 3can be used to estimate the values of ψ at different peak separations.37
ψ π υ = α D D k D nF RT ( / ) ( / ) O R /2 0 O 1/2 (2) ψ = − + Δ − Δ E E ( 0.6288 0.0021 ) 1 0.017 p p (3)
A common source of errors when using the Nicholson equation is the uncompensated ohmic drop, which results in an increased peak separation with the scan rate and determination of a lower rate constant than the true value. Hence, correction for the uncompensated ohmic drop is absolutely important for accurate determination of the rate constant using the Nicholson equation (discussed in the Supporting Informa-tion). A good indicator of ohmic potential error is the variation of k0with scan rate, that is, curvature of the plot inFigure 5. It
is also recommended to validate the observed kinetic parameters by simulating the corresponding cyclic voltammo-grams at different scan rates and comparing them to the experimental voltammograms.
DETERMINING THE STANDARD RATE CONSTANT (K0) USING A ROTATING DISK ELECTRODE
As described in above, CV enables an estimate of the rate constant of your new redox couple. If it is promising and merits further investigation, RDE measurements will enable a “double check” of the rate constant and diffusion coefficient you determined above. The reader is directed to a useful recent tutorial describing the details and potential pitfalls of RDE.20
In redox reactions that are kinetically limited, the rate of charge transfer limits the measured current, and these are thus classified as irreversible reactions.22In this case, the reciprocal of the measured current i−1 in the RDE steady-state
voltammograms is the sum of the reciprocals of the kinetic
ik−1 and mass-transfer-limited il−1 current, according to the
Koutecký−Levich equation below (eq 4). As the RDE rotation speed is increased, the electrochemical response is less limited by mass transfer, and the measured current approaches the value of the kinetic current. In order to solve for ik
experimentally, the RDE must be run at different rotation rates, as shown inFigure 6a. Once these i−E plots are in hand, select different potentials on these i−E plots and determine the measured current at different rotation velocities, ω. An example is illustrated in Tables S1 and S2, and Figure S2
lists the recommended range of potentials. A graph of 1/i
versus 1/ω1/2 should include several plots for the different chosen potentials, as shown inFigure 6b; each plot represents a set of data points for the measured current at different ω for a selected potential. In Figure 6b, the y-intercept of each plot (where 1/ω1/2 = 0) is the i
k
−1for this particular potential. At
this point, you will have determined the ik−1values at different
potentials. Next, using eq 5, the rate constant can be determined by simply plotting log(ik) versus (E − E0′), as
shown inFigure 6c, analogous to Tafel plots (section 5 in the
Supporting Information). Specifically, the value of the y-intercept of this linear plot is equal to nFAk0C*, which can be
used to determine the rate constant. Furthermore, the slope is equal to −αnF/RT, which can be used to determine the charge-transfer coefficient.
Table 2. Variation of ΔEpwith ψ at 25 °C for a One-Step
and One-Electron Reaction, α = 0.5, and Reverse Potential Greater than the Peak Potential by 112.5/na
ψ ΔEp(mV) 20 61 7 63 6 64 5 65 4 66 3 68 2 72 1 84 0.75 92 0.50 105 0.35 121 0.25 141 0.10 212
aData in the table are reproduced from ref35.
Figure 5. Example of the plot of ψ, determined by the peak separations (Table 1oreq 3) of cyclic voltammograms observed at different scan rates versus the square root of the scan rates for quasireversible systems.
ACS Nano www.acsnano.org Perspective
https://dx.doi.org/10.1021/acsnano.0c01281
ACS Nano2020, 14, 2575−2584
We noticed some examples in the literature that extracted kinetic information using a single voltammogram collected at one rotation speed to construct the log(current)−overpotential plot (similar to what is shown in Figure 6c). Ignoring corrections for the mass-transfer-limited current is justified in only a few specific examples in which there are high abundances of the reacting species, such as the hydrogen and oxygen evolution reactions (HER and OER).38,39 For other systems, this approach will yield incorrect results. For more details, we refer the reader to the review article by Wei et
al.38 ω ν = + = + * − i i i i nFAD C 1 1 1 1 1 0.62 k l,c k O2/3 1/2 1/6 O (4) α = * = * − − ′ i nFAk C nFAk C nF E E RT exp ( ) k f O 0 O 0 i k jjjjj y{zzzzz (5)
For quasireversible systems, the same experimental procedures for irreversible systems can be applied, starting by collecting RDE plots at different rotation rates (Figure 6d) to construct the i−1−ω−1/2plots (Figure 6e). The slopes for the i−1−ω−1/2
plots for quasireversible systems vary with the overpotential (Figure 6e), which is not the case for irreversible systems (Figure 6b), which have identical slopes. For quasireversible systems, extracting information from the slope of the i−1−ω−1/2
plots using the Koutecký−Levich equation for irreversible systems is erroneous because of the dependence upon voltage.
Figure 6f shows the change of the slope of the i−1−ω−1/2plots
versus the selected potentials for both irreversible and
quasireversible systems. For irreversible systems, a plateau is observed, which shows the independence with regard to voltage, as substantiated by the Koutecký−Levich equation itself (eq 4)the slope is not a function of the overpotential. For quasireversible systems, however, a nonlinear curved plot is observed, indicating an exponential relationship. For experimental examples that show such changes of slope in
the i−1−ω−1/2plots, we refer the reader to the detailed work by
research groups including Schubert, Aziz, Yu, McKone, and their co-workers.11,40−42
To solve this conundrum with regard to quasireversible systems, we provide the following solution. Instead of using the Koutecký−Levich equation (eq 4), which should only be used in the case of an irreversible system, we propose the use ofeq 6
for mixed species of quasireversible-type systems as a starting point, and we modify it for a single species (only one species is dissolved in the solution, as is typically the case in RFBs).
Equation 6 is the general equation for step and one-electron transfer quasireversible systems. This equation differs from the Koutecký−Levich equation (eq 4) as it is a function of the concentrations of both the oxidized and reduced species, overpotential (E − Eeq, where Eeqis the equilibrium potential)
and the exchange current density (i0). According to this
general equation, a plot of i−1versus ω−1/2should be linear with
an intercept at (ω−1/2= 0) that is a function of i
0and the term
“b”; the plot will be similar to that shown in Figure 6e. In contrast to irreversible systems and the Koutecký−Levich equation (eq 4), the slope for quasireversible systems is a function of the overpotentials included in the term b (eq 8). Because this equation applies only to a solution of mixed species, and your solution most likely contains only one redox-active species in the catholyte or anolyte, it must be modified. In the term b ineq 8, substituting Eeqby the Nernst equation
(eq 9) results ineq 10.
The general equation for a one-step and one-electron transfer quasireversible system is given by
ν ω = − + − × * + * α α α α − − − i b b i FA b b b D C b D C 1 1 1 1 0.62 (1 ) 1 0 1/6 O2/3 O 1 R2/3 R 1/2 i k jjjjj y { zzzzz (6) which can be written as
Figure 6. Simulated rotating disk electrode (RDE) scans at different rotation rates for irreversible (a) and quasireversible (d) systems. Koutecký−Levich plots for irreversible (b) and quasireversible (e) systems. (c) Plot of log(ik) vs E − E0′ for the irreversible system. (f)
Change of the slopes with overpotentials for the i−1−ω−1/2plots in (b,e). Simulated parameters for irreversible and quasireversible systems
ω = + Δ i B 1 1 1/2 i k jjj y { zzz (7) where F is the Faraday constant; A is the electrode area; v is the kinematic viscosity; DO and DR are the bulk diffusion
coefficients of the oxidized and reduced species, respectively;
CO* and CR* are the bulk concentrations of the oxidized and
reduced species, respectively; ω is the angular velocity of the electrode, and b is given by
= − b F E E RT expi ( eq) k jjjjj y{zzzzz (8)
where E is the measured cell potential and Eeqis given by
= + * * ′ E E RT F C C ln eq 0 O R i k jjjjj y{zzzzz (9)
If we substitute eq 9 into eq 8, the following expression is obtained: = * * − ′ b C C F E E RT exp ( ) R O 0 i k jjjjj y{zzzzz (10)
Now, if we substituteeq 10into the expression for Δ ineq 6, we arrive at the following expression:
ν ν Δ = * − − * − Δ = * − * − * − * − − − − − − ′ ′
(
)
(
)
FA D C b D C b FA D C C D C C 1 0.62 1 (1 ) 1 (1 ) 1 0.62 1 exp 1 exp F E E RT F E E RT 1/6 O2/3 O R2/3 R 1 1/6 O2/3 O R ( ) R2/3 R O ( ) 0 0 i k jjjjj j y { zzzzz z i k jjjjj jjjjj jjjjj ikjjj y { zzz i k jjj y { zzz y { zzzzz zzzzz zzzzz (11)In the limiting case of a single species solution where CO* ≫
CR*, we obtain the following expression:
ν Δ = * + − *→ − − − ′ FA C D D F E E RT lim 1 0.62 exp ( ) C 0 1/6 O O2/3 R2/3 0 R i k jjjjj j i k jjjjj y{zzzzzy { zzzzz z (12) Conversely, if we have the opposite case where CR*≫CO*
ν Δ = − * − − + *→ − − ′ − FA C D F E E RT D lim 1 0.62 exp ( ) C R O R 0 1/6 2/3 0 2/3 O i k jjjjj j i k jjjjj y{zzzzz y { zzzzz z (13) At this point, we have a full picture. Assuming that the concentration of R is 0, CR*→ 0, only the oxidized species O exists in the solution. In this case, the slope of a plot of i−1
versus ω−1/2(Figure 6e), represented byeq 6, can be simplified
toeq 12, which shows an exponential dependence of the slope on the overpotentials, as seen inFigure 6f for quasireversible systems. Interestingly, a plot of the slope versus e(F/RT)(E−E0
′)
should be linear, as shown inFigure S3.
By convention, the intercept of the plot of i−1
versus ω−1/2
(Figure 6e) for a quasireversible system and eq 6 will be denoted as iquasi(eq 14): = − α i b i b (1 ) quasi 0 (14) α = * − − ′ i FAk C F E E RT exp ( ) 0 0 O eq 0 i k jjjjj jj y { zzzzz zz (15) Substitutingeq 15toeq 14results in α = − * ⇒ = − * − − α α − − − ′ ′
(
)
i b FAk C i b FAk C F E E RT (1 ) exp exp (1 ) exp ( ) F E E RT F E E RT quasi 0 O ( ) ( ) quasi 0 O 0 eq 0 eq i k jjj y{zzz i k jjjjj y{zzzzz (16)Considering the Nernst equation for a solution of only the oxidized species, O, CR* → 0, we can assume that Eeq is very
large so that the term “b” approaches 0, and thus,eq 16can be simplified toeq 17. Therefore, the intercept for quasireversible systems of a single species is similar to the kinetic current for Figure 7. (a) Discharging polarization curve for a redox flow battery (RFB) device, illustrating three voltage regions that are associated with kinetics, ohmic, and mass-transfer losses. (b) Simulated discharge polarization and corresponding power curves at 50% state of charge (equal concentrations for the O and R species) for three RFBs of different combinations of reversible and quasireversible redox systems with k0of 3 × 10⁻¹and 2 × 10⁻⁴cm s−1, respectively.
ACS Nano www.acsnano.org Perspective
https://dx.doi.org/10.1021/acsnano.0c01281
ACS Nano2020, 14, 2575−2584
irreversible systems (eq 5). At this point, solving for the standard rate constant for quasireversible systems should follow the same procedures shown earlier for irreversible systems (Figure 6c andeq 17). Furthermore, sampling current voltammetry (discussed in detail in the Supporting Informa-tion, section 4) would act as another check technique for solutions of single quasireversible species.
α = * − − = ′ i FAk C F E E RT i exp ( ) quasi 0 O 0 k i k jjjjj y{zzzzz (17)
As a final point to note, the cell voltage is a crucial parameter inherent in the power and energy density values for RFBs, both of which contribute to the overall cell cost.43 Polarization curves are typically performed to determine the sources of voltage loss in RFBs,44and power density curves, derived from polarization curves, are commonly used to give an idea about the maximum delivered power at different current densities and rates. As shown inFigure 7a, the polarization curve can be divided into three voltage regions, which are controlled by the kinetics of the redox systems, ohmic cell resistance associated with contact and ionic resistances, and mass transport of bulk species to the electrode surface.45 For the effect of the mass transport and ohmic resistance on the polarization curves, we refer the reader to the detailed work by Aaron et al. and Milshtein et al.45,46 In order to demonstrate the effect of kinetics on the polarization and power curves, we used the current−overpotential (eq S3)16 to simulate the polarization curves for RFBs, including reversible (k0of 3 × 10⁻¹cm s−1)
and quasireversible (k0 of 2 × 10⁻⁴ cm s−1) redox species. Figure 7b shows the discharging polarization and correspond-ing power curves at 50% state of charge for three RFBs with different combinations of reversible and quasireversible redox couples. The incorporation of quasireversible redox couples in a symmetric RFB configuration (green plots in Figure 7b) shows the lowest power at high current values, which has the highest voltage drop in the kinetic region of the polarization curve compared to a symmetric RFB composed of facile redox couples (red plots), and an asymmetric RFB incorporating reversible and quasireversible redox couples (blue plots). Thus, there is clear evidence for the impact of sluggish kinetics and low-rate-constant redox systems on the delivered maximum power and overall energy densities represented by the cell voltage.
CONCLUSIONS
Redox flow batteries are, at least on paper, experimentally simple electrochemical energy storage devices. Compartmen-talized anolyte and catholytes, each containing the respective redox species, are separated only by an ion-exchange membrane. The performance of the RFB, however, depends exquisitely upon the nature and kinetic parameters of the electrochemically active species that must be accurately determined in order to understand the fundamental mecha-nisms of the redox chemistry. We have provided this step-by-step description of how to categorize the redox species within an RFB as reversible, quasireversible, or irreversible and then use this information to determine the critical kinetic information needed to understand the basics of your RFB system.
ASSOCIATED CONTENT
*
sı Supporting InformationThe Supporting Information is available free of charge at
https://pubs.acs.org/doi/10.1021/acsnano.0c01281. Additional experimental data (PDF)
AUTHOR INFORMATION
Corresponding Authors
Jillian M. Buriak −Department of Chemistry, University of Alberta, Edmonton, Alberta T6G 2G2, Canada;
Nanotechnology Research Center, National Research Council Canada, Edmonton, Alberta T6G 2M9, Canada; orcid.org/ 0000-0002-9567-4328; Email:[email protected]
Sayed Youssef Sayed −Department of Chemistry, University of Alberta, Edmonton, Alberta T6G 2G2, Canada;
Nanotechnology Research Center, National Research Council Canada, Edmonton, Alberta T6G 2M9, Canada; orcid.org/ 0000-0003-1575-676X; Email:[email protected]
Authors
Hao Wang −Department of Chemistry, University of Alberta, Edmonton, Alberta T6G 2G2, Canada; Nanotechnology Research Center, National Research Council Canada, Edmonton, Alberta T6G 2M9, Canada; orcid.org/0000-0001-9384-5122
Erik J. Luber −Department of Chemistry, University of Alberta, Edmonton, Alberta T6G 2G2, Canada; Nanotechnology Research Center, National Research Council Canada, Edmonton, Alberta T6G 2M9, Canada; orcid.org/0000-0003-1623-0102
Brian C. Olsen −Department of Chemistry, University of Alberta, Edmonton, Alberta T6G 2G2, Canada;
Nanotechnology Research Center, National Research Council Canada, Edmonton, Alberta T6G 2M9, Canada; orcid.org/ 0000-0001-9758-3641
Shubham M. Shirurkar −Department of Chemistry and Chemical Biology, Northeastern University, Boston, Massachusetts 02115, United States
Sankaranarayanan Venkatakrishnan −Department of Chemistry and Chemical Biology, Northeastern University, Boston, Massachusetts 02115, United States; orcid.org/ 0000-0002-1125-6031
Ushula M. Tefashe −Department of Chemistry, University of Alberta, Edmonton, Alberta T6G 2G2, Canada
Anna K. Farquhar −Department of Chemistry, University of Alberta, Edmonton, Alberta T6G 2G2, Canada; orcid.org/ 0000-0003-4156-7567
Eugene S. Smotkin −Department of Chemistry and Chemical Biology, Northeastern University, Boston, Massachusetts 02115, United States; orcid.org/0000-0002-9629-0414
Richard L. McCreery −Department of Chemistry, University of Alberta, Edmonton, Alberta T6G 2G2, Canada; orcid.org/ 0000-0002-1320-4331
Complete contact information is available at:
https://pubs.acs.org/10.1021/acsnano.0c01281
Author Contributions
⊥
H.W. and S.Y.S. contributed equally to this work.
Notes
ACKNOWLEDGMENTS
This work was supported by the Climate Change Innovation Technology Framework (CCITF) of Alberta Innovates Technology Futures (Grant No. CTDP-G2018000919), a graduate scholarship from Alberta Innovates Technology Futures to H.W., NSERC (Grant Nos. RGPIN-2014-05195 and RGPIN-2019-04346), Future Energy Systems of the University of Alberta (https://futureenergysystems.ca; Grant No. T12-P04), an Alberta Innovates Technology Futures Industry Chair (Grant No. AITF iCORE IC50-T1 G2013000198), Western Economic Diversification (WD, Grant No. 000014328), and the Canada Research Chairs program (CRC 207142).
REFERENCES
(1) Dunn, B.; Kamath, H.; Tarascon, J.-M. Electrical Energy Storage for the Grid: A Battery of Choices. Science 2011, 334, 928−935.
(2) Soloveichik, G. L. Flow Batteries: Current Status and Trends. Chem. Rev. 2015, 115, 11533−11558.
(3) Winsberg, J.; Hagemann, T.; Janoschka, T.; Hager, M. D.; Schubert, U. S. Redox-Flow Batteries: From Metals to Organic Redox-Active Materials. Angew. Chem., Int. Ed. 2017, 56, 686−711.
(4) Park, M.; Ryu, J.; Wang, W.; Cho, J. Material Design and Engineering of Next-Generation Flow-Battery Technologies. Nat. Rev. Mater. 2017, 2, 16080.
(5) Wei, X.; Pan, W.; Duan, W.; Hollas, A.; Yang, Z.; Li, B.; Nie, Z.; Liu, J.; Reed, D.; Wang, W.; Sprenkle, V. Materials and Systems for Organic Redox Flow Batteries: Status and Challenges. ACS Energy Lett. 2017, 2, 2187−2204.
(6) Ke, X.; Prahl, J. M.; Alexander, J. I. D.; Wainright, J. S.; Zawodzinski, T. A.; Savinell, R. F. Rechargeable Redox Flow Batteries: Flow Fields, Stacks and Design Considerations. Chem. Soc. Rev. 2018, 47, 8721−8743.
(7) Yang, Z.; Tong, L.; Tabor, D. P.; Beh, E. S.; Goulet, M.-A.; De Porcellinis, D.; Aspuru-Guzik, A.; Gordon, R. G.; Aziz, M. J. Alkaline Benzoquinone Aqueous Flow Battery for Large-Scale Storage of Electrical Energy. Adv. Energy Mater. 2018, 8, 1702056.
(8) Noack, J.; Roznyatovskaya, N.; Herr, T.; Fischer, P. The Chemistry of Redox-Flow Batteries. Angew. Chem., Int. Ed. 2015, 54, 9776−9809.
(9) Hu, B.; DeBruler, C.; Rhodes, Z.; Liu, T. L. Long-Cycling Aqueous Organic Redox Flow Battery (AORFB) Toward Sustainable and Safe Energy Storage. J. Am. Chem. Soc. 2017, 139, 1207−1214.
(10) Lin, K.; Gómez-Bombarelli, R.; Beh, E. S.; Tong, L.; Chen, Q.; Valle, A.; Aspuru-Guzik, A.; Aziz, M. J.; Gordon, R. G. A Redox-Flow Battery with an Alloxazine-Based Organic Electrolyte. Nat. Energy 2016, 1, 16102.
(11) Beh, E. S.; De Porcellinis, D.; Gracia, R. L.; Xia, K. T.; Gordon, R. G.; Aziz, M. J. A Neutral pH Aqueous Organic-Organometallic Redox Flow Battery with Extremely High Capacity Retention. ACS Energy Lett. 2017, 2, 639−644.
(12) Orita, A.; Verde, M. G.; Sakai, M.; Meng, Y. S. A Biomimetic Redox Flow Battery Based on Flavin Mononucleotide. Nat. Commun. 2016, 7, 13230.
(13) Milshtein, J. D.; Kaur, A. P.; Casselman, M. D.; Kowalski, J. A.; Modekrutti, S.; Zhang, P. L.; Harsha Attanayake, N.; Elliott, C. F.; Parkin, S. R.; Risko, C.; Brushett, F. R.; Odom, S. A. High Current Density, Long Duration Cycling of Soluble Organic Active Species for Non-Aqueous Redox Flow Batteries. Energy Environ. Sci. 2016, 9, 3531−3543.
(14) Elgrishi, N.; Rountree, K. J.; McCarthy, B. D.; Rountree, E. S.; Eisenhart, T. T.; Dempsey, J. L. A Practical Beginner’s Guide to Cyclic Voltammetry. J. Chem. Educ. 2018, 95, 197−206.
(15) Hendriks, K. H.; Robinson, S. G.; Braten, M. N.; Sevov, C. S.; Helms, B. A.; Sigman, M. S.; Minteer, S. D.; Sanford, M. S. High-Performance Oligomeric Catholytes for Effective Macromolecular
Separation in Nonaqueous Redox Flow Batteries. ACS Cent. Sci. 2018, 4, 189−196.
(16) Bard, A. J. Electrochemical Methods: Fundamentals and Applications, 2nd ed.; Wiley: New York, 2001.
(17) Zoski, C. G. Handbook of Electrochemistry; Elsevier, 2007. (18) El-Deab, M. S.; Ohsaka, T. Quasi-Reversible Two-Electron Reduction of Oxygen at Gold Electrodes Modified with a Self-Assembled Submonolayer of Cysteine. Electrochem. Commun. 2003, 5, 214−219.
(19) Koryta, J.; Dvorak, J.; Kavan, L. Principles of Electrochemistry, 2nd ed.; John Wiley & Sons Inc., 1993.
(20) Lee, K. J.; Gruninger, C. T.; Lodaya, K. M.; Qadeer, S.; Griffith, B. E.; Dempsey, J. L. Analysis of Multi-Electron, Multi-Step Homogeneous Catalysis by Rotating Disc Electrode Voltammetry: Theory, Application, and Obstacles. Analyst 2020, 145, 1258.
(21) Tong, L.; Goulet, M.-A.; Tabor, D. P.; Kerr, E. F.; De Porcellinis, D.; Fell, E. M.; Aspuru-Guzik, A.; Gordon, R. G.; Aziz, M. J. Molecular Engineering of an Alkaline Naphthoquinone Flow Battery. ACS Energy Lett. 2019, 4, 1880−1887.
(22) Heinze, J. Cyclic Voltammetry-“Electrochemical Spectroscopy”. New Analytical Methods (25). Angew. Chem., Int. Ed. Engl. 1984, 23, 831−847.
(23) Rice, R. J.; Pontikos, N. M.; McCreery, R. L. Quantitative Correlations of Heterogeneous Electron-Transfer Kinetics with Surface Properties of Glassy Carbon Electrodes. J. Am. Chem. Soc. 1990, 112, 4617−4622.
(24) Kneten, K. R.; McCreery, R. L. Effects of Redox System Structure on Electron-Transfer Kinetics at Ordered Graphite and Glassy Carbon Electrodes. Anal. Chem. 1992, 64, 2518−2524.
(25) Cook, S. K.; Horrocks, B. R. Heterogeneous Electron-Transfer Rates for the Reduction of Viologen Derivatives at Platinum and Bismuth Electrodes in Acetonitrile. ChemElectroChem 2017, 4, 320− 331.
(26) Wightman, R. M.; Wipf, D. O. High-Speed Cyclic Voltammetry. Acc. Chem. Res. 1990, 23, 64−70.
(27) Wipf, D. O.; Wightman, R. M. Submicrosecond Measurements with Cyclic Voltammetry. Anal. Chem. 1988, 60, 2460−2464.
(28) Wipf, D. O.; Wightman, R. M. Voltammetry with Micro-voltammetric Electrodes in Resistive Solvents Under Linear Diffusion Conditions. Anal. Chem. 1990, 62, 98−102.
(29) Andrieux, C. P.; Garreau, D.; Hapiot, P.; Pinson, J.; Savéant, J. M. Fast Sweep Cyclic Voltammetry at Ultra-Microelectrodes. J. Electroanal. Chem. Interfacial Electrochem. 1988, 243, 321−335.
(30) Wipf, D. O.; Kristensen, E. W.; Deakin, M. R.; Wightman, R. M. Fast-Scan Cyclic Voltammetry as a Method to Measure Rapid Heterogeneous Electron-Transfer Kinetics. Anal. Chem. 1988, 60, 306−310.
(31) Fortgang, P.; Amatore, C.; Maisonhaute, E.; Schöllhorn, B. Microchip for Ultrafast Voltammetry. Electrochem. Commun. 2010, 12, 897−900.
(32) Robinson, R. S.; McCreery, R. L. Submicrosecond Spectroelec-trochemistry Applied to Chlorpromazine Cation Radical Charge Transfer Reactions. J. Electroanal. Chem. Interfacial Electrochem. 1985, 182, 61−72.
(33) Forster, R. J.; Faulkner, L. R. Electrochemistry of Sponta-neously Adsorbed Monolayers. Equilibrium Properties and Funda-mental Electron Transfer Characteristics. J. Am. Chem. Soc. 1994, 116, 5444−5452.
(34) Wang, W.; Fan, X.; Liu, J.; Yan, C.; Zeng, C. Temperature-Related Reaction Kinetics of the Vanadium(IV)/(V) Redox Couple in Acidic Solutions. RSC Adv. 2014, 4, 32405−32411.
(35) Nicholson, R. S. Theory and Application of Cyclic Voltammetry for Measurement of Electrode Reaction Kinetics. Anal. Chem. 1965, 37, 1351−1355.
(36) Luo, J.; Sam, A.; Hu, B.; DeBruler, C.; Wei, X.; Wang, W.; Liu, T. L. Unraveling pH Dependent Cycling Stability of Ferricyanide/ Ferrocyanide in Redox Flow Batteries. Nano Energy 2017, 42, 215− 221.
ACS Nano www.acsnano.org Perspective
https://dx.doi.org/10.1021/acsnano.0c01281
ACS Nano2020, 14, 2575−2584
(37) Lavagnini, I.; Antiochia, R.; Magno, F. An Extended Method for the Practical Evaluation of the Standard Rate Constant from Cyclic Voltammetric Data. Electroanalysis 2004, 16, 505−506.
(38) Wei, C.; Rao, R. R.; Peng, J.; Huang, B.; Stephens, I. E. L.; Risch, M.; Xu, Z. J.; Shao-Horn, Y. Recommended Practices and Benchmark Activity for Hydrogen and Oxygen Electrocatalysis in Water Splitting and Fuel Cells. Adv. Mater. 2019, 31, 1806296.
(39) Rheinländer, P. J.; Herranz, J.; Durst, J.; Gasteiger, H. A. Kinetics of the Hydrogen Oxidation/Evolution Reaction on Polycrystalline Platinum in Alkaline Electrolyte Reaction Order with Respect to Hydrogen Pressure. J. Electrochem. Soc. 2014, 161, F1448− F1457.
(40) Janoschka, T.; Martin, N.; Hager, M. D.; Schubert, U. S. An Aqueous Redox-Flow Battery with High Capacity and Power: The TEMPTMA/MV System. Angew. Chem., Int. Ed. 2016, 55, 14427− 14430.
(41) Ding, Y.; Zhao, Y.; Li, Y.; Goodenough, J. B.; Yu, G. A High-Performance All-Metallocene-Based, Non-Aqueous Redox Flow Battery. Energy Environ. Sci. 2017, 10, 491−497.
(42) Sawant, T. V.; McKone, J. R. Flow Battery Electroanalysis. 2. Influence of Surface Pretreatment on Fe(III/II) Redox Chemistry at Carbon Electrodes. J. Phys. Chem. C 2019, 123, 144−152.
(43) Darling, R. M.; Gallagher, K. G.; Kowalski, J. A.; Ha, S.; Brushett, F. R. Pathways to Low-Cost Electrochemical Energy Storage: A Comparison of Aqueous and Nonaqueous Flow Batteries. Energy Environ. Sci. 2014, 7, 3459−3477.
(44) Aaron, D. S.; Liu, Q.; Tang, Z.; Grim, G. M.; Papandrew, A. B.; Turhan, A.; Zawodzinski, T. A.; Mench, M. M. Dramatic Performance Gains in Vanadium Redox Flow Batteries Through Modified Cell Architecture. J. Power Sources 2012, 206, 450−453.
(45) Aaron, D.; Tang, Z.; Papandrew, A. B.; Zawodzinski, T. A. Polarization Curve Analysis of All-Vanadium Redox Flow Batteries. J. Appl. Electrochem. 2011, 41, 1175.
(46) Milshtein, J. D.; Tenny, K. M.; Barton, J. L.; Drake, J.; Darling, R. M.; Brushett, F. R. Quantifying Mass Transfer Rates in Redox Flow Batteries. J. Electrochem. Soc. 2017, 164, E3265−E3275.