An Analysis on Information Diffusion
by Retweets in Twitter
by
Tomoaki Sakamoto
B.A., Economics, University of Tokyo (2004)
M.S., Applied Mathematics and Statistics,
State University of New York at Stony Brook (2012)
ARCtiVNEs
MASSACHUSETTS INSTITUTE OF TECHNOLOLGY
OCT 09 2014
LIBRARIES
Submitted to the Computation for Design and Optimization
in partial fulfillment of the requirements for the degree of
Master of Science in Computation for Design and Optimization
at the
MASSACHUSETTS INSTITUTE OF TECHNOLOGY
February 2015
@
Massachusetts Institute of Technology 2015. All rights reserved.
Signature redacted
A uthor ...
Computation for Design and Optimization
Sep
Certified by
...
Signature redacted
I...--Certified by...
Associate
AcceDted by.
tember 17, 2014
Roy E. Welsch
Professor of Statistics and Management Science
and Engineering Systems
TJb9s
Supervisor
Signature redacted
...
...
...
Youssef M. Marzouk
Professor of Aerona
nd Astronautics
Reader
Signature redacted
cas
Hadjiconstatinou
An Analysis on Information Diffusion
by Retweets in Twitter
by
Tomoaki Sakamoto
Submitted to the Computation for Design and Optimization on September 17, 2014, in partial fulfillment of the
requirements for the degree of
Master of Science in Computation for Design and Optimization
Abstract
This dissertation examines retweeting activities as the information spreading function of Twitter. First, we investigated what kind of features of a tweet help to get retweets. We construct a model that describes peoples' decision making on retweets, and with related observation, we show that more retweeted tweets get retweeted more. In terms of specific features of tweets, it has been shown that the number of followers and the number of retweets are positively correlated, and hashtags attract more retweets than the tweets without hashtags. On the other hand, we also found that including hashtags and getting one or more retweets are statistically independent. Moreover, we showed including URLs or user-mentions in tweets and getting one or more retweets are statistically independent. In our results, including a picture is slightly effective to get this sense of retweetability. Second, we compare the retweeters of tweets including a picture and only text, especially focusing on distance from the original tweeters. Comparing the ratio of retweets by followers of the author of the original tweets among the initial 50 retweets, tweets with a picture have a slightly lower ratio, though there is no significant difference between the average for tweets with pictures and without pictures at the 95% significance level. We also investigate how many retweets are posted by users in followers' network connected to the original tweeter, and show that the depths of retweeters' network for tweets with picture have larger variance than that of tweets without pictures. This result implies that a tweet including picture can reach more people than a tweet without a picture potentially.
Thesis Supervisor: Roy E. Welsch
Title: Professor of Statistics and Management Science and Engineering Systems
Acknowledgments
I am deeply thankful for all of the interactions with and help given by people at MIT. First, I would like to thank my supervisor, Professor Roy E. Welsch. I could not have completed this thesis without Prof. Welsch's guidance and support. I appreciate all of his helpful advice and patience. I am also very grateful to Professor Tauhid Zaman. He gave me the initial idea of my research. Without his advice, I couldn't start my work smoothly.
I am truly thankful to Professor Nicolas Hadjiconstantinou, the Director of CDO
program, for accepting my status of thesis research in absentia. In addition, Barbara Lechner, Debra Blanchard, and Kate Nelson, the former and current CDO admin-istrators always helped and encouraged me at every procedures. I could not have completed my work without them.
I would like to thank many of the students I've met at MIT for exciting and insightful
discussions. They gave me plentiful knowledge and clues to the next step in my work.
I am really grateful to have a chance to meet and talk with them.
Finally, I would like to thank my parents for their endless supports throughout my time at MIT, and long before then.
Contents
1 Introduction
1.1 Background and Motivation . . . . 1.2 Literature Review . . . .
1.3 Overview. . . . . 2 A Decision Making Model for Retweeting
2.1 D efinitions . . . . 2.2 Model Analysis . . . . 2.2.1 Description of a Retweet Network . . . . 2.2.2 Growth Dynamics of Retweet Network . . . .
2.3 Observation of retweet network . . . .
3 Observations on Retweetability
3.1 Data Overview . . . .
3.1.1 Data Resources . . . .
3.1.2 Data Description . . . .
3.2 Retweet-related observation via Streaming API
3.3 Specific features of tweets and retweetability . . .
3.3.1 Observation and Experiments . . . .
4 Retweets of picture tweets and the followers' networks 4.1 Concepts and Hypothesis . . . . 4.2 Data description . . . . 13 13 15 18 21 21 23 23 23 29 33 . . . . 33 . . . . 33 . . . . 36 . . . . 37 . . . . 46 . . . . 46 59 59 61
4.3 Results . . . . 62
4.3.1 Retweets by the direct followers of the original tweeter . . . . 64 4.3.2 Retweets by followers' network . . . . 66
4.3.3 Lengths of retweeters' trees . . . . 72
4.4 Interpretation and Discussion . . . . 74
5 Conclusion and Future work 79
5.1 Retweetability . . . . 79 5.2 Comparison of text-only tweets and tweets with a picture . . . . 79 5.3 Future work . . . . 80
List of Figures
2-1 Relationship between a tweet and a retweet . . . . 22
2-2 Simple case of a retweet network . . . . 22
2-3 An invalid case of a retweet . . . . 23
2-4 Degree distribution of 9 sample trending topics . . . . 30
3-1 Time series plot of the volume of Tweets and Retweets (1) . . . . 38
3-2 Time series plot of the volume of Tweets and Retweets (2) . . . . 39
3-3 Time series plot of the volume of Tweets and Retweets (3) . . . . 40
3-4 Time series plot of the volume of Tweets and Retweets (4) . . . . 41
3-5 Growth rate of retweets in one hour (2000 over RT count) . . . . 44
3-6 Growth rate of retweets in one hour (2000-5000 RT count) . . . . 44
3-7 Growth rate of retweets in one hour (5,000-15,000 RT count) . . . . . 45
3-8 Growth rate of retweets in one hour (15,000- RT count) . . . . 45
3-9 Log-log scatter plot with box-plot of followers count and retweet count 47 4-1 Examples of followers' network of retweeters . . . . 61
4-2 Examples of actual followers' network of retweeters . . . . 63
4-3 Retweets by direct followers of the original tweeter . . . . 65
4-4
Q-Q
plot for the log of the number of retweets by the direct followers of the original tweeter . . . . 664-5 Histogram of #Retweeters within followers' network (text-only) (1) 68
4-6 Histogram of #Retweeters within followers' network (text-only) (2) 69
4-7 Histogram of #Retweeters within followers' network (picture) (1) . 70
4-9 Outsider Retweeters . . . . 73
4-10 Lengths of network . . . . 73
List of Tables
3.1 Tweet Data provided via Streaming or Search API . . . . 34
3.2 Retweet Data provided via Streaming or Search API . . . . 35
3.3 Trend Data provided via REST API for trend . . . . 36
3.4 Tweet and Retweet Volume (proportion) on each day . . . . 37
3.5 Retweet count and Frequency . . . . 42
3.6 Retweet count and Followers . . . . 48
3.7 The volume of Tweet and Retweet (proportion) on each day . . . . . 49
3.8 Proportion of Tweet and Retweet including Hashtags on each day 50 3.9 Tweet Volume table for calculating Chi-square statistic (Hashtag) 50 3.10 P(RIH) and P(RII) Ratios (Hashtags) . . . . 51
3.11 Chi-square statistic (Hashtags) . . . . 51
3.12 Tweet Volume table for calculating Chi-square statistic (URLs) . . . 52
3.13 P(RIU) and P(RIU) Ratios (URLs) . . . . 52
3.14 Chi-square statistic (URLs) . . . . 53
3.15 Tweet Volume table for calculating Chi-square statistic (User-mentions) 54 3.16 P(RIM) and P(RIff) Ratios (User-mentions) . . . . 54
3.17 Chi-square statistic (User-mentions) . . . . 55
3.18 Tweet Volume table for calculating Chi-square statistic (Pictures) . . 56
3.19 P(RII) and P(RII) Ratios (Pictures) . . . . 56
4.1 Summary of the distribution of the number of retweets by the direct followers . . . . 66
4.2 Summary of retweeters' network . . . . 72
4.3 Summary of the lengths of the retweeters' network connected to the original tweeter . . . ... . . . . 72
4.4 The number of retweeters with each distance from the original tweeter
(Text-only) (1) . . . . 75
4.5 The number of retweeters with each distance from the original tweeter
(Text-only) (2) . . . . 76
4.6 The number of retweeters with each distance from the original tweeter
(Picture) (1) . . . . 77
4.7 The number of retweeters with each distance from the original tweeter
(Picture) (2) . . . . 78
Chapter 1
Introduction
1.1
Background and Motivation
Information diffusion in the Internet has recently received broad attention due to its rapidly growing influence on the real world. Today, utilizing social network services and microblogging services effectively is the key to success in advertising and public relations. Twitter is one of the most popular microblogging services. It was launched in July 2006 and has grown rapidly. In an article published in "The Telegraph", on
23 Feb 2010, Claudine Beaumont wrote "In 2007, around 5,000 tweets were sent per
day, with that increasing to 300,000 messages per day in 2008. The number of tweets sent last year grew by 1,400 per cent, to around 35 million per day, and that figure now stands at 50 million tweets sent per day." According to Lee et al. (2011), "as of June 2011, about 200 million tweets are being generated every day." These resources commonly state the rapid growth of Twitter. In terms of the number of users, 500 million accounts were registered in 2012 including many public figures and celebrities including the U.S. President and movie stars. Many global public presses also have their Twitter accounts. Twitter is also utilized for business by small and large en-terprises. According to Alexa traffic ranks, Twitter is ranked as the 9th most-viewed website. Its large amount of users and their tweets enable us to observe people's
Twitter is not only a popular website, but also a type of media having interactions with the real world. Users can post a message, URLs, photos, and movies which reflect real-world incidents, and the information in the post can spread out, and let the viewers know something which they didn't notice by themselves. Additionally, sometimes it can stimulate viewers to react. In this sense, information diffusion in Twitter can affect people's decision-making.
Now, Twitter is a powerful tool for spreading information. In fact, Twitter is used for many types of announcements, advertisements, and breaking news. A public re-lations officer of a local government might want to make an announcement for some community event in that area, or some regional useful news. A museum curator can be interested in letting people know about a new exhibition. Some researchers no-tify their latest presentation documents through posting its URL on Twitter. Actors might try to spread their event notification as well.
Under a disaster, local and real-time information can be a key to be safe or to sur-vive. There is possibility that confusing information also appears during crises from both the affected area and outside. Sakaki et al(2010) used Twitter as a sensor of earthquake, and developed a system which notifies people promptly of an earthquake. Twitter changed news media or journalism in some sense. Today, traditional news media including CNN and BBC have their own Twitter accounts, and broadcast their news through Twitter. In addition to this, Twitter has become a catalyst letting peo-ple know breaking news. As famous instances which spread out via Twitter, Kwak et al.(2010) mentioned a case of an American student jailed in Egypt and the US Airways plane crash on the Hudson river. Hu et al.(2012) investigated how the news broke and spread on Twitter. They noticed that the news of Osama Bin Laden's death spread rapidly with a tweet created by U.S. President Barack Obama on May 1st in 2011. Moreover, Petrovic et al.(2013) pointed out that Twitter has an advan-tage of local information in comparison to newswires.
There are some reasons why information spreading in Twitter is important. 14
First, information on Twitter is mostly aggregated in one viewer that is called as "Timeline," though websites of traditional media have a lot of pages. In Twitter, users can see any information which is posted by other Twitter accounts that the user follows.
Second, one of the characteristics of Twitter is its real-time nature. This point is related with breaking news on Twitter.
Finally, Twitter is a community platform which is supported by users' connection. This means spread information can potentially become prevalent among those com-munities as a kind of common information.
For all these reasons, Twitter has become a strong tool for spreading information. In this work we focus on how to accelerate this function of Twitter.
Especially, retweet is a function to forward a tweet which is posted by another user. Tweets are usually seen by the followers of the user who posted those tweets. If those tweets are retweeted by another user, they are also seen by the followers of the user who did the retweets in addition to the followers of the original tweeter. Thus, retweets enable users to spread the original tweets. Obviously, a tweet which is retweeted hundreds of times will be exposed to hundreds of thousands of people. If a tweet is retweeted thousands of times, some other web-based media may cite it, and its information will spread more. In this work, we mainly focus on retweeting activity.
1.2
Literature Review
In fact, considerable attention has been paid to the research of retweeting behaviors on Twitter. Kwak et al. (2010) studied audience size of retweets, characteristics of retweet trees, and time-series observation of retweets. According to their observation in 2009, any retweeted tweet is to reach around 1,000 users on average. In terms of the length of retweet tree, most of them have height one, and , and no trees go beyond
11 distance, and the distribution of the users in a retweet tree follows a power-law.
They also reported about 50% of retweets are posted in one hour after the original tweet was created, and 75% are posted in one day, while 10% are posted one month later. Note that those "retweets" are not exactly the same with built-in feature of retweets in the current user-interface of Twitter. These observations above are still useful to consider the characteristics of retweeting behavior, however, they might have changed today.
Boyd et al. (2010) focused on conversational aspect of retweeting, and investigated the practices of retweets. They qualitatively classified and listed the reasons why people retweet; to amplify or spread tweets to new audiences, to publicly agree with someone, to validate others' thoughts, and so on. They also examined what people retweet; for showing that they are the audience of the original tweet, and for encour-aging social actions including raising funds and demonstration of collective group identity-making, and requesting help. Additionally, they reported 52% of retweets contain a URL, and 18% of retweets contain a hashtag. While their analysis above is insightful to consider retweet as a built-in function of Twitter, their main attention was paid for manually created retweets. For example, in built-in retweet syntax of a retweet is identified, and users are not able to retweet tweets posted by themselves. Suh et al. (2010) investigated features that affect retweetability to understand why certain tweets spread more widely than others. They examined both manual retweets and built-in retweets. They found that URLs and hashtags have strong relationships with retweetability, and the number of followers and followees, and the age of the account also affects the retweetsbility, while the number of past tweets does not have influence on retweetability of a user's tweet.
Yang et al. (2010) investigated retweeting behaviors by focusing on features of users and contents of tweets. Based on their observations, most users retweet at a low frequency and only a few users are retweet-aholic. In their data, the average number of retweets of a user within seven days is 197, and only 3.13% of the retweets are
posted by users who retweet more than 1,000 times. Many users post far more tweets than retweets, but retweet-aholics post many fewer tweets than retweets. In terms of contents, they showed that users tend to retweet the messages that contain what they are interested in.
Nagarajan et al. (2010) discussed retweet behavior by connecting them to real-world events. By observing samples of popular tweets, they found that tweets calling for social action, crowdsourcing, or collective group identity-making tend to generate a sparse retweeters' network, i.e., the retweets are not necessarily connected to the orig-inal tweets. On the other hand, tweets sharing information generate a dense retweet-ers' network. In other words, the retweets are connected to the original author. They explicitly recognized this type of tweet as sharing information by containing URLs, images, and videos.
Zaman et al. (2010) utilized user IDs of the author of the original tweets and retweet-ers, the number of followretweet-ers, and the words contained in tweets to predict future retweets.
Petrovic et al. (2011) conducted a human experiment on the task of predicting whether a tweet will be retweeted or not. They found that social features of the author of a tweet including the number of followers, friends, listed are very important information to predict whether the tweet will get retweeted, while tweet features in-cluding hashtags, user mentions, and URLs are useful information.
Luo et al. (2013) analyzed who retweets other users. They found that followers who retweeted or mentioned some other users' tweets frequently before, and have common
interests are more likely to be retweeters.
In the observation by Myers et al (2014), there is partial relationship between follow-ing burst and retweets.
These studies above suggest to us insightful results. In this work, we try to re-view some of the results above, and try to provide some different re-viewpoints. The
knowledge of statistics in this work is covered in Rice (2007) unless we specify other references.
1.3
Overview
The remainder of this thesis is as follows.
In chapter 2, we formulate a model that describes individual users' decision making on tweets and retweets based on networks with preferential linking presented by Doro-govtsev et al. (2000). We discuss two versions of preferential behavior of retweeting; choosing a tweet to retweet randomly, and choosing a tweet to retweet depending on retweet count of the tweet. Our observation support the later assumption, and it implies that more retweeted tweets tend to get retweets more.
In chapter 3, we investigate the nature of retweetability by overviewing data. We start with explaining the way we construct our dataset, and provide some statistical reviews. As already pointed out by previous studies, the number of followers and hashtags tend to be related with the number of retweets. However, our experiment suggests that including hashtags, URLs, and user-mentions do not affect whether the tweet will be retweeted or not, although if those tweets have a seed of retweetability, they might get more retweets than the others. In our results, including a picture might effect retweetability slightly.
In chapter 4 we compare the tweets including pictures and those with plain texts focusing on the following relationship of retweeters. According to our observation, the variance of maximum distance of each tweet with pictures is larger than that of text-only tweet. This result implies that tweets with a picture potentially reach more distant people than text-only tweets, although tweets with a picture can stop in smaller networks.
In chapter 5, we explain our conclusion of this work. Our results imply that those who are interested in getting retweets should focus on getting initial retweets in addition
to utilizing specific features including hashtags, URLs, and pictures. By including pictures in a tweet, it might go further than tweets without pictures, while in some cases it stops in a narrower followers' network.
Chapter 2
A Decision Making Model for
Retweeting
In this chapter, we build a retweet-network model which describes individual user's decision making on tweets and retweets. We consider two possible patterns of choosing which tweet to retweet; random choosing or weighted choosing. Our observation supports the weighted choosing pattern, and this result implies that more retweeted tweets tend to get retweeted more.
2.1
Definitions
In this model, we regard the relationship between tweets and retweets as a network and call this structure a retweet-network. First of all, the basic components of network structure need to be defined.
Definition 1 (Tweet) A tweet is a node which is not a starting point of a directed
edge.
No tweet has an edge which starts from it. Each tweet has its unique ID which enables us to distinguish different tweets.
Definition 2 (Retweet) A retweet is a node which is a starting point of a directed
Definition 3 (Retweet Edge) A retweet edge is a directed edge which starts from
a retweet.
Figure 2-1 shows the relationship between an original tweet and a retweet to it.
An Original Tweet
A Retweet
Figure 2-1: Relationship between a tweet and a retweet
Definition 4 (Retweet Network) A retweet network is a network whose nodes are
tweets and retweets, and whose edges are retweet edges.
Definition 5 (Degree of a tweet) Degree of a tweet is the number of retweet edges
whose end point is the tweet.
For example, in the case of figure 2-2, there is one original tweet and three retweets, and the degree of the original tweet is three.
An Original Tweet
Retweet A Retweet C
Retweet B
Figure 2-2: Simple case of a retweet network
2.2
Model Analysis
2.2.1
Description of a Retweet Network
A retweet network has two specific characteristics. First, a retweet network is not
generally connected. Thus, in many cases, we cannot calculate the cluster coefficients and average length between nodes of a whole retweet network.
Second, a retweet cannot be retweeted. Here we didn't define the degree of retweet because even if we defined it, their degrees are always one, that is, the edge whose
starting point is the retweet.
An Original Tweet
Retweet A
Retweet B
Figure 2-3: An invalid case of a retweet
2.2.2
Growth Dynamics of Retweet Network
In this analysis, we focus on the degree distribution here. The degrees of tweets are the indicators of the magnitude of the tweet influence.
We denote the tweet whose ID is i by vi, and denote its degree by ki. At each time, a user posts a tweet or retweet. Let's assume that vi enters this network at time ti.
ki grows as time passes, so we can denote ki(t), or at time t, the degree of vi is ki.
In this analysis, we think of a unit time as an interval between a post (a tweet or a retweet) and the next post.
Here we assume that at the initial time to = 0 there is one tweet as an initial condition,
and a user chooses to retweet at probability q, and choose to tweet at probability 1-q. If a user chooses to post an original tweet, one additional tweet which is a candidate of a target of a retweet is created, and if a user chooses to retweet, the degree of one of an existing original tweets increases by one. Potentially, different users have different
q. However, to simplify this model, we assume common q here. Except for this point,
this model describes directly the decision-making of tweet and retweet activity. Now, ki is the number of retweets of tweet ID i, and the distribution of k shows the tendency of retweets and their background. In order to know an approximate tendency, we make two different assumptions and test which one is more plausible. One assumption is that when a retweet is posted, the tweet which is retweeted is randomly chosen. The other assumption is that when a retweet is posted, more retweeted tweets tend to be chosen.
If the former one is true, every tweet equally get retweets. On the other hand, if the later one is true, more retweeted tweets tend to get more retweets, and then getting retweets right after it is posted is important for information spreading.
Here, we denote the probability of which vi is retweeted at time t by r(ki), and investigate the distribution of k by defining r(k) which correspond to these two assumptions. In the calculation of the degree distribution, we use the continuous approximation.
First, we consider the case in which each original tweet is randomly chosen. The number of tweets at time t = 0 is 1, and as t increases by 1, the number of tweets
increases at the probability 1 - q. Thus, the number of nodes is N - 1 when
(1 - q)t P N - 2 +
1
= N - 1.under the continuous approximation. At this time t, the probability of which vi is retweeted among N - 1 tweets at the next retweet is approximately
r (ki) q Pt: q
N - 1 (1 - q)t
This approximated probability also stands for the expectation of a retweet which the user gets at the next time step. In other words, r(ki) is interpreted as the approximation of difference between a certain time step and the next time step. Hence, when assuming t and ki are continuous, this approximation is expressed by the following differential equation.
dk~i r~ z, q
dt (1 - q)t
Here, as an initial condition, ki(ti) = 1, this equation is solved as following.
ki = log - + 1.
1 - q ti
By this ki, the distribution function of ki is calculated as following.
1 -q tj P~k
~
P<k q X1-q log-+< k-1t 1 -q tj = P log -< k -1) t-q q t [1-q = P o-< 1 (k-l)) = P- < exp (k -1) ti q = P (ti > texp qq(1 -k)]).Considering the number of tweets, it is the one at initial time t = 0, and added tweets
at probability 1 - q at each time unit, i.e., (1 - q)t +1. Among these tweets, the ones which satisfy the condition
are added after the time t exp (1 - k)] has passed. Thus, the number of tweets
which satisfy the condition above is
(I - q) (t - t exp q(1 - k)
.-Hence,
P(k(t) < k) (1 1 - exp (1 - k)
(1 - q)t +-1 ( qD
By differentiating this equation by k, the density function of the degree is calculated
as the following. p(k) = OP(ki(t) < k) (1- q)t t9 1-___ ~ a 1- exp (1- k) (1 -q)t+l8kq (1- q)t [1- q (1 qt 9exp [-q(1 - k)] (1 - q)t + 1 k q (1-q)t 1-q _-q __-q
(1q~ Iqexp 1-qexp I-q(-k)
(1-q)t+1 q q q = Oexp(-Ak), where 0 (1 - q)t 1 - q [1 - q] (1-q)t+1 q e and A=1 - q q
Therefore, by normalizing the coefficients for make p(k) a probability density function,
k follows exponential distribution.
On the other hand, the r(ki) which corresponds to the later assumption is considered as following. In this case, we apply a model which is modified version of networks
with preferential linking presented by Dorogovtsev, et al. (2000).
r (ki) q(ki + ko)
E (k +ko)'
where ko is a constant value. Under this assumption, the larger k becomes, the larger r(ki) becomes, i.e., more retweeted tweets tend to be retweeted even more. This assumption is intuitively natural because if a tweet is retweeted more times, more users should tend to notice the tweet. Similarly to the above, the number of tweets is N - 1 when
(1 - q)t ; N - 1,
and at this time,
N - 1
t
q
Then,
N-1 N -1
Ek3 (the number of all retweets at time t
N-q =1 -=qt. Hence, q(ki+ko) r(k1) = q(ki + ko) ,k+ (N -1)ko q(ki+ko) qt+(1-q)kot q(ki + ko) 1 q + (1 - q)ko t Similarly above, dki(t) q(ki+ko) 1 dt q + (1 - q)ko '
then under the initial condition ki(ti) = 1,
ki(t) = (1 + ko)- ko.
Thus,
P(ki(t) < k) = P
[(1 +
ko) q+(1 0) -)kOko
<=
P [(1+ko)
()
< k+
q+( )kO k+ko]
1 +koj
k + +ko (1-q)
1+ ko
At time t, the number of all tweets is (1 - q)t + 1. Among these tweets, the ones
which satisfy
tj > t 1 +ko q+ k
(k +ko) 1+1~2ko
time tt
Kk+koJ
1+k0 1 q has are the ones which added afterthem is
passed. Thus, the number of
(/)(t -t+k +ko (1-q) (t-t (k +ko ) ) Hence, P(ki(t) <k)
(1-q)t
(1-q)t+1
(+ko1+=ko (k+ko)Thus, the density function of k is
p(k) aP(ki (t) < k) =k _ _ (1-q)t r_ 1+k 1+ 1 ko Ok(1-q)t+1 \k[+k1o/ 1-q)t a (1-q)t + 1ak
(
1+k0 1qkok + ko)
k] ko] 28 Pt<
Iti 1~i>tl+ ko
)1+ qko] k +ko(- q)t
(I+ ko)1+lqqko -1 (k+ko~- k(1 - q)t + 1 Ok
(1 +
1
-k)(1+
ko)1+1iiko (k + ko)-2- ko(1- q)t+1 q
ok-2- 1qko
In this case, the degree distribution of k has power law, and its parameter is 2 + 1-1ko
in this setting.
From these calculations, if the tweets to retweet are randomly chosen, the distribution of k is nearly an exponential distribution, and if more retweeted tweets tend to get more retweets, the distribution of k is close to a distribution with power-law.
2.3
Observation of retweet network
For comparing the model above and our data, we counted how many times each tweet was retweeted in each trending topic, and observed the distribution of those degrees of tweets for. each trend.
Each trending topic has its degree distribution. As examples, we show the degree distribution of 9 trending topics in Figure 2.4.
For each trending topic, the upper plot is the simple histogram of degrees, and the lower plot is the log-log plot of degrees and fitted line of a power-law.
These plots indicate that most of retweeted tweets are the retweeted just a few times, and only a few tweets are retweeted for hundreds of times. According to the cal-culation with a built-in function of the "powerlaw" module in python (Alstott et al. (2014)) with log-likelihood ratio, 2,496 in 2,508 examples are nearer the power-law distribution than exponential distribution.
Next, we notice the fitted parameters of the power-law. The average value of param-eters is 3.822, the median is 2.664, standard deviation is 11.1018, the minimum value
(a) sample 1 (b) sample 2 (c) sample 3
2000 Histogram Histogram 200 Histogram
1600 1500
I
~'1200
1400 150 1000 1o00 IF500 g~400
6 5 200 0 1000 2000 3000 4000 5000 6000 7000 0 50 100 150 200 250 300 350 400 0 20 40 60 80 100 120 140degrees of tweets degrees of tweets degrees of tweets
100 Log-log plot of probability of degrees 10 Log-log plot of probability of degrees 108 Log-log plot of probability of degrees
o-
observation 10- - observations 1 4 - observation
10 - - fitted line 10 - -fitedline 102 - , - - fitted line
100 10
IT Z
'e 10-3
-10 101 2 3 e 4 110' 102 so3 ITO 101 102 1-3
degrees of tweets degrees of tweets degrees of tweets
(d) sample 4
(e) sample 5 (f) sample 6
1200 raistogram 1000 1400 gm Histogram 00 1200 3000 600 1000 2500 400 am 2000 d s w0 0 0 400 1000 200 500 0 100 200 3000 40 AO degrees of rweets 20 40 60 80 100 120 140 160 0 100 200 300 4 ;0 5
0 Log-log plot of probability of degrees degrees of tweets degrees of tweets
10 "S, -Log-log - bsrvations 1 plot of probability of degrees 10* Log-log plot of probability of degrees
102 - - fitted line 1ut - observation 10-1 - observations
13 e 10.' 3.-1
fitted line 10 fitted line
10-5 4 0 io 6 ,0 -105 100 101 102 10 3 le 10's 2 I degrees of tweets 100 10 10 2 3 10' 101 102 10' (g) sample 7 Hstogram degrees of tweets (h) sample 8 Hast ram degrees of tweets (i) sample 9 Hist rm 200 403D 400 15 350 2500 30
I
2000 100 200 1500 g150 los00 50 5000
10
2W 400 500 0 50 100 150 200 25 0 200 400 600 Bo0 1000degrees of tweets degrees of tweets degrees of tweets
Lng-log plot of probability of degrees Log-log plot of probability of degrees Log-log plot of probability of degrees
observation 10 - observation 10' - observati
101Si -2 ne
102 -- ftted line -- fitted line -- fitted line
10 10"
10 1
10-1 0 -0 1 010
10 "' 10' ''d S
100 M12 101 101 102
degrees of tweets degrees of tweets degrees of tweets
Figure 2-4: Degree distribution of 9 sample trending topics
30
0
3
Cr
is 1.264, and the maximum is 531.722.
In fact, the number of the trending topics whose parameters are greater than 10 is 87 in 2,508 (3.47%). The number of topics whose parameters are in the range of (2,4) is 1, 750 in 2, 508 (69.78%). These values do not contradict the calculation in the former section.
These results above support the statement that more retweeted tweets get retweeted more.
Chapter 3
Observations on Retweetability
In this chapter, we explain our data resources and observation of specific features of tweets mainly related to retweetability. As related work has already pointed out, the number of followers and the number of retweets are positively correlated, and hashtags attract more retweets than the tweets without hashtags. On the other hand, we found that including hashtags and getting 1 or more retweets are statistically independent. Moreover, we showed including URLs or user-mentions in tweets and getting 1 or more retweets are statistically independent. In our results, including a picture is slightly effective for increasing retweetability.
3.1
Data Overview
3.1.1
Data Resources
In order to build our dataset, we utilized two types of publicly open APIs provided
by Twitter officially: Streaming API and REST API. 1 The available data with each API is as follows.
Streaming API
Streaming API with "GET statuses/sample" returns a small random sample of all public statuses. This API provides three types of data: Tweet, Retweet, and Delete. Among them, we use tweets and retweets data, Both of Streaming API and Search API in REST API give us them with the same format.
Table 3.1 and 3.2 show the contents which are included in Tweet and Retweet data. The tweet (retweet) data includes the timestamp which indicates when the tweet or retweet is created, ID of the tweet or retweet, Hashtags which the message contains, and user information who posted the tweet or retweet. It also includes URLs and pictures which are linked with the post, geographic data, and language data, "fa-vorite" information, reply information. If the post is a retweet, the data provides the information of the original tweet. A retweet also has its ID as a tweet. As of the format of data, the only difference between tweets and retweets is whether it includes the retweeted (original) message or not. In this work, we mainly use tweet ID, time stamp at which the tweet created, hashtags, URL, user-mention, retweeted status data and user information.
Table 3.1: Tweet Data Category Created at Mention Hashtags URL Favorite-count Geo, ID Lang Text User
Data provided via Streaming or Search API Contents
timestamp of its creation User who mentioned the tweet
Hashtags which are included in the tweet URLs which are included in the tweet How many users favored the tweet Area where the tweet is created ID of the tweet
Language of the text Message content
The data of user who posted the tweet
3.2: Retweet Data provided via Streaming or Search API Data Category Created at Mention Hashtags URL Geo ID Retweet status Lang Text User Contents
timestamp of its creation
User who mentioned the original tweet
Hashtags which are included in the original tweet URLs which are included in the original tweet Area where the tweet is created
ID of the retweet
Tweet data of the original tweet Language of the original text
Message content of the original tweet with "RT @-userlD" at the head The data of user who posted the retweet
REST API
REST APIs of Twitter provide various types of data. The data we used in the later half of chapter 2 was built by combining the Search API and the endpoint of "GET trends
/
place" in REST APIs.The Search API returns a collection of relevant Tweets matching a specified query. This API is one of the REST APIs, and also utilized in related work. For example, Nagarajan, et al.(2010) and Asur, et al.(2011) used it. Before 2011, the version of API was 1.0. Thus, they wrote that Twitter search API gives only 1,500 tweets. This constraint has been changed and now we can access more than 1,500 tweets and retweets, though Search API doesn't necessary guarantee to collect all data of tweets which includes some specific words perfectly.
Twitter also provides 10 trending words every 5 to 10 minutes. Twitter API provides trending data for every location based on Yahoo! Where On Earth ID (WOEID), and we can choose the location. Global trend data is available by using 1 as the WOEID parameter, and we used it here. This API provides simply the names of 10 trending topics and the time stamps when the trends are created and collected. Unless Twitter service is down, we can get all trending topics technically. Table 3.3 shows the data contents of trends which we can get via Twitter REST API for trend with version
1.1.
Table 3.3: Trend Data provided via REST API for trend Data Category Contents
Created at Timestamp at which the set of the trends is created
As of Timestamp at which the set of the trends is collected
Trends Names of 10 trending topics
REST APIs provide many other resources to collect data. The endpoint of "GET statuses/show/:id" provides the detailed information of a single tweet specified by the Tweet ID. By this API, we obtained the retweet count of a tweet after a certain period of time. The endpoint of "GET statuses/retweets/:id" provides the 100 most recent retweets of the tweet specified by the Tweet ID. If we access this endpoint before the tweet gets more than 100 retweets, we can obtain the information of initial retweets. By utilizing this API, we collected the information that we used in chapter
3 and chapter 4.
3.1.2
Data Description
Before examining the data, it is useful to overview how the users uses Twitter at present (in the first half of 2014). 2
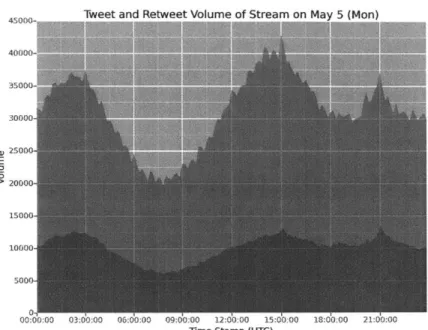
We collected the data of tweets and retweets during 7 days from May 1st(Thu) to May 7th(Wed). Table 3.4 shows the figures of the volume of tweets and retweets provided via Twitter Streaming API with version 1.1, and figure 3-1 to 3-4 show time series plots of them. We counted the volume of tweets and retweets that are posted in every 10-minute interval. Each plot consists of 2 areas. The bottom area stands for the volume of retweets, and the top area stands for the volume of tweets.
According to this data, one third of total posts are retweets, and around 15% are the tweets including hashtags. Every day around 7 a.m (UTC) the volume of tweets and
2
Twitter sometimes changes its official user interface, and it might change users' actions in Twitter, though we don't focus on that effect in this work.
retweets shrinks, and growing up until around 3 p.m. This cycle looks stable with a few exceptions. In terms of the volumes of overall tweets and retweets, it doesn't seem there is clear "day of the week effect."
Table 3.4: Tweet and Retweet Volume (proportion) on each day Date Retweet Tweet Total
May 1 (Thu) 1,442,499 2,971,892 4,414,391 (32.68%) (67.32%) (100.0%) May 2 (Ri) 1,373,268 2,907,299 4,280,567 (32.08%) (67.92%) (100.0%) May 3 (Sat) 1, 351,808 2,879,884 4,231,692 (31.94%) (68.06%) (100.0%) May 4 (Sun) 1,447,762 2,986,705 4,434,467 (32.65%) (67.35%) (100.0%) May 5 (Mon) 1,468,118 3,025,610 4,493,728 (32.67%) (67.33%) (100.0%) May 6 (The) 1,441,075 3,036,456 4,477,531 (32.18%) (67.82%) (100.0%) May 7 (Wed) 1, 411, 757 2,829,342 4,241,099 (33.29%) (66.71%) (100.0%)
3.2
Retweet-related observation via Streaming API
Streaming data provides us more information about retweets. Here, we describe the relationship with the frequency, the number of hashtags, the number of unique users, the number of followers, and embedded other media including photos and URLs. Besides, for the tweets which have the largest number of retweets, we see the growth of retweets.
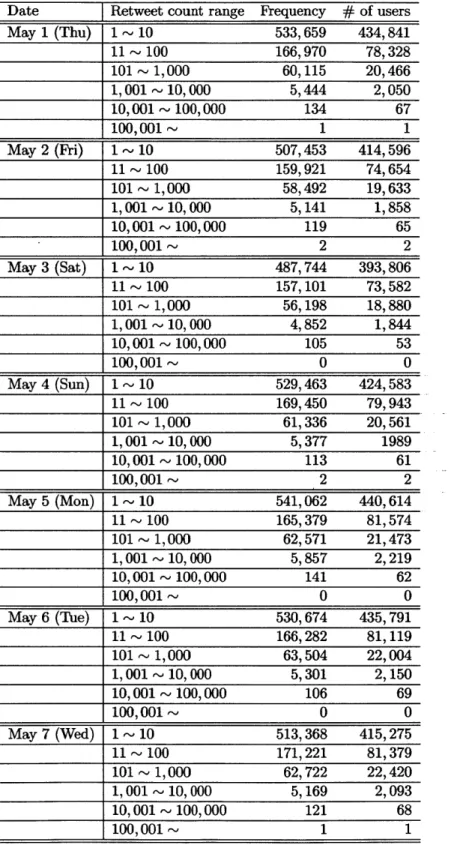
The relationship between retweet count and its frequency
Retweet count in Table 3.4 stands for the number of "retweeting" posts observed in Stream Data. On the other hand, Table 3.5 is for the "retweeted" side. In Stream Data, tweets which are retweeted for many times can appear repeatedly when the tweets which retweet the posts are caught. In table 3.5, those (retweeted) tweets are
45000- "' '""" 40000-11'l r 35000, 30000 25000 E 20000 15000 1000s 500 0 00:00:00 03:00:00 06:00:00 09:00:00 12:00:00 15:00:00 18:00:00 21:00:00
Time Stamp (UTC)
4ig e -1: Tweet and Retweet Volume of Stream on May 2 (Fri)
45000- 35000- 30000-S25000 E S2000s 15000 1000s
O-D:0 :00 03:00:00 06: 0:00 09:0 10:00 12:-A:00 15:60:00 18:dO:00 21:00:00
Time Stamp (UTC)
Figure 3-1: Time series plot of the volume of Tweets and Retweets (1)
38
45000- .. -- - % 40000: 35000-K ' 30000 l 25000 E >2000s 1500s 10000 500 0 00:00:00 03:00:00 06:00:00 09:00:00 12:00:00 15:00:00 18:00 :00 21:00:00
Time Stamp (UTC)
Tweet and Retweet Volume of Stream on May 4 (Sun)
45000-1MO 40000_ 3000s S25000 E S2000s 15000 10000 5000 00:00:00 03:00:00 06:40:00 09:40:00 12:40:00 15:dO:00 18:60:00 21:40:00
Time Stamp (UTC)
45000- 40000- 35000-30000, e 25000 E > 20000- 15000-10000, 5000-0 00:( 45000 40000 35000 30000 , 25000 E 20000 15000 10000 5000 0 00A~
Twppt and Rptwppt Voltimp nf Strpam on Mav r (Mnnl
00:00 03:00:00 06:00:00 09:00:00 12:00:00 15:00:00 18:00:00 21:00:00
Time Stamp (UTC)
Tweet and Retweet Volume of Stream on Mav 6 (Tue)
):00 12:00:00 15:
lime Stamp (UTC)
Figure 3-3: Time series plot of the volume of Tweets and Retweets (3)
Twnt and Rptwppt Vnlump of qtre;m nn Mav 7 (WPdI 50000-30000---- - -E 20000 10000
00::00 03:00:00 06:O:00 09:O0:00 12:O0:00 15:00:00 18:00:00 21:0:00 Time Stamp (UTC)
Figure 3-4: Time series plot of the volume of Tweets and Retweets (4) counted only one time with the most retweet count among the tweets with the same
ID. Table 3.5 shows that how many tweets are created and how many times they are
retweeted. Here we focused on retweeting activities in one day. For example, if a post which was created on May 1 and was retweeted 5 times during May 1st, this post is added to the frequency in the category of " 1 - 10 retweet count" on "May 1 (Thu)"
in Table 3.5.
This table also shows that how many unique users are included in each class of retweeted. On May 1, the 533,659 tweets which ended 1 ~ 10 times retweeted are posted by 434,841 unique users.
Looking at this table, the retweeting activities which are observed in Streaming Data are stable in this week.
Table 3.5: Retweet count and Frequency
Date Retweet count range Frequency
#
of users May 1 (Thu) 1 - 10 533,659 434,841 11- 100 166,970 78,328 101- 1,000 60,115 20,466 1,001 - 10,000 5,444 2,050 10,001-
100,000 134 67 100,001-
1 1 May 2 (Fri) 1 - 10 507,453 414,596 11 ~ 100 159,921 74,654 101 - 1,000 58,492 19,633 1,001 - 10,000 5,141 1,858 10,001 - 100,000 119 65 100,001- 2 2 May 3 (Sat) 1 ~ 10 487,744 393,806 11- 100 157,101 73,582 101 - 1,000 56,198 18,880 1,001 - 10,000 4,852 1,844 10,001 - 100,000 105 53 100,001 - 0 0 May 4 (Sun) 1 - 10 529,463 424,583 11 - 100 169,450 79,943 101 - 1,000 61,336 20,561 1,001 - 10,000 5,377 1989 10,001 - 100,000 113 61 100,001-
2 2 May 5 (Mon) 1 - 10 541,062 440,614 11--~100 165,379 81,574 101 - 1,000 62,571 21,473 1,001 - 10,000 5,857 2,219 10,001 - 100,000 141 62 100,001-
0 0 May 6 (Tue) 1 - 10 530,674 435,791 11'- 100 166,282 81,119 101--1,000 63,504 22,004 1,001 - 10,000 5,301 2,150 10,001 - 100,000 106 69 100,001-
0 0 May 7 (Wed) 1--10 513,368 415,275 11- 100 171,221 81,379 101 - 1,000 62,722 22,420 1,001 - 10,000 5,169 2,093 10,001 - 100,000 121 68 100,001-
1 1 42The growth of retweets for the most retweeted posts
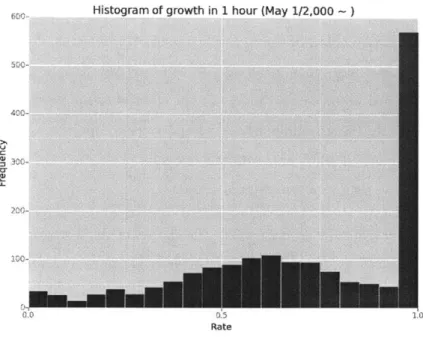
Figure 3-5 to 3-8 are the histograms that show how many tweets reached how much
% of the final retweet count of the day in one hour. For example, Figure 3.5 is for the
tweets that reached more than 2,000 retweet count on May 1st. In this figure, around
550 tweets reached 100% in one hour, though other ones axe moderately retweeted.
We did not specify these rapidly retweeted and stopped tweets. In fact, the number of tweets that reached 100% and contains enough information is 530, and the other side which has no deficit information is 1, 210.
Looking at the Figure 3-6 to Figure 3-9, the shapes of the histograms are similar to Figure 3-5. This observation implies that the growth rate of retweets does not change depending on the level of final retweet counts as much. Even though the right most cases in which 100% of retweets are made in one hour might be exceptional tweets including spam tweets, our observation shows that in more than half (retweeted) tweets, they get more than 50% retweets in one hour. This result is consistent with the result presented in Kwak et al.(2010).
All users do not necessarily see their timelines always. Users can make a retweet only
when they are watching their timelines. Thus, retweeting cascades happen only when real-time active users can see the original tweet. This implies that the number of real-time active users can be a key for information spreading by retweets. Especially, for the users who don't have a huge volume of followers, timely posts are important. If the user has millions of followers, the possibility that someone is on timeline increases naturally. However, if the user have thousands of followers, that possibility should be lower. In this case, if the users want to make their post spread as far as they can, they should be conscious of real-time active followers.
400
200
00 0.5 10
Rate
Figure 3-5: Growth rate of retweets in one hour (2000 over RT count)
Hictnnrmm nf nmrwth in 1 hn, ir tMzv 1 flAlnn - 1; nAfi
300
'ii 41L
0,0 uRat 2.0
Rate
Figure 3-6: Growth rate of retweets in one hour (2000-5000 RT count)
Rate
Figure 3-7: Growth rate of retweets in one hour (5,000-15,000 RT count)
20
4)
0~0
Rate
3.3
Specific features of tweets and retweetability
3.3.1
Observation and Experiments
Followers
Intuitively, it is natural that a user who has many followers tends to get more retweets, because those users' tweets are viewed by many people who are potential retweeters. Table 3.7 roughly shows that this intuition is true. This table shows most of tweets which are retweeted many times are created by the "giant" accounts that have a huge number of followers. Even for the tweets whose retweet count is in the rage of 1 ~ 10, the median of the number of followers is around 700.
Each original tweet data set includes its retweet count at the time that tweet was collected. The data also contains the user information about who posted the original tweet including the followers count.
Figure 3-9 shows the relationship between the retweet count and the followers count. In this scatter plot, x-axis stands for the logarithm of follower count, and y-axis stands for the logarithm of retweet count. This plot implies the positive correlation between the log of followers count and the log of retweet count. In fact, the correlation coefficient of these two variables is 0.48. This means the number of followers positively affected retweetability.
:6I 02 0o1 -:61 usi5 o2 C1 6 5 4 .* 3. 2.~ 1 2 3 4 5 6 7 8 0 1 2 3 4 5 6 7 8
LoglO of Followers count
6
3.
2.
01-123456 78
0 1 2 3 4 5 6 7 8
LoglO of Followers count
(a) May 1st 7 6-4 oi l 01 2 3 4 5 6 7 8 0 1 2 3 4 5 6 7 8
LoglO of Followers count
(c) May 3rd 7 6 4-0 1 2 3 4 5 6 7 8 0 1 2 3 4 5 6 7 8
LoglO of Followers count
(e) May 5th 7 6 5-
.7-~4.
0 02.7 03 1 001 (d) May 4th 7. 6 5 3.I 2. 1 2 3 4 5 6 7 8 C -F - F--- 1 0 1 2 3 4 5 6 7 8Log10 of Followers count
(f) May 6th
' 1 2 3 4 5 6 7 8
0 1 2 3 4 5 6 7 8
LoglO of Followers count
(g) May 7th
Figure 3-9: Log-log scatter plot with box-plot of followers count and retweet count
(b) May 2nd 7 7 6 6 0 o 5 4-3-0 1 2 l 1 1 2 3 4 5 6 7 8 0 1 2 3 4 5 7 8
LoglO of Followers count
5 6
6:4.
4- I o3 4w,7 C 5 & 0 i %; tE 4l 0o-3 Ol I 6. 02 0 02 ilkTable 3.6: Retweet count and Followers
Date Retweet count range min median mean max May 1 (Thu) 1-~10 0 665 11, 442.04 27,411,430 11 100 0 5672.5 75,510.58 41,619,664 101 1,000 0 25150.5 224,208.36 52,655,248 1,001 ~ 10,000 0 110,576.5 762,358.52 52,657,637 10,001 ~ 100,000 49 131.160 3,260,100.40 51,273,391 100,001 ~ 16,498,576 16,498,576 16,498,576 16,498,576 May 2 (Fri) 1- 10 0 682 11,736.13 30,113,411 11 100 0 5,730 76,758.13 42,784,008 101~1,000 0 21,904 225986.08 52,679,161 1,001 - 10,000 0 75,252.5 689,851.38 52,682,116 10,001 ~ 100,000 44 24,408 2, 535,188.97 51,297,967 100,001 ~ 3,183,938 9,850,031 9,850,031 16,516,124 May 3 (Sat) 1 ~ 10 0 664 11,341.61 24,003,107 11 - 100 0 4994 70303.60 42,796,820 101 ~ 1,000 0 21,584 212,077.51 42,800,892 1,001 10,000 0 81,106 754087.80 52,708,712 10,001 - 100,000 154 131,430 4115915.40 51,322,832 100,001 ~ - - -May 4 (Sun) 1 ~ 10 0 649 10460.80 16,018,437 11 ~ 100 0 4,766 66,434.67 41,693,380 101 ~ 1,000 0 21,397 202807.38 42,815,384 1,001 10,000 0 100,562 755,088.30 52,733,091 10,001 - 100,000 44 39,790 2,266,124.90 51,349,948 100,001 ~ 12,456,140 16,421,385.5 16,421,385.5 20,386,631 May 5 (Mon) 1 ~ 10 0 653 10,914.23 16,455,845 11 ~ 100 0 4,801 70144.26 41,715,758 101 ~ 1,000 0 20,213 210,255.36 42,831,974 1,001 ~ 10,000 0 69,335 621627.90 52,755,069 10,001 ~ 100,000 16 107,798.5 4,301,185.90 51,373,314 100,001
-
- - - -May 6 (The) 1 ~ 10 0 667 11507.95 21,019,730 11 ~ 100 0 4,824 71, 828.07 28,816,317 101 ~ 1,000 0 17,476 206,577.48 42,849,894 1,001 ~ 10,000 0 61,793 681,515.05 52,778,927 10,001 ~ 100,000 34 129,612 2,025,612.22 22,111,705 100,001-
- - -May 7 (Wed) 1 - 10 0 688 12,118.77 21,047,502 11 - 100 0 4825 73,097.15 41,763,478 101 - 1,000 0 15,792 199,764.46 52,802,836 1,001 ~ 10,000 0 78,711 739,920.52 52,802,140 10,001 - 100,000 67 102,847.5 2,917,596.06 51,420,025 100,001 - 16,585,689 16,585,689 16,585,689 16,585,689 48Hashtag
Tweets containing hashtags axe potentially viewed by the people outside of the fol-lowers of the tweeters. For this reason, tweets with hashtags are expected to get more retweetability than tweets without hashtags.
Table 3.7 shows the volume of tweets and retweets caught by Streaming API. In this table, "RT", "HT", and "Tw" stand for retweets, hashtags, and tweets respectively. "RT w HT" means the volume of retweets with hashtags, and "RT wo HT" means the volume of retweets without hashtags. Similarly, "Tw w HT" means the volume of tweets with hashtags, and " Tw wo HT" means the volume of tweets without hash-tags.
Table 3.7: The volume of Tweet and Retweet (proportion) on each day
Date RT w HT RT wo HT Tw w HT Tw wo HT May 1 (Thu) 301,665 1,140,834 369,303 2,602,589 May 2 (Fri) 289,216 1,084,052 352,877 2,554,422 May 3 (Sat) 279,350 1,072,458 336,110 2,543,774 May 4 (Sun) 301,978 1,145,784 348,318 2,638,387 May 5 (Mon) 307,767 1,160,351 373,193 2,652,417 May 6 (The) 305,854 1,135,221 376,571 2,659,885 May 7 (Wed) 314,606 1,097,151 351,522 2,477,820
By the observations in Table 3.7, the rate of the posts including hashtags can be
calculated. The calculated values are in Table 3.8. This table shows that retweets include more hashtags than tweets. In other words, it indirectly suggests the inter-pretation that the retweets tend to target the tweets with hashtags.
Here, we propose another aspect of retweetability with hashtags, that is, whether including hashtags increases the possibility to get at least one retweet or not. In order to examine whether this intuition is true, we compare the two ratios; P(RIH) and P(RII), where R stands for the observed number of the retweeted tweets, and
H stands for the number of the tweets with hashtags. To calculate those ratios, we