HAL Id: hal-01756799
https://hal.inria.fr/hal-01756799
Submitted on 13 Oct 2018
HAL is a multi-disciplinary open access
archive for the deposit and dissemination of
sci-L’archive ouverte pluridisciplinaire HAL, est
destinée au dépôt et à la diffusion de documents
Research (Dagstuhl Seminar 17461)
Remco Chang, Jean-Daniel Fekete, Juliana Freire, Carlos Scheidegger
To cite this version:
Remco Chang, Jean-Daniel Fekete, Juliana Freire, Carlos Scheidegger. Connecting Visualization and
Data Management Research (Dagstuhl Seminar 17461). [Research Report] 2018/8670, Dagstuhl. 2018,
pp.46–58. �hal-01756799�
Connecting Visualization and Data Management Research
Edited by
Remco Chang
1, Jean-Daniel Fekete
2, Juliana Freire
3, and
Carlos E. Scheidegger
41 Tufts University – Medford, US, [email protected] 2 INRIA Saclay – Orsay, FR, [email protected] 3 New York University, US, [email protected]
4 University of Arizona – Tucson, US, [email protected]
Abstract
This report documents the program and the outcomes of Dagstuhl Seminar 17461 “Connecting Visualization and Data Management Research”.
Seminar November 12–17, 2017 – http://www.dagstuhl.de/17461
1998 ACM Subject Classification D.1.7 Visual Programming, H.2 Database Management, H.5.2 User Interfaces, H.1.2 User/Machine Systems
Keywords and phrases Interactive data analysis, Data visualization, Visual analytics, Data management system, Systems for data science
Digital Object Identifier 10.4230/DagRep.7.11.46
1
Executive Summary
Remco Chang Jean-Daniel Fekete Juliana Freire
Carlos E. Scheidegger
License Creative Commons BY 3.0 Unported license
© Remco Chang, Jean-Daniel Fekete, Juliana Freire, and Carlos E. Scheidegger
What prevents analysts from acquiring wisdom from data sources? To use data, to better understand the world and act upon it, we need to understand both the computational and the human-centric aspects of data-intensive work. In this Dagstuhl Seminar, we sought to establish the foundations for the next generation of data management and visualization systems by bringing together these two largely independent communities. While exploratory data analysis (EDA) has been a pillar of data science for decades, maintaining interactivity during EDA has become difficult, as the data size and complexity continue to grow. Modern statistical systems often assume that all data need to fit into memory in order to support interactivity. However, when faced with a large amount of data, few techniques can support EDA fluidly. During this process, interactivity is critical: if each operation takes hours or even minutes to finish, analysts lose track of their thought process. Bad analyses cause bad interpretations, bad actions and bad policies.
As data scale and complexity increases, the novel solutions that will ultimately enable interactive, large-scale EDA will have to come from truly interdisciplinary and international work. Today, database systems can store and query massive amounts of data, including methods for distributed, streaming and approximate computation. Data mining techniques provide ways to discover unexpected patterns and to automate and scale well-defined analysis
Except where otherwise noted, content of this report is licensed under a Creative Commons BY 3.0 Unported license
Connecting Visualization and Data Management Research, Dagstuhl Reports, Vol. 7, Issue 11, pp. 46–58 Editors: Remco Chang, Jean-Daniel Fekete, Juliana Freire, and Carlos E. Scheidegger
Dagstuhl Reports
procedures. Recent systems research has looked at how to develop novel database systems architectures to support the iterative, optimization-oriented workloads of data-intensive algorithms. Of course, both the inputs and outputs of these systems are ultimately driven by people, in support of analysis tasks. The life-cycle of data involves an iterative, interactive process of determining which questions to ask, the data to analyze, appropriate features and models, and interpreting results. In order to achieve better analysis outcomes, data processing systems require improved interfaces that account for the strengths and limitations of human perception and cognition. Meanwhile, to keep up with the rising tide of data, interactive visualization tools need to integrate more techniques from databases and machine learning.
This Dagstuhl seminar brought together researchers from the two communities (visu-alization and databases) to establish a research agenda towards the development of next generation data management and interactive visualization systems. In a short amount of time, the two communities learned from each other, identified the strengths and weaknesses of the latest techniques from both fields, and together developed a “state of the art” report on the open challenges that require the collaboration of the two communities. This report documents the outcome of this collaborative effort by all the participants.
2
Table of Contents
Executive Summary
Remco Chang, Jean-Daniel Fekete, Juliana Freire, and Carlos E. Scheidegger . . . 46
Overview of Talks A Holistic Approach to Human-centric Data Exploration and Analysis Daniel Keim and Volker Markl . . . . 49
Towards making the database invisible Tiziana Catarci, Surajit Chaudhuri, Danyel Fisher, Heike Hofmann, Tim Kraska, Zhicheng Liu, Dominik Moritz, Gerik Scheuermann, Richard Wesley, Eugene Wu, Yifan Wu . . . 49
Understandability in Data Discoveries: an Integrated DB and Vis Perspective Sihem Amer-Yahia, Harish Doraiswamy, Steven Drucker, Juliana Freire, Daniel Keim, Heike Leitte, Alexandra Meliou, Torsten Möller, Thibault Sellam, Juan Soto 52 Reducing Friction in Applying Data Management for Visualization Michael Gleicher, Behrooz Omidvar-Tehrani, Hannes Mühleisen, Themis Palpanas 54 An Evaluation Methodology for Vis + DB Leilani Battle, Carsten Binnig, Tiziana Catarci, Stephan Diehl, Jean-Daniel Fekete, Michael Sedlmair, Wesley Willett . . . . 55
Community Challenges . . . 56
Conclusion . . . 57
3
Overview of Talks
3.1
A Holistic Approach to Human-centric Data Exploration and
Analysis
Daniel Keim (Universität Konstanz) and Volker Markl (TU Berlin)
License Creative Commons BY 3.0 Unported license © Daniel Keim and Volker Markl
The grand challenge of enabling human data interaction on today’s fast, diverse, uncertain datasets is to support the entire iterative data exploration and analysis process, from data preparation to modeling and visualization in a holistic, end-to-end fashion. Making the process human-centric requires novel algorithms for detecting human interests and intents, deriving system-understandable tasks from them, and executing them under the consideration of interaction and cognitive latencies. The system may also proactively determine interesting properties of the data suggesting novel directions of exploration to the human, using the processing time available before starting the interactive analysis and during cognitive breaks. The human needs to be supported and guided in all steps of the process including the data preprocessing, data analytics and task specification process, requiring various algorithms with different constraints on precision and latency.
What is needed is a language that enables the specification of the entire process. Such a specification would allow for a joint understanding of the interdisciplinary problems across the process and facilitate building systems that address the needs of both authors and consumers of interactive visualizations with respect to productivity and performance. This requires us to design a specification and a corresponding grammar, language, and algebraic behavior; a “Grand Unified Algebra”. This specification must be expressive enough to define desires and constraints on quality and performance, and to enable developers and users to iterate rapidly on design and analysis. At the same time it has to be compilable and processable by a data processing runtime engine, leveraging both well known concepts from database technology such as automatic query optimization and parallelization, transactions, and consistency, as well as addressing novel challenges such as progressive and approximative processing with performance guarantees as required by cognitive latencies (milliseconds vs seconds vs. minutes) in an iterative human data interaction process.
3.2
Towards making the database invisible
Tiziana Catarci (Sapienza University of Rome), Surajit Chaudhuri (Microsoft Research), Danyel Fisher (Microsoft Research), Heike Hofmann (Iowa State University), Tim Kraska (MIT), Zhicheng Liu (Adobe Systems Inc), Dominik Moritz (University of Washington), Gerik Scheuermann (Universität Leipzig), Richard Wesley (Tableau Software), Eugene Wu (Columbia University), Yifan Wu (University of California-Berkeley)
License Creative Commons BY 3.0 Unported license
© Tiziana Catarci, Surajit Chaudhuri, Danyel Fisher, Heike Hofmann, Tim Kraska, Zhicheng Liu, Dominik Moritz, Gerik Scheuermann, Richard Wesley, Eugene Wu, Yifan Wu
The rise of VisQL and its commercial counterpart Tableau highlight the value of a declarative visualization algebra to connect high level user task specification with the scalability and performance characteristics of data management engines. Arguably, establishing this language
abstraction enabled the sub-field of OLAP-based visual analytics to take flight–visual analytics research could be grounded in a well-defined and important task definition with the promise that performance is a non-issue, while query execution and database optimizations could be targeted towards an important application domain.
For example, a visualization can provide hints to improve the performance of the database engine. Information such as the state of the visualization, the design of the user interface, and the past behaviors of the user can be used to provide hints to the database to preempt-ively execute subqueries, overcome the cold start problem, and improve caching strategies. Similarly, a visualization can be seen as a component of a federated data management system that automatically moves data and computation between multiple machines to improve performance. Data for a visualization can be modeled as a materialized view such that when updates occur because of arrival of new data (in a real-time system) or a user’s interactions with the visualization, the federated system can automatically take care of data movement, streaming computation, and caching.
Data analysis systems designed with both database and visualization concerns in mind provide benefits beyond improvements in performance. For visualization designers and developers, an integrated system holds of promise of making the database invisible. That is, the visualization designer would prefer to not have to consider the manipulation of data in the database and in the visualization separately. Instead, with the proper language, API, and infrastructure, the visualization designer should be able to focus on design of the front-end interface without worrying about how the back-end system manages the data. Technologies that can make data management invisible to visualization designers can lead to a boom in the development of data systems in a similar way that D3 and other visualization languages have made data and visualization more accessible to the public.
There are exciting opportunities to advancing databases and visualization research in an integrated, synergistic way. However, there are also challenges and hurdles that prevent the two communities to immediate begin collaboration. These challenges stem from historical differences between the fields and gaps in needs and available technologies. In this section we explore and describe some of these challenges and possible ways to overcome them.
Challenge: Tooling
Current interactive visualizations are designed and constructed using low-level rendering libraries such as OpenGL, Java Swing, HTML Canvas or SVG, or high-level languages like D3, ggplot, Vega, VisQL, etc. These are either implemented as custom code by pulling data in memory (and thus restricted to smaller datasets), or dynamically translated to SQL in order to interoperate with existing data management systems.
How can we move from databases to data management systems for visualization? There is an impedance mismatch between languages for data visualization and data management. Databse APIs are not easy to use for visualization end-users. They do not clearly express visualization intent or state. Data queries have difficulty expressing queries that are core to visualization. And they require the visualization creator to manage issues that might be a database concern, such as where data is stored and how it is communicated. The goal is to develop a single language that allows a direct communication between visualizations and database systems. This might require a translation or even a replacement of traditional query languages such as SQL.
Challenge: Domain-Specific Operations
VizQL and OLAP offered remarkable abstractions for a specific subset of problems: data cubes, which map elegantly to core visualization types. The simple act of defining this subset of problems and drawing the connection to a subset of database queries had an immediate impact on progress in tooling, optimization, and performance. In the short-term, these observations serve as a template that may be applied to additional classes of task domains in order to draw a better understanding of the functionality and requirements that can be leveraged towards the Grand Unified Algebra. In fact a key challenge will be to uncover and identify the common analyses in order to aid the development of such an algebra.
The field of visualization is rich and diverse; different data types and computations that step away from those types are critical and important. In each of the following examples, the core challenge is to identify a crisp subset of operations that are “good enough” for a wide range of desired tasks and could possibly be implemented in an efficient manner. These operations include but are not limited to Complex Analyses (e.g. machine learning algorithms such as clustering, projection, etc.) and Time series, Sequential, Geographic, Hierarchical, Field (i.e. array-based) data manipulation. Identifying native database operations that can optimally support these common tasks in visualization is critical.
Challenge: Visualization Requirements
From the database perspective, one focus is on understanding novel and unique visualization-level requirements that current data management systems do not account for (e.g., progress-iveness) as well as opportunities that are not currently exploited (e.g., user-thinking time). The current (imperfect) model is that a user-interaction in the visualization client issues a set of queries, along with visualization-level metadata that describes the result values as well as characteristics of how the results are returned.
In addition, there are immediate and longer term primitive operations that can be optimized towards these visualization-level requirements. Visualization-level requirements can be considered as constraints that are enforced by the data management system. Some possible data-related requirements may include: perceptual accuracy, performance (latency) constraint, progressive results overtime, consistency across views, etc.
Conversely, visualization-level information offers unique opportunities for data manage-ment right now. Such information can be assumed and exploited by the data managemanage-ment system to improve performance. For example, humans operate at a longer time-scale than the underlying system. This means there is ample time between human actions (either due to articulation time, or time to decide what to do next) to anticipate and prepare the system to answer the user’s actions faster, more accurately, or with recommendations/explanations.
3.3
Understandability in Data Discoveries: an Integrated DB and Vis
Perspective
Sihem Amer-Yahia (CNRS), Harish Doraiswamy (New York University), Steven Drucker (Microsoft Research), Juliana Freire (New York University), Daniel Keim (Universität Kon-stanz), Heike Leitte (TU Kaiserslautern), Alexandra Meliou (University of Massachusetts), Torsten Möller (Universität Wien), Thibault Sellam (Columbia University), Juan Soto (TU
Berlin)
License Creative Commons BY 3.0 Unported license
© Sihem Amer-Yahia, Harish Doraiswamy, Steven Drucker, Juliana Freire, Daniel Keim, Heike Leitte, Alexandra Meliou, Torsten Möller, Thibault Sellam, Juan Soto
The overarching goal of human-data interaction systems is to simplify data analysis and make it accessible to a broad audience. These systems have evolved to provide access to a large range of statistical tools, interaction methods, and visualization facets, while automating many of the steps of the analysis process. The democratization of complex analysis tools through simple and accessible interfaces has enabled scientists and other experts to work more efficiently, and has allowed non-experts to partake in data discoveries.
Human-data interaction systems have simplified access to this array of powerful tools and would realize their full potential if they made those tools more understandable. Today, while users are able to interact with and analyze datasets faster and more easily, they often have a poor understanding of the steps involved in the analysis, and thus a poor understanding of the derived insights. As a result, human-data interaction systems face two important problems: (1) Users tend to rely on a very small subset of the analysis tools that these systems offer (and, typically, the less sophisticated ones, as those are more understandable). Thus, users fail to take advantage of the full power and capabilities of these systems. (2) The easy access to tools they understand poorly, can easily lead users to misuse, faulty workflows, and false discoveries. This problem is exacerbated with the automation of steps of the analysis process, as humans cannot easily process and critically reason about large numbers of derived steps and outcomes.
Understandability is thus a critical part of the data discovery process, and human-data interaction systems cannot push towards the goal of democratizing data analysis without support for understandability of the analysis steps. Supporting understandability in data discoveries involves several challenges, such as deriving the proper models and abstractions for explanation support in visual analytics, implementing “safety belts” to guard against tool misuse, and dealing with the computational and semantic explosion of the search space for explanations and hypotheses.
Challenge: Foundations for Understandability
This challenge addresses the essential question of what is understandability, how to capture it and how to convey it to different audiences, be they novice users, data scientists, or domain experts. Understandability can be approached from different angles and with different goals. It could serve the purpose of unveiling the relationship between input and output data, revealing underlying variables and models, explaining a decision process, or comparing different datasets and decisions. Understandability may be about exposing a statistical bias, a cognitive bias (e.g., confirmation bias), a perceptual bias, a method bias such as model selection, or a bias in the input data itself.
Understandability has been addressed extensively in the database and in the visualization communities with different goals and semantics.
For instance, in DB, perturbation analysis, outlier explanations, data cleaning, and provenance, are all forms of explanation. In the viz community, sensitivity analysis and looking for variables that cause bias. To understand anything, users need to be guided through a discovery process which itself requires to formalize different notions of understandability. The difficulty here is to devise a single, sufficiently expressive formalism to capture the different notions of understandability described above.
Challenge: Guiding and Guarding for (Genuine and False) Discoveries
Data analysis tools should help users from all backgrounds gain insights and draw conclusions from their data, by providing them with intuitive and systematic data exploration tool. This task is a challenge because many errors and biases can creep in the analysis. The statistics literature teaches us no dataset is unbiased, that correlation is not causation, that patterns can emerge out of sheer chance and that Simpson’s paradox should be accounted for. And yet, no analyst is immune to mistakes and oversight. The challenge, as we see it, is: how do we provide data analysts of all levels of literacy more power while ensuring that the exploration is safe?
The problem can be addressed at different levels. One way is to design data analysis tools that are inherently safe given assumptions on the user’s literacy. Another approach is to augment data analysis software with model checking primitives, to issue warnings when hypotheses are not fulfilled and highlight potential interpretation pitfalls. More generally, a pedagogy challenge is necessary to educate users for whom statistics is not a priority about common pitfalls and fallacies.
Challenge: Addressing Computational and Semantic Explosion
When it comes to enabling understandability and guiding and guarding for discovery, there is a combinatorial explosion that presents numerous challenges. Scalability only exacerbates this problem. For example, when understandability is about exposing relationships between inputs and outputs the explosion arises in the varying ways that data can be sliced and the varying semantics that reflect understandability. The exponential nature of this explosion raises both computational and semantic challenges.
Today, database and visualization research communities have developed pruning strategies and indexing mechanisms to reduce the complexity in exploring different data subsets. Human analysts have innate limitations when it comes to making sense of very large number of alternative semantics for understandability and the decoding of visualizations.
Database techniques for scalability can be used to provide different explanations/biases via guided interactions, faceted search, hypothesis testing and validation. From the visualization perspective, designers need to develop visualizations that can cope with the vast space of hypotheses and enable humans to best interpret what is observed.
3.4
Reducing Friction in Applying Data Management for Visualization
Michael Gleicher (University of Wisconsin-Madison), Behrooz Omidvar-Tehrani (LIG-Grenoble), Hannes Mühleisen (CWI), Themis Palpanas (Paris Descartes University)
License Creative Commons BY 3.0 Unported license
© Michael Gleicher, Behrooz Omidvar-Tehrani, Hannes Mühleisen, Themis Palpanas
Data visualization authors struggle to integrate data management systems, and therefore cannot reap the benefits that those provide. There are gaps between the real problems that visualization authors face in providing human-centered solutions, and suitable available data management solutions. Stakeholders of different kinds experience friction in the process, making moving across the gap difficult.
First, we consider “authors”, engineers who design and implement visualization frame-works. “Consumers”, on the other hand, who use those tools to explore data (e.g. domain scientists or even readers of data-interactive press reports). They are not necessarily experts in data management but instead have in-depth knowledge of a domain the visualization tools are supposed to be used in. Sometimes the author and consumer roles blur, such as in BI tools like Tableau.
We have identified two dimensions that make usage of readily available data management infrastructure difficult to the point where data management specialist knowledge is required: Rich Queries and Rich Data. Rich queries are a progression within the creative process of creating visualizations. The process often starts with a rough sense of what the ultimate results will be, so the visualization author has little idea how to describe them in terms of formalized queries. Here, a data management system that requires for example a fixed upfront schema definition and a set-theoretic approach to querying is of little help. As design ideas emerge, authors may have imprecise notions of what operations are needed to support them. As authors try to formalize these needs in order to move towards practical implementation, they often describe them using task-centric abstractions. That is, the abstractions that are convenient for describing the user needs. These abstractions may not map easily to data management abstractions, that is the things that are convenient for readily available data management systems, for example relational algebra.
Rich Data is the source of another dimension of complexity for the visualization author: Using traditional data management systems to process unstructured data (e.g. text data) is challenging as complex ETL pipelines using external tools would need to be built and complex statistical algorithms are required to make sense of the data. Specialized data management systems exist for individual forms of unstructured data but are then unlikely to easily support visualizations due to lack of higher-level analysis operators (e.g. inverted indices). A similar issue exists for structured data such as graphs or arrays. Again, specialized data management systems exist, but non-relational querying operators are often required. This creates additional adoption barriers for visualization authors as new systems and query languages need to be adopted for each of the various types of structured data.
3.5
An Evaluation Methodology for Vis + DB
Leilani Battle (University of Maryland), Carsten Binnig (TU Darmstadt), Tiziana Catarci (Sapienza University of Rome), Stephan Diehl (Universität Trier), Jean-Daniel Fekete (INRIA Saclay), Michael Sedlmair (Universität Wien), Wesley Willett (University of Calgary)
License Creative Commons BY 3.0 Unported license
© Leilani Battle, Carsten Binnig, Tiziana Catarci, Stephan Diehl, Jean-Daniel Fekete, Michael Sedlmair, Wesley Willett
There exists a growing set of data-centric systems through which domain experts and data scientists of varying skill levels can visually analyze large data sets. Evaluating such systems, however, is non-trivial. To that end, we need a more principled methodology for evaluating specifically components that live at the intersection of visual interactive interfaces and the data management system behind it. While the long term goal is to have general user and task models that would allow to derive realistic benchmarks for different scenarios, this seems clearly impractical to solve in the short term. Therefore, we advocate to start with more empirical methods.
To address our challenges, we need to evaluate visual data analysis systems at different levels. On the work environment level, we need to better understand what data scientist-s/domain scientists are doing and how they are working, i.e. which are their goals, tasks, and constraints. On the system level we should collect and share concrete and systematic traces of real-world analysis and exploration activity (logs, video, annotations, etc.) that could drive more realistic evaluation of DM systems, and better inform Vis designs. On the component level we need to provide better benchmarks for making DB systems ready for EDA/Vis. We also need to support DB researchers in more user-centered evaluations. We suggest that the Vis and DB communities work together on a bottom-up approach, starting on the component level up to the work environment level, to developing a unified evaluation methodology that spans the different levels.
In the database community, there is a strong emphasis on using benchmarks to test the performance of different data management systems, where individual benchmarks are developed to simulate certain tasks. For example, transactional processing (TPC-C and TPC-E), data cleaning (TPC-DI), and online analytical processing (TPC-H and TPC-DS) are all areas of interest for data management benchmarks. However, these benchmarks focus on simulating large-scale enterprise systems (e.g., data warehouses), and generally ignore the case where database queries are being generated by a user interacting with a visualization interface.
Similarly, there is an extensive body of work in the visualization community on under-standing, refining and improving the process of evaluating visualization tools. For example, by analyzing the large number of user studies conducted over the years, the visualization community has been able to: 1) layout the space of possible evaluations, 2) encourage the use of evaluation methodologies from other areas for visualization research, and 3) distill best practices for conducting future user study evaluations.
While evaluation methods exist for both communities, there are relatively few quantitative and comparative methods for evaluating the performance of large-scale visual exploration systems. In particular, user studies are designed and conducted to perform customized evaluations of individual systems, but the user interaction logs, system logs and metadata (e.g., datasets used, interfaces used) are rarely shared or published in a standardized way.
There has been some initial work on creating a repository for benchmarking the efficacy of visualization interfaces, but there is still a need for recording data at the systems level to help standardize the evaluation process.
4
Community Challenges
Sihem Amer-Yahia (CNRS), Leilani Battle (University of Maryland), Carsten Binnig (TU Darmstadt), Tiziana Catarci (Sapienza University of Rome), Remco Chang (Tufts Univer-sity), Surajit Chaudhuri (Microsoft Research), Harish Doraiswamy (New York UniverUniver-sity), Steven Drucker (Microsoft Research), Stephan Diehl (Universität Trier), Harish Doraiswamy (New York University), Jason Dykes (City University of London), Jean-Daniel Fekete (IN-RIA Saclay), Danyel Fisher (Microsoft Research), Juliana Freire (New York University), Michael Gleicher (University of Wisconsin-Madison), Hans Hagen (TU Kaiserslautern), Gerhard Heyer (Universität Leipzig), Heike Hofmann (Iowa State University), Daniel Keim (Universität Konstanz), Tim Kraska (MIT), Heike Leitte (TU Kaiserslautern), Zhicheng Liu (Adobe Systems Inc), Volker Markl (TU Berlin), Alexandra Meliou (University of Mas-sachusetts), Torsten Moller (Universität Wien), Dominik Moritz (University of Washington), Hannes Mühleisen (CWI), Arnab Nandi (Ohio State University), Behrooz Omidvar-Tehrani (LIG-Grenoble), Themis Palpanas (Paris Descartes University), Carlos Scheidegger (Univer-sity of Arizona), Gerik Scheuermann (Universität Leipzig), Michael Sedlmair (Universität Wien), Thibault Sellam (Columbia University), Juan Soto (TU Berlin), Richard Wesley (Tableau Software), Wesley Willett (University of Calgary), Eugene Wu (Columbia Univer-sity), Yifan Wu (University of California-Berkeley)
License Creative Commons BY 3.0 Unported license
© Sihem Amer-Yahia, Leilani Battle, Carsten Binnig, Tiziana Catarci, Remco Chang, Surajit Chaudhuri, Harish Doraiswamy, Steven Drucker, Stephan Diehl, Harish Doraiswamy, Jason Dykes, Jean-Daniel Fekete, Danyel Fisher, Juliana Freire, Michael Gleicher, Hans Hagen, Gerhard Heyer, Heike Hofmann, Daniel Keim, Tim Kraska, Heike Leitte, Zhicheng Liu, Volker Markl, Alexandra Meliou, Torsten Moller, Dominik Moritz, Hannes Mühleisen, Arnab Nandi, Behrooz
Omidvar-Tehrani, Themis Palpanas, Carlos Scheidegger, Gerik Scheuermann, Michael Sedlmair, Thibault Sellam, Juan Soto, Richard Wesley, Wesley Willett, Eugene Wu, Yifan Wu
The database community has developed solutions for many data management challenges that are relevant to the visualization community. Our goal should be to bring these solutions to a usable stage rather than a “research-solved” stage. In order to address the needs of the visualization community, it is important to have a common understanding and arrive at a common language. This may require the database community to abstract operations with richer semantics than relational algebra, and it will require the visualization community to specify common visualization operators jointly with the semantics.
Both communities understand these problems cannot be solved alone. The database community needs to think more about not just simple, commonly-used use cases, but also nuanced complex use cases faced by the visualization community and create software artifacts, publications, and research projects. The visualization community, at the same time, needs to better articulate needs at a lower-level of the stack, so as to allow for actionable areas of need. By incrementally working on smaller pieces on both sides, this allows for both communities to create layers of interaction, such as a shared algebra and grammar/language to reason about and build systems on.
Papers in this domain may face challenges of different publication cultures, as traditional evaluation metrics in the database community focus on systems behavior (latency, throughput, etc.). Evaluation visualizations, on the other hand, may require modeling user behavior and user studies, a concept not yet well established in database conference. This may require educating program committee members of both communities aware of the publication culture and importance of the respective metrics of the other field. In order to bring the communities together, it may be useful to establish workshops on this joint topic at the key conferences of
both communities such as SIGMOD, ICDE as well as VIS. The HILDA workshop at SIGMOD and the DSIA workshop at VIS are two example of this. In order to achieve cross-fertilization, co-location of conferences of both communities and cross-selection of invited speakers will be useful instruments.
5
Conclusion
As data scale and complexity increases, the novel solutions that will ultimately enable interactive, large-scale exploratory data analysis will have to come from truly interdisciplinary and international work. Today, databases can store and query massive amounts of data, including methods for distributed, streaming and approximate computation. Data mining techniques provide ways to discover unexpected patterns and to automate and scale well-defined analysis procedures. Meanwhile, to keep up with the rising tide of data, visualization researchers develop interactive visualization tools to support human perception and cognition that help users reason about the data and gain insights from the data.
This seminar brought together researchers from the database and visualization communit-ies who have clear overlaps in interest and goals, but seldom interact with each other. It became clear from the week-long discussions that the two communities need to collaborate and rely on each other to achieve the goal of supporting users in performing interactive data analysis on data that continue to increase in scale and complexity. In this report we summarized these discussions – we have identified areas of synergistic research activities, highlighted potential new exciting research opportunities, and suggested ways in each the two communities can work together.
We thank Dagstuhl for providing a wonderful environment for this meeting to take place. The opportunity for open dialog and formal (and informal) discussions was appreciated by all the participants. We hope that the outcome of our discussions can represent the start of a new research agenda that will lead to novel research ideas and useful software artifacts. Further, we hope that this research agenda will inspire researchers from both the database and the visualization communities to continue the discussions and form new collaborations towards the development of next generation data management and interactive visualization systems.
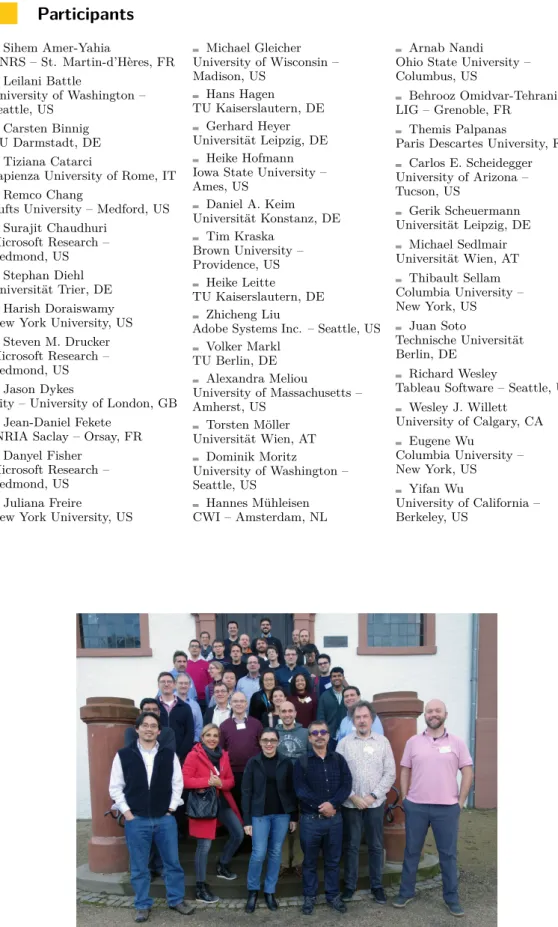
Participants
Sihem Amer-Yahia CNRS – St. Martin-d’Hères, FR Leilani Battle University of Washington – Seattle, US Carsten Binnig TU Darmstadt, DE Tiziana CatarciSapienza University of Rome, IT Remco Chang
Tufts University – Medford, US Surajit Chaudhuri Microsoft Research – Redmond, US Stephan Diehl Universität Trier, DE Harish Doraiswamy New York University, US
Steven M. Drucker Microsoft Research – Redmond, US
Jason Dykes
City – University of London, GB Jean-Daniel Fekete
INRIA Saclay – Orsay, FR Danyel Fisher
Microsoft Research – Redmond, US
Juliana Freire
New York University, US
Michael Gleicher University of Wisconsin – Madison, US Hans Hagen TU Kaiserslautern, DE Gerhard Heyer Universität Leipzig, DE Heike Hofmann Iowa State University – Ames, US Daniel A. Keim Universität Konstanz, DE Tim Kraska Brown University – Providence, US Heike Leitte TU Kaiserslautern, DE Zhicheng Liu
Adobe Systems Inc. – Seattle, US Volker Markl TU Berlin, DE Alexandra Meliou University of Massachusetts – Amherst, US Torsten Möller Universität Wien, AT Dominik Moritz University of Washington – Seattle, US Hannes Mühleisen CWI – Amsterdam, NL Arnab Nandi Ohio State University – Columbus, US
Behrooz Omidvar-Tehrani LIG – Grenoble, FR
Themis Palpanas
Paris Descartes University, FR Carlos E. Scheidegger University of Arizona – Tucson, US Gerik Scheuermann Universität Leipzig, DE Michael Sedlmair Universität Wien, AT Thibault Sellam Columbia University – New York, US Juan Soto Technische Universität Berlin, DE Richard Wesley
Tableau Software – Seattle, US Wesley J. Willett University of Calgary, CA Eugene Wu Columbia University – New York, US Yifan Wu University of California – Berkeley, US