HAL Id: hal-00553446
https://hal.archives-ouvertes.fr/hal-00553446
Submitted on 26 Mar 2011
HAL is a multi-disciplinary open access
archive for the deposit and dissemination of
sci-entific research documents, whether they are
pub-lished or not. The documents may come from
teaching and research institutions in France or
abroad, or from public or private research centers.
L’archive ouverte pluridisciplinaire HAL, est
destinée au dépôt et à la diffusion de documents
scientifiques de niveau recherche, publiés ou non,
émanant des établissements d’enseignement et de
recherche français ou étrangers, des laboratoires
publics ou privés.
The role of pulvinar in information transmission through
the visual cortical hierarchy
Nelson Cortes, Carl van Vreeswijk
To cite this version:
Nelson Cortes, Carl van Vreeswijk. The role of pulvinar in information transmission through the
visual cortical hierarchy. Cinquième conférence plénière française de Neurosciences Computationnelles,
”Neurocomp’10”, Aug 2010, Lyon, France. �hal-00553446�
PULVINAR’S ROLE IN INFORMATION TRANSMISSION THROUGH THE
VISUAL CORTICAL HIERARCHY
Nelson Cortes
Laboratoire de Neurophysique et Physiologie CNRS UMR 8119
Universit´e ParisDescartes
45 rue des Saints P`eres, 75270 Paris, France nelson.cortes@parisdescartes.fr
Carl van Vreeswijk
Laboratoire de Neurophysique et Physiologie CNRS UMR 8119
Universit´e ParisDescartes
45 rue des Saints P`eres, 75270 Paris, France cornelis.van-vreeswijk@parisdescartes.fr
ABSTRACT
A hierarchical model of ten cortical areas is examined to explain representation of stimulus contrast. In each area, the activity is integrated and then non-linearly transmitted to the next area. This arrangement of interactions creates a gradient from simple to complex visual patterns as one moves to higher cortical levels. In the model, the firing rate of each unit describes its neural activity. The visual input is modeled as a Gaussian random input, whose width codes for the contrast. This input is applied to the first area. The output activity ratio among different contrast values is an-alyzed for the last level to observe sensitivity to a contrast and contrast invariant tuning. For a purely cortical system, the output in the last area is approximately contrast invari-ance in a small gain range, but the sensitivity to contrast is poor. To account for an alternative visual processing path-way, non-reciprocal connections from and to a parallel pul-vinar like-structure of nine areas are coupled to the system. Compared to the pure feedforward model, cortico-pulvino-cortical output presents much more sensitivity to contrast and has a similar level of contrast invariance of the tuning.
KEY WORDS
Biophysical models, Cortical transmission, Cortico-pulvinar connections, Sensitivity to Contrast, Tuning Con-trast Invariance.
1 Introduction
The primate visual system is a highly complex structure with a hierarchical organization of areas [1]. In this hierar-chy, feedforward connections are almost exclusively from areas in one layer to areas in the next layer of the hierar-chy, while the feedback connections are predominantly to areas in the preceding layer. If we investigate the response properties for neurons in higher and higher layers of the hi-erarchy, several features are striking. The receptive fields of the neurons increase in size and become more complex [2]. Nevertheless the tuning properties of the neurons are more or less contrast invariance and the response increases smoothly with contrast [3].
These properties are not easily accounted for. Simple
models show that, because to the non-linear input-output relation of the neurons, chains of areas will develop the tendency to move to a step response, or go to a constant response as a function of contrast [4].
What seems to be needed to overcome this problem is a “short-cut” between lower and higher layers in the hi-erarchy. A candidate for such a short-cut is the pulvinar nucleus of the thalamus [5]. The pulvinar is hierarchically organized [6], but unlike the cortex pulvinar layers are con-nected by long range interneurons [7]. Furthermore there is a topological arrangement of connectivity between pul-vinar and the cortex that conserves the topography of the visual system [5, 6]. Thus, the pulvinar can transmit to-pographical visual information from lower cortical areas to higher levels by long range interneurons.
Here we investigate whether the pulvinar can play an important role in regulating the response of higher cortical areas to contrast changes. We investigate a toy model of the visual cortex with and without interactions with the pulv-inar and study in both cases to what extend it is possible to have contrast independent tuning and a smooth contrast response function in all layers of the hierarchy.
2 The Model
We consider a network model with a hierarchical cortical architecture. It consists of L areas, with in each area 2L different units. The units are modeled as rate based
neurons [8]. Beside this cortical architecture there is also a model pulvinar with L− 1 layers, whose units are also modeled as rate based neurons.
The Transfer Function
Each unit is considered as being composed of “On” and “Off” cells, where the rates r+ of the “On” and r− of the
“Off” cells satisfy, if the input into the unit is I,
τr
d
dtr±= −r±+ f±(I) (1)
where τr is the time constant of the cortical units and
f± are sigmoidal functions, satisfying f+(I) = [1 +
be combined in one effective unit with a rate r = r+− r−,
which has a transfer function
f (I) = 1 1 + exp(−β(I − Ith) − 1 1 + exp(β(I + Ith) . (2) The rate of the units in the pulvinar obey the same dynam-ics.
Cortical Architecture
The input onto a cortical unit in area l has three compo-nents, cortical feedforward input from area l− 1, cortical feedback from l + 1 and pulvinar input from pulvinar area l− 1. The exception to this are the first area which receives feedforward input from the LGN and feedback from cortical area 2, but not from the pulvinar, and the last area, area L, which does not receive cortical feedback input.
We account for the increasing size and complexity of the receptive field as one moves up the cortical hierarchy by assuming that in each area the units receive input from two neighboring units in area l− 1. For example, at position i in area 2 there are two units, one which receives as input the sum of the outputs of position 2i− 1 and 2i in area 1, while the other receives the difference of these outputs. Thus we have half as may positions in area 2, but two types of neurons in each position. This procedure is repeated in higher areas. Thus for unit i of type k in cortical area l the feedforward input, Il k,i(F F ) satisfies I2kl −1,i(F F ) = rlk,2i−1−1+ r l−1 k,2i Il 2k,i(F F ) = rk,2il−1−1− r l−1 k,2i, (3) for l = 2, . . . , L− 1, i = 1, . . . , 2L−land k = 1, . . . , 2l−1. For l = 1 we have only one type of receptive field, k = 1 and I1
1,l(F F ) is, for i = 1, . . . , 2L−1, given by I1,l1 (F F ) =
r0
i, where ri0is the output of the ith LGN unit.
Units in area l receive feedback input from those units in area l+1 in to which they project, this input has the same sign as the feedforward input but is modulated by factor γ. The feedback is given by
Ik,2i−1l (F B) = γ(rl+12k−1,i+ r2k,il+1)
Ik,2il (F B) = γ(rl+12k−1,i− r2k,il+1).
(4)
Units on the Lth area do not receive feedback input. To account for the absence of this we for this area that the feedforward input is given by IL 2k−1,1(F F ) = (1 + γ)[rl−1k,1 + rl−1k,2] and IL 2k,1(F F ) = (1 + γ)[r l−1 k,1 − r l−1 k,2]. The Pulvinar
The pulvinar is modeled similarly to the cortex except that each area has at most 4 types of receptive fields, the patterns corresponding to k = 1, 2, 2l
− 1, 2l. Pulvinar
units in area l receive input from cortical units in area l and from pulvinar units in areas 1 to L− 1. The input
Jl
k,i(P C) from cortex to unit i of type k in pulvinar region
l is given by Jl
k,i(P C) = WP CI for l = 1, ..., L− 1,
i = 1, ..., 2L−l−1 and k = 1, 2, 2l − 1, 2l. The input
Jl
k,i(P P ) from the rest of the pulvinar satisfies:
J2kl −1,i(P P ) = 1 1 + WLP ! WF P[sl−1k,2i−1+ sl−1k,2i] +WLP 2 [Jk,2il−1−1+ J l−1 k,2i] " Jl 2k,i(P P ) = 1 1 + WLP ! WF P[slk,2i−1−1− s l−1 k,2i] +WLP 2 [Jk,2il−1−1+ J l−1 k,2i] " , (5) for k = 1 and k = 2l−1. Here we have used sl
k,ifor the rate
of the pulvinar units and assumed J1
k,i(P P ) = 0. Variables
WF Pand WLPare respectively strengths that modulate the
feedforward and the long range forward input inside the pulvinar, and they can be positives or negatives. The ex-ception to this connectivity arrangement are pulvinar area 1 and 2. Pulvinar area 1 receives only input from cortical area 1, whereas for pulvinar area 2 WLP = 0.
Finally, the input from pulvinar to cortex, I(CP ), is given by:
I2kl −1,i(CP ) = WCP[sl+1k,2i−1+ sl+1k,2i]
I2k,il (CP ) = WCP[slk,2i−1− sl+1k,2i],
(6)
where sl
k,iis the output of pulvinar unit for k = 1, 2, 2l−
1, 2land sl
k,i = 0 otherwise.
3 Response to Homogeneous Input
To get some insight into the model’s behavior we first con-sider the network with a spatially constant input, r0
i = r0.
For such an input the equilibrium rates satisfy rk,il =
δk,1rl, slk,i = δk,1sl.
In the purely feedforward model, γ = 0 and WCP =
0 these rates are given by r1= f(r0), rl+1= f(2rl). If we
consider a long chain, L large, the rates will approach r∞,
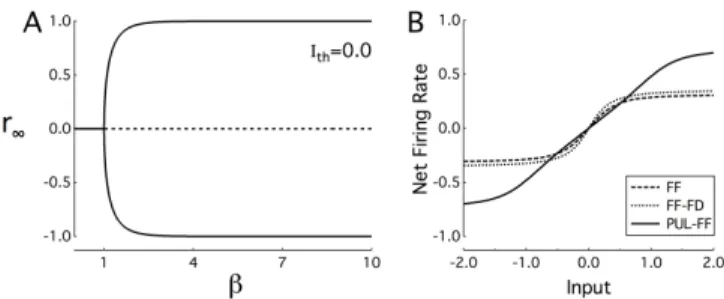
given by r∞ = f(2r∞). Figure 1A shows the solutions
for r∞ as a function of β. For small β the only solution
is r∞ = 0. As β is increased there is a bifurcation and
two new solutions appear. The solution r∞ = 0 becomes
unstable at this point while the two new solutions are stable. The meaning of these results is that for small β the response, rl, approaches 0 with increasing l for any input
r0, while for large β it approaches upper stable solution for
r0 > 0 and the lower one for r0 < 0. Thus information
about r0is lost in the higher areas for any value of β.
Adding feedback connections only, γ"= 0, WCP = 0
does not qualitatively improve the situation. The bifurca-tion point moves from βcr = 1 to βcr = 2/(2 + γ), but
for a sufficiently large L we still have an almost constant output for small β and a step response for larger β.
Figure 1.A) Fixed point solutions as a function of β. Solid: sta-ble, dashed: unstable. B) Response of the 10th layer as a function of input for the optimal feedforward (FF), feedforward-feedback (FF-FD) and pulvinar-feedforward (PUL-FF) network.
The response of the network to spatially constant in-put with the pulvinar included, WCP "= 0 and WP C "= 0,
can also be treated analytically. One solution shows a smooth linear increment of firing rate when the contrast input gradually increases. This relation in the feedforward-pulvinar model is observed when WLP # 1 with the
con-straint WF P < WLP. At Ithcx = 0, this process is satisfied
as βcx= 1/(1+F
pulWCPWP C), where βcxis the cortical
gain and Fpulthe derivative of the effective transfer
func-tion for the pulvinar (Eq. (2)). This improvement in the last area’s activity is because pulvinar area l receives in-put from all lower areas and passes directly to higher areas. Because of these long range interactions, responses in the higher pulvinar regions may not tend to a bi-modal output distribution. This is confirmed by numerical simulations. These show that the output of the last layer increases much more smoothly when the pulvinar is included.
A network that optimally encodes r0in the final layer
should satisfy two requirements, It should be as linear as possible and it should use the output range maximally. For a cortical feedforward network these requirements are in conflict. The dynamic range is used maximally for large β, but for large β the response is very non-linear. On the other hand small β give an almost linear response, but the out-put does not use the dynamic range. Figure 1B shows the output of the last area for a network that optimally encodes inputs, r0between -2 and 2. The optimality measure used
was the entropy of the output distribution and the value of
β was optimized (Ithwas kept at 0). The input output
func-tion is far from linear and the range [−1, 1] is not fully used. Also shown is the result for feedforward-feedback and feedforward-pulvinar model. Here βcx,pul, γ, W
CP,
WP C, WF P and WLP were varied to obtain the optimal
value. For PUL-FF model, βcxwas found to satisfy using
βcx = 1/(1 + F
pulWCPWP C). The result for PUL-FF is
much better than that for cortico-cortical connections. The curve is closer to linear and the dynamical range is almost fully used. In this simple set-up the pulvinar can contribute greatly to the transmission of information about the input to the highest layer.
Figure 2. Scatter-plot of response at low contrast (White dots
σ2= 0.1, gray dots σ2= 0.5) vs. response at the highest contrast (σ2 = 1) that minimize the error. A) Feedforward network, B)
Network with pulvinar.
4 Response to Visual Input
In modeling the response of the network to Natural Visual stimuli we take into account that for such stimuli the retina and LGN whitens the response and reduces the kurtosis of the distribution [9]. Thus visual input with natural statistics is, in our model, described by a random input with mean 0,
r0
i = σxi, where σ codes for the contrast and xiis
indepen-dently drawn from a Gaussian with mean 0 and variance 1. We assume that the same visual input with higher contrast is represented by an input with the same xi but larger σ.
Contrast invariance of the tuning means that the input elic-its in the last layer an output vector rL
k,1 whose direction
is independent of contrast. Smooth increase of the con-trast response means that the length of this vector increases gradually with contrast.
If we consider a purely feedforward model in which the transfer function f is linear, f (I) = αI, the output of each layer is Gaussian an one easily shows$(rl
k,i)2% =
(2α2)lσ2/2. The response decreases with l if α < α cr =
1/√2, otherwise it blows up.
Considering a feedforward network with a nonlinear transfer function, f , we see that, for low contrast, the re-sponse goes to zero if f#(0) < α
cr. For Ith= 0 this means
that β =√2. Applying a Gaussian random input r0
gener-ates, for Ith= 0, in layer L, one or three fixed rate bumps,
as one moves from small to large values of β. Firing rates pass from rl= 0 to rl= −1, 0, 1 as β is increased. These
solutions are produced for inputs with low and high con-trast. Numerical simulation shows that the transition from one bump to three bumps occurs at β≈ 1.4, in agreement with our analysis.
5
Output Response Tuning
To test whether the network is sensitive to changes in con-trast, we measure the output activity of the last layer when
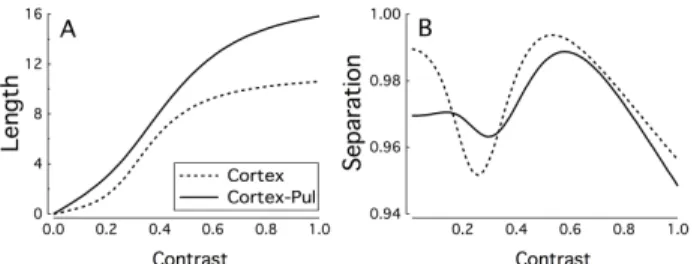
Figure 3.A) Length and B) Separation distance of last area out-puts as a function of contrast.
the variance, σ2, is gradually increased. We estimate two
properties of the output firing rate: The output amplitude is a function of the contrast and the mean angle between different values of contrast. The output amplitude, F , is defined as average length of the output for LGN in-puts with widths σ, F (σ) = $|'V|%, where the average is
over input patterns with standard deviation σ. We aim for an amplitude function F that is as linear as possible and uses the dynamic range maximally. We use EL defined
as EL = −# 1
0 dσ log(F#(σ)) as the cost-function for this
property. EL → 0 the output scales linearly and exploits
the whole dynamic ranges. It increases if less of the dy-namic range is used or the response is more non-linear. To explore whether the network can maintain contrast in-variant tuning, we calculate the mean of the separation dis-tance S between normalizes output vectors 'e(σ) and 'e(σ#) for LGN inputs r0
i = σxk and ri0 = σ#xk respectively,
S =#01dσ#01dσ#'e(σ) ·'e(σ#). Here 'e = 'V/||'V||. If S = 1
then vectors are in the same direction for all contrasts. As the direction changes more with contrast, S decreases. We define an error E = 5
2S+e−ELthat takes both these factors
into account.
For networks with different architectures we deter-mine the parameters which minimize the cost function E. In Fig. 2 we show the response to different contrast for a model with only intracortical feedforward connections (Fig 2A) and with the complete Cortex + Pulvinar System (Fig 2B). The response of a neuron at contrast σ is plot-ted against the response of the same cell at contrast σ = 1 for different values of the contrast. For both architectures the contrast invariance of the tuning reasonable good, as reflected by the fact that the points fall nearly on a straight line. However, for the feedforward model, the slope of this line does not change much as σ is varied, reflecting the fact that the response amplitude only changes weakly with the contrast. Furthermore the dynamic range is not fully used here.
In the cortico-pulvinar-cortical model the dynamical range is almost fully exploited and the response amplitude increases by almost a factor of 5 as the contrast is increased from σ2= 0.1 to σ2= 1. This is further illustrated in Fig.
3. In Fig 3A we plot the average response amplitude against the contrast for both architectures and in Fig. 3B the
sepa-ration between the normalized response vector for contrast
σ and the normalized response vector averaged over
con-trasts, is plotted against σ. For both models S varies over the range 0.99 to 0.94, but the response amplitude clearly increases more linearly and uses more of the dynamic range for the Cortico-pulvinar-cortex model.
This improvement is observed as WLP # 1 and
WF P < WLP. Moreover, this improvement is present
when connections from cortex to pulvinar are negative (positive) while connections from pulvinar to cortex are positive (negative). Surprisingly there are two almost equally good solutions: in one WCP is large and WP C
small. In the other WP C is large and WCP small. Our
model does well when the cortex modulates the pulvinar while the pulvinar drives the cortex, but it does equally well when it is the other way around.
These results show that in a purely feedforward model it is not possible to achieve contrast independent tuning and a good sensitivity to contrast in higher layers of the visual hierarchy and that the pathway through the pulvinar could overcome this limitation.
Acknowledgments
N.C, was supported by a scholarship from the Franco-Chilean Government and CONICYT.
References
[1] D. Felleman, and D.C. Van Essen, Distributed Hierarchical Processing in the Primate Cerebral Cortex, Cerebral Cortex, 1(1), 1991, 1-47.
[2] R.L. DeValois, Spatial Vision (Oxford, UK: OUP, 1998). [3] D.G. Albrecht, W.S. Geisler, R.A. Frazor, and A.M. Crane,
Visual Cortex Neurons of Monkeys and Cats: Temporal Dy-namics of the Contrast Response Function, J Neurophysiol, 88(2), 2002, 888-913.
[4] N. Cortes, Le rˆole de la boucle cortico-pulvinar-corticale dans la transmission d’information (MA Thesis, Cogmaster, EHESS, Paris, 2008).
[5] S.M. Sherman, and R.W. Guillery, Exploring the Thalamus and its Role in Cortical Function (Cambridge, MA: MIT Press, 2006).
[6] S. Shipp, The functional logic of cortico-pulvinar connec-tions, Trans R Soc Lond B Biol Sci, 358(1438), 2003, 1605-24.
[7] K. Imura and K.S. Rockland, Long-range interneurons within the medial pulvinar nucleus of macaque monkeys, J Comp
Neurol, 498(5), 2006, 649-66.
[8] H.R. Wilson and J.D. Cowan, Excitatory and inhibitory inter-actions in localized populations of model neurons, Biophys J, 12(1), 1972, 1-24.
[9] E.P. Simoncelli, and B.A. Olshausen, Natural Image Statis-tics and Neural Representation, Annu. Rev. Neurosci, 24, 2001, 1193-216.