Deep Learning of Activation Energies
The MIT Faculty has made this article openly available. Please share how this access benefits you. Your story matters.Citation Grambow, Colin A. et al. "Deep Learning of Activation Energies." Journal of Physical Chemistry Letters 11, 8 (March 2020): 2992-2997 © 2020 American Chemical Society
As Published http://dx.doi.org/10.1021/acs.jpclett.0c00500
Publisher American Chemical Society (ACS)
Version Author's final manuscript
Citable link https://hdl.handle.net/1721.1/125019
Terms of Use Article is made available in accordance with the publisher's policy and may be subject to US copyright law. Please refer to the publisher's site for terms of use.
Deep Learning of Activation Energies
Colin A. Grambow, Lagnajit Pattanaik, and William H. Green
∗Department of Chemical Engineering, Massachusetts Institute of Technology, Cambridge,
Massachusetts 02139, United States
E-mail: whgreen@mit.edu Phone: +1-617-253-4580
Abstract
Quantitative prediction of reaction properties, such as activation energy, have been limited due to a lack of available training data. Such predictions would be useful for computer-assisted reaction mechanism generation and organic synthesis planning. We develop a template-free deep learning model to predict activation energy given reactant and product graphs and train the model on a new, diverse data set of gas-phase quantum chemistry reactions. We demonstrate that our model achieves accurate predictions and agrees with an intuitive understanding of chemical reactivity. With the continued generation of quantitative chemical reaction data and development of methods that leverage such data, we expect many more methods for reactivity prediction to become available in the near future.
TOC Graphic
4O C6 C2 C3 C1 H7 H9 H8 N5 11H H10 4O C3 C2 C6 5N H10 H11 C1 H7 H9 H8 C2 C1 H7 H9 H8 MPNNActivation energy is an important kinetic parameter that enables quantitative ranking
of reactions for automated reaction mechanism generation and organic synthesis planning.
Achieving reliable activation energy prediction is an integral step towards complete kinetics
prediction. Machine learning, particularly deep learning, has recently emerged as a promising
data-driven approach for reaction outcome prediction1–6and for use in organic retrosynthetic
analysis.7–10These methods leverage massive data sets of organic reactions, such as Reaxys11 and Pistachio.12 However, the methods operate on qualitative data that only indicate the major reaction product and mostly lack any information regarding reaction rates. Moreover,
many of the organic chemistry reactions are not elementary. The data used by Kayala and
Baldi1 and Fooshee et al.2 are an exception, but quantitative information is still missing.
Linear methods, like Evans-Polanyi relationships13and group additivity models,14–17have
been successfully used in automated reaction mechanism generation to estimate rate
con-stants, but they are limited in scope and applicability. New parameters have to be derived
for each reaction family, and predictions far from the training data often go awry. Nonlinear
decision trees provide more flexible models for kinetics estimation but are also most effective
when they are specific to a reaction family.18Neural networks may be a promising alternative as large data sets become more readily available.
Recently, some quantitative reaction prediction research using neural networks has
be-come available, but it is limited in its application. Gastegger and Marquetand developed a
neural network potential for a specific organic reaction involving bond breaking and
forma-tion, likely the first of its kind.19 Allison described a rate constant predictor for a specific reaction type involving reactions with OH radicals.20Choi et al. looked specifically at activa-tion energy predicactiva-tion using machine learning.21 However, their training data was composed of reactions in the Reaction Mechanism Generator (RMG)18database which comprised many
similar reactions such that a random test split yielded ostensibly good results. Their issue
stems from the fact that the vast majority of the RMG database is composed of just two
within the same family tend to have similar kinetics. Therefore, a model trained on such
data performs particularly well for the two reaction types but not well for others. Moreover,
the Choi et al. model required knowledge of the reaction enthalpy and entropy to make a
prediction. Singh et al. similarly predicted reaction barriers for a small data set of
dehydro-genation reactions involving N2 and O2 dissociation on surfaces.22Their model also required
the reaction energy as additional input.
Our goal is to develop a deep learning model to predict activation energies across a wide
range of reaction types that does not depend on any additional input and only requires a
graph representation of reactants and products. Such a model would be useful as a first step
in deep learning-based kinetics estimation for automated reaction mechanism generation
(e.g., in RMG18) or would allow for quantitative ranking of reaction candidates that were
generated via combinatorial enumeration of potential products given a reactant.23 Training
such a model requires suitable quantitative data. We use data based on large-scale quantum
chemistry calculations,24 but high-throughput experimentation25 is also starting to become a valuable source of new data.
To effectively learn activation energy, we must encode the atoms involved in a reaction
that change significantly in a way that they contribute most to the predicted property. To
ac-complish this, we extend a state-of-the-art molecular property prediction method, chemprop,
developed by Yang et al.,26to work with atom-mapped reactions. Figure 1 shows a schematic
of the method, while the Supporting Information provides more detail on the network,
train-ing procedure, and hyperparameter optimization. Our modified code is available on GitHub
in the reaction branch of chemprop.27 The code also includes the trained model in the model directory that can be directly used with the predict.py script in chemprop.
The method by Yang et al. is a directed message passing neural network (D-MPNN) for
molecular property prediction, which is a type of graph convolutional neural network.28–30
Graphs naturally represent molecules in which atoms are the vertices and bonds are the
informa-tion between elements of the graph using messages associated with directed edges/bonds. A
hidden representation for each directed bond embeds initial atom features, such as atomic
number, and initial bond features, such as bond order, using a neural network. Additional
neural networks iteratively update these hidden representations by incorporating the
infor-mation from neighboring bonds. Afterwards, we transform the hidden bond vectors into
hidden atom vectors and sum them to obtain a molecular feature vector. However, such
a summation would lose information about the order of atoms, which is necessary to
en-code reactions effectively. As shown in Figure 1, we resolve this issue by using the same
D-MPNN to encode reactant and product into the intermediate representation given by the
hidden atom vectors. Because the atom mapping between reactant and product is known,
we calculate differences between all product and reactant atoms to yield atomic difference
fingerprints. This approach is similar to the difference network described in Ref. 5. Next,
we pass each of the fingerprints through the same neural network and aggregate them into
a reaction encoding. The last step of the process is the readout phase, in which the network
learns a linear combination of the elements in the reaction encoding to give an estimate of
the activation energy.
The idea behind constructing difference fingerprints is to subtract out the effects of atoms
that do not change significantly in the reaction, and, therefore, do not contribute much to the
activation energy prediction. This requires that atom-mapped reactions are available, which
is often not the case, but developing methods for automatic atom mapping is an active area
of research.31–33 With large molecules, even atoms that do not change their covalent bonding environment may have large difference fingerprint magnitudes because they may increase
van der Waals attractions between different parts of the molecule or sterically hinder certain
transition states.
We train our model on a newly-developed gas phase organic chemistry data set of
elemen-tary atom-mapped reactions based on density functional theory (DFT).24 These data span a
4O C6 C2 C3 C1 H7 H9 H8 N5 11H H10 4O C3 C2 C6 5N H10 H11 C1 H7 H9 H8 C2 C1 H7 H9 H8 1 2 3 4 5 6 7 8 9 10 11 1 10 3 4 2 6 5 11 7 8 9 R R R R R R R R R R R 10 1 7 8 9 P P P P 2 P 3 P 4 5 6 11 P P P P 1 2 3 4 5 6 7 8 9 10 11
reactant
product
Directed Message Passing Neural Network
NN
+
NN
E
a
reaction encodingfor i ∈ [1,N
atoms]
i
i
P
i
R
⟵
–
difference fingerprintFigure 1: Illustration of neural network model used to predict activation energy given a chemical reaction. The difference fingerprint approach emphasizes atoms that change during the reaction.
and oxygen. Reactions are available at two different levels of theory—B97-D3/def2-mSVP
and ωB97X-D3/def2-TZVP. Both levels are used in a transfer learning approach similar to
that in Ref. 34, but we measure the final model performance against the
ωB97X-D3/def2-TZVP data. We augment our data by including all of the reverse reactions as well, which
essentially doubles the training data and may further help in subtracting out the effect of
distant atoms. This results in a total of 33 000 B97-D3/def2-mSVP and 24 000
ωB97X-D3/def2-TZVP reactions. The activation energies, Ea, provided in the data set are not
obtained by fitting to an Arrhenius form, but they represent the difference of transition
state and reactant electronic energies, each including zero-point energy.
To assess whether the trained model can make useful predictions across a wide range
of chemical reactions, the test set should contain reactions that are sufficiently different
from those in the training data, i.e., out-of-domain data. To generate such a data split,
we partitioned our data based on the scaffold splitting technique, which has been shown to
approximate time splits that are common in industry and are a better measure of
general-izability than random splits.26 We performed the split based on the scaffold of the reactant molecule. Moreover, to obtain a less variable estimate of the model performance, we
evalu-ated the model using 10-fold cross-validation. A split into 85% training, 5% validation, and
10% test data yields a test set mean absolute error (MAE) of 1.7 ± 0.1 kcal mol−1 and root-mean-square error (RMSE) of 3.4 ± 0.3 kcal mol−1 where the indicated bounds correspond to one standard deviation evaluated across the ten folds. While this error is quite small given
the diverse nature of the data, which spans an activation energy range of 200 kcal mol−1,24 the true error is confounded by the accuracy of the ωB97X-D3 method used to generate the
training and test data, which itself has an RMSE of 2.28 kcal mol−1 measured against much more accurate reference data.35
Because the model does not take three-dimensional structural information into account
and because the training and test sets include only a single conformer for each molecule (not
the reactant or product structures. More accurate models could be based on the molecular
geometries, which have been shown to work well for molecular property prediction and the
development of neural network potentials.36Nonetheless, we do not employ such information
here because it is often not readily available in applications when one wishes to rapidly predict
activation energies, like in automated reaction mechanism generation.
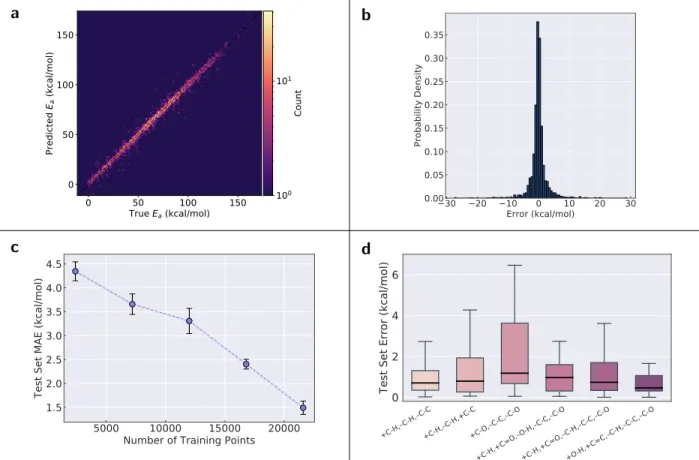
More fine-grained results are shown in Figure 2. The parity plot in Figure 2a shows that
accurate predictions are made across the entire activation energy range, and this accuracy
is even maintained in regions where data is sparser. Furthermore, there seems to be no
systematic over- or underprediction, and large outliers are relatively infrequent. This is
fur-ther shown in the error histogram in Figure 2b, which indicates that only very few reactions
have errors in excess of 10 kcal mol−1. Depending on the application, the model may be sufficiently accurate for quantitative predictions if errors slightly in excess of the ωB97X-D3
method are acceptable. An MAE of 1.7 kcal mol−1 implies that rate coefficients differ by a factor of 2.4 from the true/DFT value at 1000 K on average, which is often quite acceptable.
However, this error increases to a factor of 17.5 at 300 K. Moreover, entropic effects that
would typically be captured in the prefactor used in Arrhenius expressions are not taken into
account in this analysis and would constitute an additional source of error.
Regardless, the results show that the model is suitable for ranking a list of candidate
reactions by their likelihood of occurring. This may lead to an improvement over qualitative
reaction outcome prediction approaches by enabling a more quantitative ranking.
How-ever, a direct comparison is not currently possible because such approaches are generally
not based on elementary reactions and involve multiple steps in solvated environments. A
promising, immediate application of the model could be to enable discovery of novel
re-actions from species in large chemical mechanisms. Reaction candidates can be generated
from each molecule in a mechanism by changing bonds systematically to enumerate
poten-tial products.23 The deep learning model can then assess which candidates have the lowest
in a template-free manner, whereas conventional reaction mechanism generation software is
based on templates to restrict the allowable chemistry.18
0 50 100 150 True Ea (kcal/mol) 0 50 100 150 Pr ed ict ed Ea (k ca l/m ol) 100 101 Count a 30 20 10 0 10 20 30 Error (kcal/mol) 0.00 0.05 0.10 0.15 0.20 0.25 0.30 0.35 Probability Density b 5000 10000 15000 20000
Number of Training Points 1.5 2.0 2.5 3.0 3.5 4.0 4.5
Test Set MAE (kcal/mol)
c +C-H,C-H, C-C +C-H,C-H,+C-C+C-O,C-C, C-O +C-H,+C=O, O-H,C-C, C-O +C-H,+C=O, C-H,C-C, C-O +O-H,+C=C, C-H,C-C, C-O 0 2 4 6
Test Set Error (kcal/mol)
d
Figure 2: Deep learning model results. (a) Parity plot of model predictions vs. “true” (ωB97X-D3) data for the first fold. (b) Histogram of prediction errors (predicted minus “true”) for the first fold. (c) MAE vs. number of training data points for the deep learning model. The error bars indicate one standard deviation calculated across the ten folds. (d) Distributions of errors (outliers not shown) for the six most frequent reaction types (first fold). Each reaction type only includes the bond changes occurring in the reaction, e.g., +C-H,–C-H,–C-C means that a carbon-hydrogen bond is formed, a different carbon-hydrogen bond is broken, and a carbon-carbon single bond is broken in the reaction.
Figure 2c also shows that the model strongly benefits from additional training data,
and the typical decrease in the slope of the learning curve is not yet evident. However,
this is partially because hyperparameter optimization was performed on an 85:5:10 split.
Optimization for the points at lower training ratios would lead to improved performance and
show a more typical curve.
the decision tree estimator used in the RMG software,18 are often only applicable within a specific reaction family/template. The decision tree templates implemented in RMG are
based on known reactivity accumulated over decades and manually curated into reaction
rules. Conversely, the training data for the deep learning model are obtained from systematic
potential energy surface exploration and contain many unexpected reactions that do not fall
within the space encoded by the RMG templates. In fact, only 15% of all reactions in the data
used for this study have a matching template in RMG (distribution of RMG families shown
in the Supporting Information). There is no statistically significant difference between the
deep learning model performance on RMG-type reactions and on non-RMG-type reactions
(p ≤ 0.05), which shows that our template-free model can be applied to many reactions
that do not fit into expected reaction families and may be useful for discovering new and
unexpected reactions.
Figure 2d illustrates that the test set error is not the same across all reaction types
(examples of each reaction type are shown in the Supporting Information), but the reasons
for this are not obvious. The +C-H,–C-H,–C-C type leads to the formation of carbenes via
hydrogen transfer and ring-opening and has a similar distribution of errors compared to the
+C-H,–C-H,+C-C type, which is its reverse. Of the most frequent reaction types, the largest
errors are associated with the +C-O,–C-C,–C-O type, which is similar to +C-H,–C-H,–C-C
but involves the transfer of a hydroxy group instead of hydrogen or the rearrangement
of a cyclic ether. The last three reaction types shown in Figure 2d generally have small
errors although the +C-H,+C=O,–C-H,–C-C,–C-O type has a tail skewed towards larger
errors, potentially because of its unusual zwitterion/carbene product. Interestingly, the
model generally performs poorly for reactions with three heavy atoms (shown in Supporting
Information), perhaps because the training data are dominated by larger molecules.
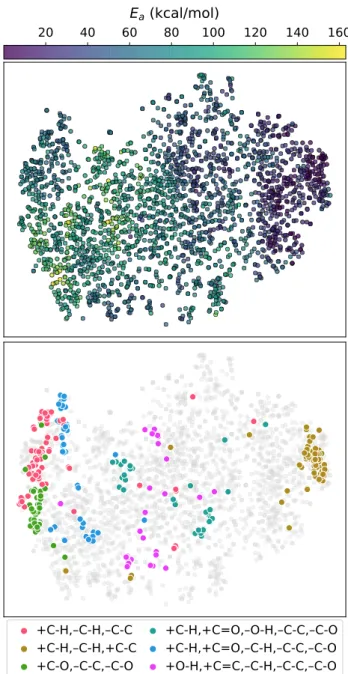
To assess whether the reaction encoding learned by the model is chemically reasonable,
we embedded the encodings in two-dimensional space using t-distributed stochastic neighbor
+C-H, C-H, C-C
+C-H, C-H,+C-C
+C-O, C-C, C-O
+C-H,+C=O, O-H, C-C, C-O
+C-H,+C=O, C-H, C-C, C-O
+O-H,+C=C, C-H, C-C, C-O
20
40
60
E
a(kcal/mol)
80 100 120 140 160
Figure 3: t-distributed stochastic neighbor embedding (t-SNE) of the learned reaction en-codings for the test set of the first fold. The embeddings correlate with the activation energy (top). The reactions cluster in t-SNE space based on their reaction type. Shown are the six most frequent reaction types (bottom). Each reaction type only includes the bond changes occurring in the reaction, e.g., +C-H,–C-H,–C-C means that a carbon-hydrogen bond is formed, a different carbon-hydrogen bond is broken, and a carbon-carbon single bond is broken in the reaction.
model has learned to organize reactions it has not seen during training in a sensible manner
that correlates with reactivity. Moreover, different regions in this representation of reaction
ones as in Figure 2d) are highlighted in Figure 3. Because the reaction types are only
based on the bond changes, the reactions within each type involve many different chemical
functionalities; still, the model learns to cluster reactions of the same type together. The
same analysis as shown here using t-SNE is conducted in the Supporting Information using
principal component analysis (PCA), but the separation into reaction type clusters is not as
striking because the first two PCA components only capture 46% of the total variance.
To further show that the model behaves correctly when different functional groups are
present, we analyzed the effects of substituting hydrogen atoms with side chains containing
different functional groups and verified the model predictions using DFT. This analysis
(shown in the Supporting Information) demonstrates that the model correctly identifies that
a substitution of an electronegative group close to the reactive center of a reaction has a large
effect on the activation energy, whereas the substitution of any group far from the reactive
center of another reaction does not affect the activation energy to any significant degree.
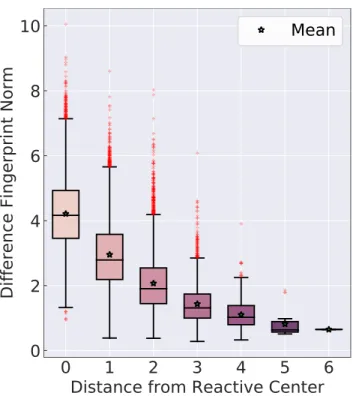
This observation also agrees with the earlier hypothesis that the difference fingerprints
(recall Figure 1) should, on average, have a smaller contribution to the activation energy
for atoms farther from the reactive center, although some distant atoms may influence the
reactivity via electronic or steric effects. Figure 4 shows that the contribution, measured by
the norm of the difference fingerprint, does indeed decrease for atoms that are farther away
from the reactive center.
With quantitative data becoming more readily available through advances in high-throughput
experimentation and more extensive computational resources available for data generation
using, for example, quantum chemistry, quantitative predictions of reaction performance
based on large training sets are becoming increasingly more feasible. Here, we have
demon-strated that activation energies for a diverse set of gas-phase organic chemistry reactions
can be predicted accurately using a template-free deep learning method. We expect that
automated reaction mechanism generation software can strongly benefit from such a model,
0
1
2
3
4
5
6
Distance from Reactive Center
0
2
4
6
8
10
Difference Fingerprint Norm
Mean
Figure 4: Investigation of how the difference fingerprint norm, i.e., contribution to the activation energy prediction, changes as atoms move farther away from the reactive center. The reactive center is defined as those atoms that undergo bond changes in a reaction.
large quantitative data sets will likely result in rapid development of novel machine learning
algorithms suitable for predicting such quantities.
Acknowledgement
We gratefully acknowledge financial support from the the DARPA Make-It program under
contract ARO W911NF-16-2-0023. This research used resources of the National Energy
Research Scientific Computing Center (NERSC), a U.S. Department of Energy Office of
Science User Facility operated under Contract No. DE-AC02-05CH11231.
Supporting Information Available
Detailed description of neural network architecture, training, and hyperparameter
of the six most frequent reaction types; Performance based on number of heavy atoms;
Prin-cipal component analysis of learned reaction encodings; Effect of substituting side chains on
activation energy; Results of DFT calculations for side chain analysis.
References
(1) Kayala, M. A.; Baldi, P. ReactionPredictor: Prediction of Complex Chemical Reactions
at the Mechanistic Level Using Machine Learning. J. Chem. Inf. Model. 2012, 52, 2526–
2540.
(2) Fooshee, D.; Mood, A.; Gutman, E.; Tavakoli, M.; Urban, G.; Liu, F.; Huynh, N.; Van
Vranken, D.; Baldi, P. Deep Learning for Chemical Reaction Prediction. Mol. Syst.
Des. Eng. 2018, 3, 442–452.
(3) Wei, J. N.; Duvenaud, D.; Aspuru-Guzik, A. Neural Networks for the Prediction of
Organic Chemistry Reactions. ACS Cent. Sci. 2016, 2, 725–732.
(4) Liu, B.; Ramsundar, B.; Kawthekar, P.; Shi, J.; Gomes, J.; Luu Nguyen, Q.; Ho, S.;
Sloane, J.; Wender, P.; Pande, V. Retrosynthetic Reaction Prediction Using Neural
Sequence-to-Sequence Models. ACS Cent. Sci. 2017, 3, 1103–1113.
(5) Coley, C. W.; Jin, W.; Rogers, L.; Jamison, T. F.; Jaakkola, T. S.; Green, W. H.;
Barzi-lay, R.; Jensen, K. F. A Graph-Convolutional Neural Network Model for the Prediction
of Chemical Reactivity. Chem. Sci. 2019, 10, 370–377.
(6) Schwaller, P.; Laino, T.; Gaudin, T.; Bolgar, P.; Hunter, C. A.; Bekas, C.; Lee, A. A.
Molecular Transformer: A Model for Uncertainty-Calibrated Chemical Reaction
Pre-diction. ACS Cent. Sci. 2019, 5, 1572–1583.
(7) Segler, M. H. S.; Preuss, M.; Waller, M. P. Planning Chemical Syntheses with Deep
(8) Schwaller, P.; Petraglia, R.; Zullo, V.; Nair, V. H.; Haeuselmann, R. A.; Pisoni, R.;
Bekas, C.; Iuliano, A.; Laino, T. Predicting Retrosynthetic Pathways Using a Combined
Linguistic Model and Hyper-Graph Exploration Strategy. 2019, arXiv:1910.08036.
http://arxiv.org/abs/1910.08036 (accessed October 28, 2019).
(9) Lee, A. A.; Yang, Q.; Sresht, V.; Bolgar, P.; Hou, X.; Klug-McLeod, J. L.; Butler, C. R.
Molecular Transformer Unifies Reaction Prediction and Retrosynthesis Across Pharma
Chemical Space. Chem. Commun. 2019, 12152–12155.
(10) Chen, B.; Shen, T.; Jaakkola, T. S.; Barzilay, R. Learning to Make Generalizable and
Diverse Predictions for Retrosynthesis. 2019, arXiv:1910.09688. http://arxiv.org/
abs/1910.09688 (accessed October 28, 2019).
(11) Lawson, A. J.; Swienty-Busch, J.; Géoui, T.; Evans, D. The Making of Reaxys–Towards
Unobstructed Access to Relevant Chemistry Information. In The Future of the History
of Chemical Information; Chapter 8, pp 127–148.
(12) Mayfield, J.; Lowe, D.; Sayle, R. Pistachio: Search and Faceting of Large Reaction
Databases. American Chemical Society National Meeting. Washington, D.C., 2017.
(13) Evans, M. G.; Polanyi, M. Intertia and Driving Force of Chemical Reactions. Trans.
Faraday Soc. 1938, 34, 11–24.
(14) Sumathi, R.; Carstensen, H. H.; Green, W. H. Reaction Rate Prediction via Group
Additivity Part 1: H Abstraction from Alkanes by H and CH3. J. Phys. Chem. A
2001, 105, 6910–6925.
(15) Sumathi, R.; Carstensen, H. H.; Green, W. H. Reaction Rate Prediction via Group
Additivity, Part 2: H-Abstraction from Alkenes, Alkynes, Alcohols, Aldehydes, and
(16) Saeys, M.; Reyniers, M. F.; Marin, G. B.; Van Speybroeck, V.; Waroquier, M. Ab Initio
Group Contribution Method for Activation Energies for Radical Additions. AIChE J.
2004, 50, 426–444.
(17) Sabbe, M. K.; Vandeputte, A. G.; Reyniers, M. F.; Waroquier, M.; Marin, G. B.
Model-ing the Influence of Resonance Stabilization on the Kinetics of Hydrogen Abstractions.
Phys. Chem. Chem. Phys. 2010, 12, 1278–1298.
(18) Gao, C. W.; Allen, J. W.; Green, W. H.; West, R. H. Reaction Mechanism Generator:
Automatic Construction of Chemical Kinetic Mechanisms. Comput. Phys. Commun.
2016, 203, 212–225.
(19) Gastegger, M.; Marquetand, P. High-Dimensional Neural Network Potentials for
Or-ganic Reactions and an Improved Training Algorithm. J. Chem. Theory Comput. 2015,
11, 2187–2198.
(20) Allison, T. C. Application of an Artificial Neural Network to the Prediction of OH
Radical Reaction Rate Constants for Evaluating Global Warming Potential. J. Phys.
Chem. B 2016, 120, 1854–1863.
(21) Choi, S.; Kim, Y.; Kim, J. W.; Kim, Z.; Kim, W. Y. Feasibility of Activation Energy
Prediction of Gas-Phase Reactions by Machine Learning. Chem.: Eur. J 2018, 24,
12354–12358.
(22) Singh, A. R.; Rohr, B. A.; Gauthier, J. A.; Nørskov, J. K. Predicting Chemical Reaction
Barriers with a Machine Learning Model. Catal. Lett. 2019, 149, 2347–2354.
(23) Suleimanov, Y. V.; Green, W. H. Automated Discovery of Elementary Chemical
Reac-tion Steps using Freezing String and Berny OptimizaReac-tion Methods. J. Chem. Theory
(24) Grambow, C. A.; Pattanaik, L.; Green, W. H. Reactants, Products, and Transition
States of Elementary Chemical Reactions Based on Quantum Chemistry. Sci. Data
2020, (accepted).
(25) Collins, K. D.; Gensch, T.; Glorius, F. Contemporary Screening Approaches to Reaction
Discovery and Development. Nat. Chem. 2014, 6, 859–871.
(26) Yang, K.; Swanson, K.; Jin, W.; Coley, C.; Eiden, P.; Gao, H.; Guzman-Perez, A.;
Hopper, T.; Kelley, B.; Mathea, M. et al. Analyzing Learned Molecular Representations
for Property Prediction. J. Chem. Inf. Model. 2019, 59, 3370–3388.
(27) Grambow, C.; Swanson, K.; Yang, K.; Hirschfeld, L.; Jin, W. chemprop-reaction:
Re-lease version 1.1.0. 2020, https://doi.org/10.5281/zenodo.3712473.
(28) Duvenaud, D. K.; Maclaurin, D.; Aguilera-Iparraguirre, J.; Gómez-Bombarelli, R.;
Hirzel, T.; Aspuru-Guzik, A.; Adams, R. P. Convolutional Networks on Graphs for
Learning Molecular Fingerprints. 2015, arXiv:1509.09292. http://arxiv.org/abs/
1509.09292 (accessed October 29, 2019).
(29) Kearnes, S.; McCloskey, K.; Berndl, M.; Pande, V.; Riley, P. Molecular Graph
Convo-lutions: Moving Beyond Fingerprints. J. Comput. Aided. Mol. Des. 2016, 30, 595–608.
(30) Gilmer, J.; Schoenholz, S. S.; Riley, P. F.; Vinyals, O.; Dahl, G. E. Neural Message
Passing for Quantum Chemistry. 2017, arXiv:1704.01212. http://arxiv.org/abs/
1704.01212 (accessed October 29, 2019).
(31) Fooshee, D.; Andronico, A.; Baldi, P. ReactionMap: An Efficient Atom-Mapping
Al-gorithm for Chemical Reactions. J. Chem. Inf. Model. 2013, 53, 2812–2819.
(32) Osório, N.; Vilaça, P.; Rocha, M. A Critical Evaluation of Automatic Atom Mapping
Algorithms and Tools. 11th International Conference on Practical Applications of
(33) Jaworski, W.; Szymkuć, S.; Mikulak-Klucznik, B.; Piecuch, K.; Klucznik, T.;
Kaźmierowski, M.; Rydzewski, J.; Gambin, A.; Grzybowski, B. A. Automatic
Map-ping of Atoms Across Both Simple and Complex Chemical Reactions. Nat. Commun.
2019, 10 .
(34) Grambow, C. A.; Li, Y.-P.; Green, W. H. Accurate Thermochemistry with Small Data
Sets: A Bond Additivity Correction and Transfer Learning Approach. J. Phys. Chem.
A 2019, 123, 5826–5835.
(35) Mardirossian, N.; Head-Gordon, M. Thirty Years of Density Functional Theory in
Com-putational Chemistry: An Overview and Extensive Assessment of 200 Density
Func-tionals. Mol. Phys. 2017, 115, 2315–2372.
(36) Schütt, K. T.; Sauceda, H. E.; Kindermans, P. J.; Tkatchenko, A.; Müller, K. R. SchNet
- A Deep Learning Architecture for Molecules and Materials. J. Chem. Phys. 2018, 148,
241722.
(37) van der Maaten, L.; Hinton, G. Visualizing Data using t-SNE. J. Mach. Learn. Res.