Deep-web Search Engine Ranking Algorithms
by
Brian Wai Fung Wong
Submitted to the Department of Electrical Engineering and Computer
Science
in partial fulfillment of the requirements for the degree of
Masters of Engineering in Computer Science and Engineering
at the
MASSACHUSETTS INSTITUTE OF TECHNOLOGY
February 2010
@
Massachusetts Institute of Technology 2010. All rights reserved.
Author ...
Department
/ n
..
. . . .
)
...
of Electrical Engi ering and Computer Science
February 8, 2010
Certifiedby.
..Michael Stonebraker
Adjunct Professor
Thesis Supervisor
Accepted by ...
(
Christopher J. Terman
Chairman, Department Committee on Graduate Theses
ARCHNES
MASSACHUSETTS INSTITUTE OF TECHNOLOGYAUG 2
4 2010
LIBRARIES
..* .. u ... ...Deep-web Search Engine Ranking Algorithms
by
Brian Wai Fung Wong
Submitted to the Department of Electrical Engineering and Computer Science on February 8, 2010, in partial fulfillment of the
requirements for the degree of
Masters of Engineering in Computer Science and Engineering
Abstract
The deep web refers to content that is hidden behind HTML forms. The deep web contains a large collection of data that are unreachable by link-based search engines.
A study conducted at University of California, Berkeley estimated that the deep web
consists of around 91,000 terabytes of data, whereas the surface web is only about 167 terabytes. To access this content, one must submit valid input values to the HTML form. Several researchers have studied methods for crawling deep web content. One of the most promising methods uses unique wrappers for HTML forms. User inputs are first filtered through the wrappers before being submitted to the forms. However, this method requires a new algorithm for ranking search results generated by the wrappers. In this paper, I explore methods for ranking search results returned from a wrapped-based deep web search engine.
Thesis Supervisor: Michael Stonebraker Title: Adjunct Professor
Acknowledgments
I would like to thank Professor Stonebraker for his kind guidance and input into this
project. He has provided many instrumental ideas in guiding my research process. In addition, I would like to thank Mujde Pamuk for her patience in helping me debug code, and the whole Goby team for kindly providing assistance in my research. The Goby team has provided many insights into the real-world implementation of a deep web search engine.
I would also like to thank my parents, family, friends, and role models for their
guidance in life. Their advice enabled me to take each step in life with righteousness and awareness. I have gained a tremendous amount of wisdom by listening to their invaluable life lessons.
"A person who never made a mistake never tried anything new."
Contents
1 General Overview
1.1 The deep web .... ...
1.1.1 Information in the deep web . . . .
1.1.2 Difficulty in mining the deep web . . . . 1.2 Background . . . . 1.2.1 Google's deep web efforts . . . . 1.2.2 Commercial deep web engines . . . .
1.3 Morpheus approach for mining the deep web . . . .
1.3.1 CSAIL Morpheus project . . . .
1.3.2 Using wrappers to query the deep web . . . . .
1.3.3 Goby - commercial version of Morpheus project
2 The Ranking Problem
2.1 Research Overview . . . . 2.2 M otivation . . . .
2.3 Deep web result scoring functions . . . .
2.3.1 Goby implementation . . . .
2.3.2 Other scoring functions . . . .
3 Ten 3.1 3.2 factor model Motivation . . . . Model definition . . . .
3.2.1 General linear regression model . . . .
15 . . . . 15 . . . . 15 . . . . 16 . . . . 16 . . . . 17 . . . . 17 . . . . 18 . . . . 18 . . . . 19 . . . . 20 23 . . . . 23 . . . . 24 . . . . 25 . . . . 25 . . . . 26 29 29 30 30
3.2.2 3.2.3
Regression factors . . . . Expansion to the ten factor model . . . .
4 Experiments 4.1 Overview. . . . . 4.2 Experiment design . . . . 4.2.1 Experimental process 4.2.2 Self-consistency score 5 Experiment Results 5.1 Results overview . . . .
5.2 Individual scoring functions . . . . 5.3 Categorizing users and queries . . . .
5.3.1 Grouping by users . . . .
5.3.2 Grouping by queries . . . .
5.4 Generating universal scoring functions . . . .
5.5 Evaluating the new result scoring function . . . .
5.5.1 Data-weighted user category . . . .
5.5.2 Distance/time proximity-weighted user category
5.5.3 Visually-weighted user category . . . .
5.6 Discussion of results . . . . 6 Regression model with 11 factors
6.1 Adding the 1 1th factor . . . . . 6.2 Internal Referral Factor . . . . .
6.3 Regression result . . . .
7 Updating Factor Weights
7.1 Motivation . . . .
7.2 Algorithm for updating weights
7.2.1 Basic update model . . .
7.3 Experimentation . . . . 37 . . . . 3 7 . . . . 3 7 . . . . 3 9 . . . . 4 0 43 . . . . 43 . . . . 44 . . . . 45 . . . . 46 . . . . 48 . . . . 49 . . . . 50 . . . . 50 . . . . 51 . . . . 51 . . . . 53 57 57 57 58 59 . . . . . . . .
8 Conclusion A Source code
B Euclidean distance matrix
63 65
List of Figures
1-1 This figure illustrates the concept of wrappers behind the Morpheus
project. . . . . 19
1-2 This particular data hierarchy demonstrates a deep web search engine designed specifically for travel-related queries. . . . . 20
1-3 Interface of Goby.com as of December 20th, 2009 . . . . 21 2-1 A graphical illustration of how PageRank algorithm works. PageRank
essentially flows amongst linked nodes until an equillibrium state is achieved. Websites with a high number of incoming links (site B and
C above) are considered popular and will receive a high PageRank.
Unlike the shallow web, deep web content do not carry relationships such as hyperlinks. Consequently, a deep web search engine cannot utilize link-based techniques to rank results. Image Credit: Wikipedia 24
3-1 Figure illustrating two search result on Goby. The first result contains additional information not contained in the second result. It includes a business supplied image and a phone number. . . . . 34 4-1 Users are given query via verbal instructions. (1) The user then visits
Goby.com and inputs query terms, and (2) ranks the top 20 search result by providing a quality score C (0... 10) for each individual re-sult. Each user generates 20 scores/query - 20 queries/user = 400 data points/user. . . . . 39
5-1 Figure illustrating two approaches in analyzing individual data. Top:
bucket all 400 data points and generate one scoring function. Bottom: maintain separation of data points and generate 20 scoring functions. The latter approach is taken to ensure self-consistency of data. . . . . 45
5-2 Figure showing the breakdown of user categories. These categories are
defined based on characteristics of their regression factor weights. . . 46
7-1 Figure showing the change in position-weighted quality score after sev-eral re-balancing of weights for scenario one. There is a slow initial ramp-up when weights are being re-balanced slowly. Once the ranking quality has improved, it becomes a positive cycle as users click on more useful item s. . . . . 61
List of Tables
3.1 The ten factors used in the regression model . . . . 31 4.1 This table summarizes the different categories of the twenty queries
used in the experiment. . . . . 38
4.2 Table demonstrating two users where #17 passes and #27 fails the self-consistency test. A factor is statistically significant if its Mean\Std ratio is > 2. The self-consistency test rejects test users if their score is less than 50%, i.e. at least 5 of the 10 factors are statistically sig-nificant. This test is crucial for ensuring the statistical significance of the analysis. For the first user, his factors F1, F5, F6, and F are
statistically significant (mean\std ratio > 2). This represents a self-consistency score of 67%. On the other hand, the second user passes has only two statistically significant factors - F5 and F6. This means
he has a self-consistency score of 25%. N/A factors are ignored as they do not play a role in the regression model. . . . . 41
5.1 This table summarizes the regression results. Each person has an av-eraged scoring function if his behavior passes the self-consistency test outlined in section 4.2.2 . . . . 43
5.2 Table summarizing the results of breaking down user behavior by query
category. It is interesting to note that patterns are much less obvious than previously. This result suggests user preferences do not vary much with respect to query category. It is important to note that preference for the distance and time factors, a5 and a6, are strong and consistent across query category. This indicates a general user preference for time proximity and the presence of a description in the search result. . . . 48
5.3 The table illustrates the position-weighted quality score for (1) using
the basic two-factor scoring function in Goby, and (2) using the
data-weighted ten-factor model in equation 5.2. There appears to be an
improvement in search relevancy by 6.9%. The quality score decreases for user #15 and #23. An explanation for this result could be mis-categorization or bad regression fit for these users. . . . . 52
5.4 The table shows the position-weighted quality score for the basic two-factor scoring function in Goby and the ten-two-factor scoring function for
distance/time proximity-weighted users in equation 5.3. There appears
to be an improvement in search relevancy by 2.4%. . . . . 52 5.5 The table shows the position-weighted quality score for the basic
two-factor scoring function in Goby and the ten-two-factor scoring function for
visually-weighted users in equation 5.4. Search relevancy improves by
7 .0 % . . . . 52
6.1 This table summarizes the factor weights generated after performing 11-factor linear regression. Note the new factor weight all. . . . . 56
7.1 This table summarizes the historical click-rate percentages of the 10
Chapter 1
General Overview
1.1
The deep web
In this section, I will introduce the deep web part of the internet. The topic of searching content in the deep web will be the focus of this Masters of Engineering thesis.
1.1.1
Information in the deep web
The deep web refers to web content that is not part of the surface web, which can be indexed by standard search engines such as Google and Yahoo. A static web page belongs to the surface web, whereas a SQL database accessible through a HTML form belongs to the deep web [22]. These web forms are usually part of script-based web pages written in languages such as PHP, ASP, and Ruby on Rails. Examples of deep web resources include shopping websites, Mapquest, currency converters, and online banking sites. A typical link-based search engine cannot access the deep web because the content is hidden behind these web forms. In order to crawl the deep web content, a search engine has to submit valid input values for the form before the dynamically generated content is created as the result of a specific search [1].
The deep web contains an enormous amount of information. According to a research study conducted at University of California Berkeley in 2003, the surface
web contains approximately 167 terabytes of data [11]. In contrast, the deep web is estimated to contain 91,000 terabytes of data, which is more than 500 times the size of the surface web. This means traditional link-based search engines are not reaching
99% of the content on the World Wide Web. There are tremendous opportunities in
exploring methods for indexing deep web content. The deep web has become one of the most exciting topics in search engine technologies [16].
1.1.2
Difficulty in mining the deep web
The difficulty in indexing the deep web lies in the fact that search engines cannot un-derstand the context of web forms. Without human assistance, search engines cannot submit meaningful search inputs to HTML forms. The challenge of understanding web form becomes a very difficult natural language processing (NLP) problem. Fur-thermore, to create a commercially-available deep web search engine, one needs a scalable method of mining and processing data. Currently, there are only a few
NLP technologies that are scalable to large data sets [14]. Most recently, a paper
published in 2008 outlines a method to use Google's parallel computing framework (MapReduce) for scaling up language processing algorithms [18].
Dynamically generated pages are usually of little value if information is not up-to-date. For example, the billions of possible web pages generated by simple search queries at a travel website means it is virtually impossible to index all of the search results. These dynamic data often change frequently. Thus, a deep web search engine needs to frequently update its index, which can be a very expensive exercise. The lack of hyperlinked data in the deep web also makes it difficult to discover new data and to evaluate the quality of data.[20].
1.2
Background
In this section, I will provide a brief overview of various efforts in searching the deep web. There has been a significant amount of research on this topic. As this portion of the web represents a large percentage of information on the internet, it has long been
acknowledged as a crucial gap in search engine coverage. A large number of research projects have tackled the problem of crawling the deep web in a scalable and efficient manner. However, not many have adapted the wrapper approach in mining the deep web content.
1.2.1
Google's deep web efforts
Google's Alon Halevy is one of the leading figures in deep web search. In his paper entitled Google's Deep Web Crawl [13], he outlined a methodology that crawls deep web content by generating appropiate input fields for HTML forms. If the engine encounters a page with a form related to restaurants, it would start guessing possible search terms -"Italian", " Chinese", " Japanese" etc -until one of these terms returns a meaningful search result. The Google search engine would then index the result data for future queries by the user [24]. The result can be converted into structured data later. In fact, Google Labs released a technology called Google Squared, which adds structures and relationships to raw data, and presents the result in a more organized manner.
In addition to developing an active deep web crawler, Google also published the Sitemap Protocol. The protocol enables websites to advertise accessible URLs that are normally not linked to the shallow web. These URLs would be crawled by Google through an XML file, and are added to their universal search index. In additional to Sitemap protocol, Apache's modoai also achieves search engine content discovery.
1.2.2
Commercial deep web engines
In addition to Google, there are several start-up companies that are developing deep web search engines. Kosmix, for example, is a hybrid deep web crawler and aggregator portal. In addition to indexing data, Kosmix's engine builds a taxonomy of five million categories on various topics.
Pipl is another well-known deep web crawler. Unlike other typical search engines, Pipl focuses on searching personal information. A user can search based on a person's
name, username, or even phone number. Pipl performs most of its search in real-time, i.e. the engine actually queries its sources on the fly. Pipl crawls websites such as MySpace, Hi5, Flickr, and Amazon. The use of a live query ensures the timeliness of its data, however, search performance is sacrificed as a result. Search queries on Pipl generally takes at least 20 seconds to complete, which is orders of magnitude slower than searching for pre-indexed data on Google.
DeepDyve is a deep web crawler that specializes in indexing academic journals. It indexes websites such as ACM.org and Psychological Reviews. Unlike other deep web search engine, DeepDyve gains access to premium articles that are normally not accessible to a shallow web crawler, and makes these content available to the user on a pay-per-view basis. In addition, DeepDyve is a subscription based business, which greatly limits the size of its audience.
1.3
Morpheus approach for mining the deep web
In this section, I will provide an introduction to the MIT Morpheus project, which eventually transformed into a commercial internet deep web search engine called Goby. The Morpheus project was started in CSAIL by Professor Michael Stonebraker. Professor Stonebraker was also the founder of many successful database companies, including Ingres and Postgres systems.
1.3.1
CSAIL Morpheus project
There have been numerous research projects dedicated to creating a deep web search engines. One of the most promising solutions involves the use of wrappers. Morpheus is a research collaboration between MIT and University of Florida. The engine uses website-specific wrappers to crawl the deep web and to transform search result into structured data. The Morpheus search engine initially queries the web on the fly
-very much similar to the Pipl search engine. However, due to the performance and reliability limitations of live searches, the commercial version of Morpheus intelligently fetches information in the deep web and indexes the result.
1.3.2
Using wrappers to query the deep web
A wrapper transforms search terms into the range of possible input fields on any
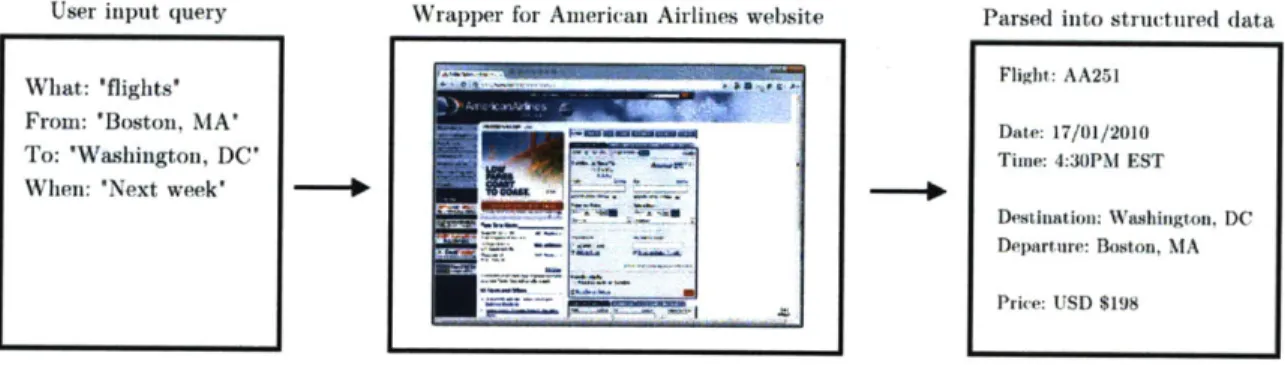
given web form. Each web form would have a unique wrapper written specifically for it. For example, a wrapper would describe how to query a plane ticket website that takes destination and travel dates as input arguments, and returns flight schedules and prices as a result. Figure 1-1 illustrates the concept of wrappers behind the Morpheus search engine.
User input query Wrapper for American Airlines website Parsed into structured data
What: 'flights' Flight: AA251
From: 'Boston, MA' Date: 17/01/2010 To: 'Washington, DC' Time: 4:30PM EST
When: 'Next week'
Destination: Washington. DC
- Departure: Boston, MA
Price: USD $198
Figure 1-1: This figure illustrates the concept of wrappers behind the Morpheus project.
The returned result is parsed into a structured data format. By containing subject, predicate and object triples, this format enables the Morpheus engine to understand meaning and relationship between data. The use of structured data is one of the major advantages of Morpheus over a shallow web search engine. Morpheus preserves the semantics of the returned data, and enables interactive result exploration such as user filtering. The structured data format also allows developers to easily develop website mash-up that take advantage of the Morpheus search engine [8].
Wrappers are usually generated by manual process. With the help of semi-automatic wrapper generation tool, a human being would identify each input for a web form and assign standardized categories to the inputs and outputs. The assign-ment of categories enables search results to be presented in a structured and organized manner to the user. This human-assisted wrapper generation process, however, is not yet scalable. There have been some research studies that attempt to automate the wrapper generation process, but they have not reached commercial applications.
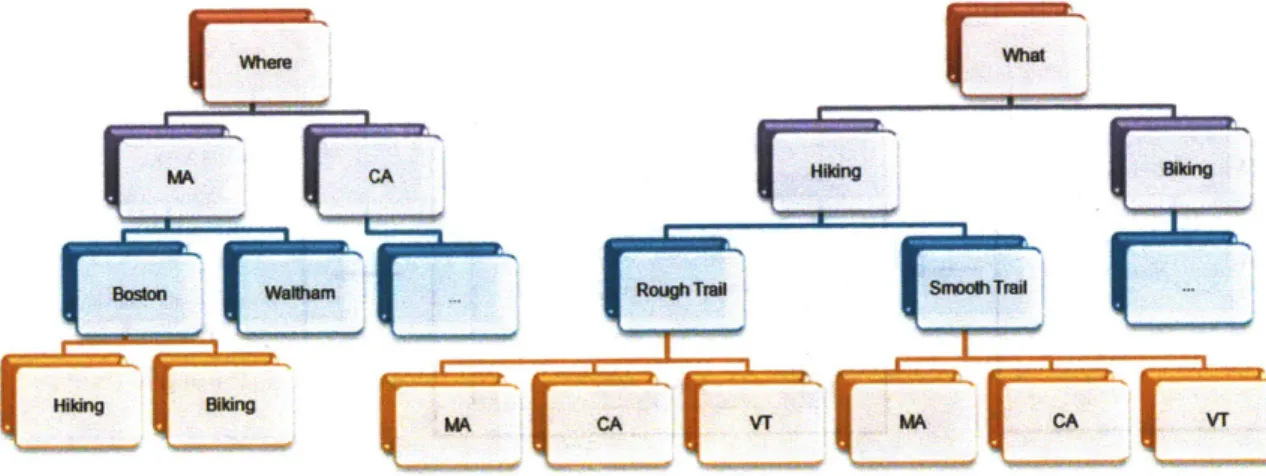
Each wrapper is placed in a category hierarchy. A category hierary describes the "specificity" of a wrapper relative to other wrappers. A wrapper for a Boston Italian restaurant website is more specific than a wrapper for a generic restaurant search site. When a user searches for something in Morpheus, his search terms are first mapped to known categories in the category hierarchy. This matching allows the search engine to select the best wrappers to use. Figure 1-2 shows an example category hierarchy.
Boston RoughTriMOMm
Figure 1-2: This particular data hierarchy demonstrates a deep web search engine designed specifically for travel-related queries.
1.3.3
Goby
-
commercial version of Morpheus project
The core ideas behind the Morpheus project have been implemented in a commercial deep web search engine called Goby. Figure 1-3 shows a the web interface of Goby.com in December 2009. Similar to the Morpheus project, Goby also utilizes website-specific wrappers to crawl the deep web. However, unlike the original project, Goby does not query on the fly. This means the Goby search engine actually indexes deep web content before the user executes the query. This process enables a much higher throughput and a more consistent search performance. A search for restaurants in Boston on Goby.com is generally completed within five seconds.
To achieve the goal of pre-indexing deep web content, the Goby engine structures search term combinations intelligently for each wrapper. For example, a wrapper for a chain restaurant website may take location, time and price as inputs for the HTML
form. The Goby engine essentially forms all possible combinations of these three input fields, and queries the wrapped website. The returned result is parsed into structured data and indexed by the search engine for fast retrieval. The Goby index is updated periodically to reflect that latest information available from its sources.
While pre-indexing deep web resources is crucial for search performance, this method does have its draw-backs. First, the method requires forming all possible combinations of input terms for each wrapper. This imposes a high pre-processing cost for both the Goby crawler and the wrapped website. Unless the website queries are spaced out properly, they can be mis-interpreted as a denial of service (DDoS) attack. Second, at the point of query by the end user, the information is no longer real-time. While this may not be a problem for most information, some information such as weather data or flight information makes sense only if it is real-time.
Chapter 2
The Ranking Problem
2.1
Research Overview
My research with Professor Stonebraker focused primarily on the ranking of search
results generated by a wrapper-based deep web search engine. A search query is essentially a collection of search terms specified by the user. For example, a user query could be "Italian retaurants in Boston, MA" or "Sightseeing and tours in Las Vegas, NV". When a query is submitted to the search engine, the engine would find a list of results that match the user's criteria. However, it is important to present the list in a manner that minimizes user's effort in finding the result he needs. In other words, the engine needs to rank the results by relevance accurately.
Over the course of 6 months, I have worked with the Goby team to devise a new methodology to accurately rank deep web results. Our improved ranking al-gorithm utilizes (1) a best-fit scoring function using ten quality factors, and (2) a dynamic weighting algorithm that changes the factor weighting based on user behav-ior. This algorithm is scalable and requires minimal pre-processing to generate the factor weightings.
2.2
Motivation
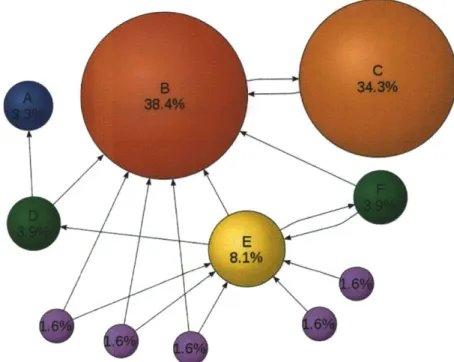
Unlike the surface web, deep web data are not linked together by hyperlinks. Since the data are hidden behind web forms, it is also difficult to infer relationships be-tween data. Typical search ranking algorithms such as the Google PageRank would not work for a deep web search engine (Figure 2-1). The lack of relationship cre-ates a difficult challenge in determining which search result should be ranked first. While one may infer result quality based on knowledge about the origin wrapper, a result content-driven method should yield a more accurate ranking. The goal of my research is to develop an accurate and efficient ranking algorithm for the commercial implementation of the Morpheus project.
E
Figure 2-1: A graphical illustration of how PageRank algorithm works. PageRank es-sentially flows amongst linked nodes until an equillibrium state is achieved. Websites with a high number of incoming links (site B and C above) are considered popular and will receive a high PageRank. Unlike the shallow web, deep web content do not carry relationships such as hyperlinks. Consequently, a deep web search engine cannot utilize link-based techniques to rank results. Image Credit: Wikipedia
2.3
Deep web result scoring functions
In this section, I will present several scoring functions that can be used for ranking search results of a deep-web search engine. These are basic scoring functions that form the basis for the ten-factor scoring functions introduced in chapter 3.
2.3.1
Goby implementation
Currently, the Goby search engine utilizes a simple two-factor scoring fuction to rank results - a combination of distance score d and referral score r. The distance score is inversely proportional to the physical distance between a search result and the location of interest. The referral score represents the popularity of a result amongst wrapped websites. These two factors are each given an appropiate weight to compute the final score used for ranking results.
Score =' d +
#
-r (2.1) When a user searches for results (e.g. an event or a restaurant) at a specific location, he is generally interested in results that are physically close to his location of interest. In addition, result that appears numerous times in the raw search result is an indicator for its popularity.Two factor model
The distance score is a metric indicating the physical proximity between the location of interest, e.g. Boston, and the location of the target result. In the Goby engine, a physical location always exists for every search result. The lower the distance, the higher the distance scoring metric. While the distance score is generally an accurate metric, however, some of the search results do not contain the exact address of the target location. This means the search engine has to approximate the location using the limited information it has regarding the target. It is possible that this approximation pushes less relevant results to the top of the result ranking.
On the other hand, the referral factor is an internal scoring metric generated during the crawl process. Since different wrappers may generate an overlapping set of search results, duplicates may appear in the raw result generated by Goby engine. In general, Goby performs a de-duplication process on the server side before sending back a clean search result back to the client side. When searching for restaurants in Boston, the result "Legal Sea Foods" is very likely appear in multiple wrappers. The referral score calculates the total number of times a specific result appears in the raw search result. The higher the number of duplicates, the higher the referral scoring metric. To a certain extent, this metric is similar to Google's PageRank - it attempts to infer popularity by determining the number of appearance of a particular search result.
Currently, the Goby search algorithm does not perform any dynamic weighting process. In other words, the pre-assigned weights are static attributes determined
by the developers of the algorithm. The lack of a dynamic weighting process that
responds to user behavior is an area of focus for my research work. My work adopts machine learning algorithms commonly used for rebalancing weights. Google, for example, utilizes similar methods for optimizing their search result rankings based on user behavior.
2.3.2
Other scoring functions
Due to the lack of relationship between data, the search engine must determine the quality of a search result based on the limited amount of information regarding it. In this section, I will present two additional methods that can be used for ranking deep web content.
Natural language processing techniques
If a search engine can apply NLP techniques to understand the content of the search
result, then it can also use this understanding to infer content quality. For example, a NLP crawler can intelligently parse the returned result and place content into a
structured database accordingly. The quality of a particular search result can be determined by the amount of structured data it contains.
It is possible to apply common natural language processing techniques such as sta-tistical learning to analyze the contents of the result. Some recent research projects have taken advantage of cheap processing power provided by cloud computing tech-nologies [18]. Nevertheless, NLP requires a huge amount of pre-processing that cannot be parallelized easily. Google has been engaged in projects that explore the possibil-ity of NLP for its search engine. However, most of these projects have stayed at the research level [12]. Furthermore, if the NLP processing occurs in real-time, search performance may be hampered significantly.
Nevertheless, there are a few companies that have successfully incorporated NLP into their search engine technologies. In particular, a start-up called Powerset (ac-quired by Microsoft in 2008) was one of the first commercial search engines that sup-ports basic natural language queries. The Powerset indexing engine performs context categorization during its crawl process, while the query engine performs real-time processing to understand natural language queries.
Shallow-deep web integrated methods
A deep web search engine can utilize a search result's URL as a unique identifier to
check its Google PageRank. While PageRank describes the popularity of a website in the surface web, a more popular deep web result is likely to have a higher PageRank. However, this method has its limitations as well. Data mined from the deep web may not necessarily have a shallow web counterpart. Furthermore, even if there exists a shallow web counterpart, the two may have very different data quality. For example, if a travel search engine such as Goby or Kayak discovers a ticket website that contains details about a JFK-+HKG flight on United Airlines, this result may get ranked higher than an equivalent Cathay Pacific Airlines flight simply because United Airlines has a high Google PageRank. As a result, using Google PageRank can skew the ranking towards "more popular" sites with high PageRank.
Chapter 3
Ten factor model
In this section, we introduce the ten-factor model for ranking deep-web search results. The model weights are calculated using a regression model developed in Visual Ba-sic, Data Analysis Toolpak and AMPL. Data for the regression model are obtained through hundreds of experimental search query evaluations outlined in Chapter 4. Out goal is to apply experimental data to the regression model, which generates best-fit factor weights.
3.1
Motivation
Motivated by previous factor-based models, we want to develop a more sophisticated model that can capture users preference for evaluating the quality of search results. Consequently, we can utilize this factor-based model as a scoring function for ranking deep web search results. The factor weights are obtained by linear regression using experimental data. This method can be easily implemented in the current infras-tructure of search engines and is highly scalable with little pre-processing overhead. There has been numerous research on the topic of distributed regression models [2].
In chapter 4, we explore in more details the experimental process we used for determining the factor weights of the scoring function. This chapter will be more focused on the theoretical underpinnings of the model.
3.2
Model definition
In this section, we will define the ten factors of the regression model. The ten factors represent possible metrics a typical user would look for when they evaluate the quality of search result. Once the factor weights are determined in the regression analysis, the model is used by the engine for ranking search results.
3.2.1
General linear regression model
The ten-factor linear regression model has the following general form:
10
R = ao + ai - F + e (3.1)
i=1
The entity R, which ranges from 0 to 10, is defined as the quality score of a particular search result.
In the regression model, this quality score is provided by the user during the experiment. This score represents quantitatively the usefulness of a particular search result to the user. The factors in the model, F, are defined in table 3.2.2. These factors represent features accessible to the user on the Goby search engine. The weight a for each factor is obtained through regression analysis.
The linear regression model we adopt is an error minimization regression model, i.e. we are finding "best-fit" factor weights to minimize the error. The error, E, is defined as the difference between the actual experimental value, R, and the calculated value, R, using regressed factor weights. Essentially, the regression model minimizes the sum of error squared [19]. The error minimization problem can be rewritten as a convex optimization problem as follows:
N min (Ri - R) 2 (3.2) i=1i n s.t. Ri = ao
+
aj - Fi (3.3) j=1 a ;> 0 Vj C (0...n) (3.4)We utilize a convex optimization technique called Karush-Kuhn-Tucker conditions (KKT) combined with Newton's Method for solving the optimization problem. This is a convex problem because the objective function and the constraints satisfy convexity conditions. The factor weights ac generated from this optimization problem represent the best-fit line for original ten-dimensional regression model [10].
3.2.2
Regression factors
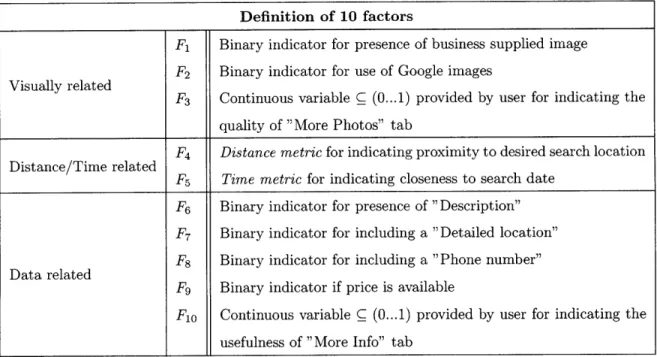
The following table defines the 10 factors used in the above linear regression model. These factors are chosen carefully as they represent qualities users look for in the search result when they evaluate how useful it is. Our goal is to closely model user behavior using a best-fit linear regression model. While it is possible to add additional factors to the model, we want to keep our factor limited to features and data that are available to the user in the Goby interface.
The definitions for factor F4 and F5 are discussed in more details below. These
two factors play an important role in determining the relevancy of the search result. During the experiment, it was observed that users exhibit preferences for proximity in location and time when they evaluate the quality of search result.
Definition of 10 factors
Fi Binary indicator for presence of business supplied image
F2 Binary indicator for use of Google images Visually related
F3 Continuous variable C (0... 1) provided by user for indicating the quality of "More Photos" tab
F4 Distance metric for indicating proximity to desired search location
Distance/Time related
F5 Time metric for indicating closeness to search date
F6 Binary indicator for presence of "Description"
F7 Binary indicator for including a "Detailed location"
F8 Binary indicator for including a "Phone number" Data related
F9 Binary indicator if price is available
Fio Continuous variable C (0...1) provided by user for indicating the usefulness of "More Info" tab
Distance metric
We define the distance metric as a normalized score that is inversely proportional to the distance between the target result location, and the location of interest. The orig-inal location of interest is indicated by the user when the search query is constructed. The distance score, D, is normalized before being used as a variable in the regres-sion model. This score is computed in Excel before the data is fed into the regresregres-sion model. The justification for normalization is that we ask users to rank only the top 20 search results. Therefore, we would like to construct a distance metric that com-pares only the relative proximity to desired location amongst these 20 results. The normalized metric is defined as follows:
- Dmax- D
D = (3.5)
-Dmax - Dmin
D C (0... 1) is the normalized distance metric, while Dmax and Dmin are the maximum
and minimum distance within the ranked 20 search results, and D is the actual physical distance indicated by the Goby engine.
This definition of the distance metric captures user's preference for physical prox-imity. For example, when the user searches for restaurants near 77 Massachusetts Avenue Cambridge, a result that is closest to the requested point of interest should have a distance score of 1. On the other hand, results that are farther away should have lower distance scores. Given our observations during the experimental process, we believe users have measurable preference for the physical proximity of the target result. In chapter 5, the relatively large regression weight in the regression model indicates such a preference. While the experimental queries use cities as search loca-tions, this fact does not change our conclusion that users value physical proximity of the result. If the user has a more specific location in mind, it would not be surprising a even higher emphasis on physical proximity.
Time metric
We define the time metric as another normalized score within the
{0...
1} range. The time metric is defined as 1 for results that do not have a specified date, i.e. businesses/attractions that are available daily, or results that occur within one day range of the query date. The query date is usually defined by the user in the search query. However, if the date is not defined, then it is assumed to be the day at which the query is executed.Similar to the distance metric, the time metric is defined as follows:
-T a- T
T = max (3.6)
Tmax - Tmin
T C (0 ...1) is the normalized time metric, while Tmax and Tmin are the maximum and
minimum number of days from the query date amongst the 20 ranked results, and T is the actual number of days away for a particular search result.
The time metric models user preference for closeness in the time dimension. In chapter 5, we discuss in details the importance of time proximity to the user. In the experimental search queries, no specific time is provided to the search engine. The reason is that is that users generally do not have a specific date in mind. It is more helpful to the user to see all the results and to allow them to to discover the useful results by using filters/sorting. In addition, by not specifying a time, the engine returns a more diversed list of search results to the user. This provides a greater varierty in features for the regression model to identify the important factors. It is observed that users demonstrates a consistent behavior that shows a very strong preference for time proximity. In other words, experimental users appear to place significant value on search results (e.g. an event) that are taking place close to the search date.
Example search query and result
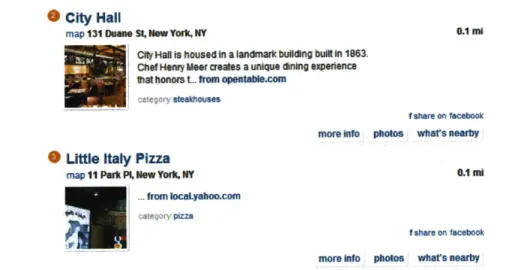
Figure 3-1 illustrates two example results obtained when a user searches for "Retau-rants in New York City, NY". The first result would obtain 1 for the first factor F1,
as it contains an image supplied by the business itself. The distance metric factor, F4,
is 1 because this restaurant is physically closest to the location of interest (New York City). The time metric factor, F5, is also 1 because the retaurant is open daily. This
result also contains a description, a detailed location, and a phone number (inside "More Info" tab). Thus, F6, F7, and F8 are 1 as well. The remaining factors are zero.
Unlike the first result, the second result does not contain a description of the business. In addition, instead of having a business supplied image, this result con-tains an image pulled from Google Images. It also does not have a phone number. Consequently, its factors F1, F2, and F8 are 0, 1, 0 respectively. It is interesting to
note that the F3 and Fio factors are 0 for both results, as the "More photos" and
"More info" tabs do not contain additional useful information.
* City Hall
map 131 Duane St, New York, NY 0.1 mi
* w Haln is housed In a landmark bulkdng built in 1863.
Chef Hey Meer creates a unique dining experence
that honors t.. from opentable.com
I tegory steakhouses
f share on facebook
more info photos wtars nearby
SLittle Italy Pizza
map 11 park P, New York, Ny 0.1i
ftm locaLyahoo.con
category pizza
f share on facebook
more info photos whars nearby
Figure 3-1: Figure illustrating two search result on Goby. The first result contains additional information not contained in the second result. It includes a business supplied image and a phone number.
3.2.3
Expansion to the ten factor model
While we have limited our model to feature-oriented factors, we can expand it to include factors based on data that are not accessible to the user. These include factors such as Google PageRank, the internal referral score defined in section 2.3.1, category hierchy metrics, and other statistical scores. In particular, the referral score and the category hierchy metrics are Goby-specific factors.
Google PageRank and internal referral score
The internal referral score counts the total number of appearance of a particular result amongst all the deep web wrappers. Its goal is very much the same as Google PageRank, as both metrics attempt to measure the popularity of an entity. Thus, it is possible to utilize these to metrics together in a way that captures the shallow web popularity through PageRank, and the deep web popularity through referral score.
In an iteration of the ten factor model, I will add in the referral score as the
1 1th factor. As seen in chapter 6, this metric is ranked 3 rd highest by factor weight.
However, in terms of weight value, its weight is actually not that large compared to the two most important factors.
Category hierarchy metric
Goby utilizes a category hierarchy to place its wrappers and cached crawl results (Figure 1-2). Thus, it is possible that the search engine can guess the quality of a result based on where it is located on the hierarchy. For example, suppose the user is searching for restaurants in Boston. The result "Legal Seafoods" is most likely placed in the category called "Retaurants", whereas the result "Faneuil Hall" is likely to be placed in categories such as "Things to do", "Events", and "Restaurants". In other words, "Faneuil Hall" is a less specific result than "Legal Seafoods", and should be ranked lower.
In addition to using the number of matches in the category hierarchy, the search engine can also use the location of a wrapper to infer its specificity. A wrapper that is deep in the hierarchy tree is more specific than a wrapper that is higher up. However, it is possible that one branch of the hierarchy tree is simply much deeper than another branch of tree, allowing a wrapper to be placed lower down. The use of the category hierarchy metric appears to be a promising research direction in future work.
Chapter 4
Experiments
4.1
Overview
600 experimental queries were conducted with 30 test subjects. Each person was asked
to rank the top 20 search results of 20 different queries. The goal of our experiment is to provide enough data points to execute a reliable linear regression and obtain the
10 factor weights, ai. These factor weights would form a 10-factor scoring function
that can be used for ranking results more accurately than the current 2-factor scoring function.
4.2
Experiment design
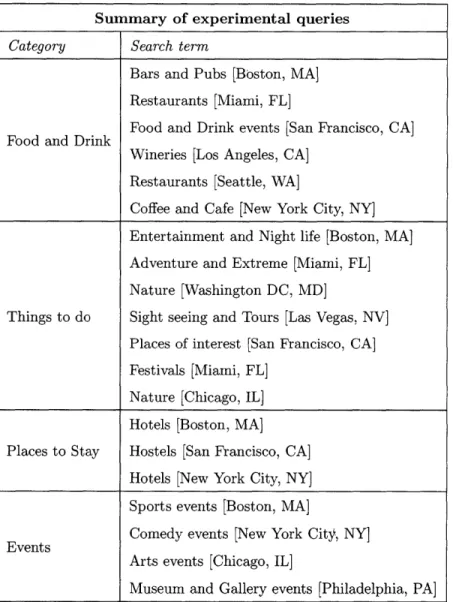
We have prepared 20 unique queries covering four broad categories. These queries represent a variety of different travel-related topics and locations that may be of interest to a typical user. The 20 queries are summarized in table 4.2. These queries are structured based on the commercially available Goby.com search engine, and include categories such as "Food and Drinks", "Places to Stay", and "Attractions".
30 experimental users of different ethnicity, gender, and age were asked to execute
these 20 queries. By seeking user's opinion on individual search result, we hope to determine quantitatively how users evaluate the quality of search results in general. For each individual query, we ask users to provide a quality score from 0 to 10 for
the top 20 results returned by the Goby engine. The quality score is then used as the independent variable in the linear regression model outlined in chapter 3.
For every test user, we generate 20 scoring functions after running the regression model. These 20 scoring functions are then checked for self-consistency to ensure the user is exbiting consistent behavior in evaluating the quality of search results. The process for checking self-consistency score is outlined in section 4.2.2, where we have defined a self-consistency score. Users with low self-consistency scores are rejected, and are not used for generating the universal scoring function.
Table 4.1: This table summarizes the different categories of the twenty queries used in the experiment.
Summary of experimental queries
Category Search term
Bars and Pubs [Boston, MA] Restaurants [Miami, FL]
Food and Drink Food and Drink events [San Francisco, CA] Wineries [Los Angeles, CA]
Restaurants [Seattle, WA]
Coffee and Cafe [New York City, NY] Entertainment and Night life [Boston, MA] Adventure and Extreme [Miami, FL] Nature [Washington DC, MD]
Things to do Sight seeing and Tours [Las Vegas, NV] Places of interest [San Francisco, CA] Festivals [Miami, FL]
Nature [Chicago, IL] Hotels [Boston, MA] Places to Stay Hostels [San Francisco, CA]
Hotels [New York City, NY] Sports events [Boston, MA]
Events Comedy events [New York City, NY]
Arts events [Chicago, IL]
We have chosen to run relatively general queries because they tend to yield a large variety of results. This means there is usually a significant variation in the quality of results, as the search engine draws results from many different sources. This diversity allows the regression model to accurately single out important factors to the users when they evaluate the quality of search results. In future work, we would like to run queries with a variety of specificity and observe how regression results would differ.
4.2.1
Experimental process
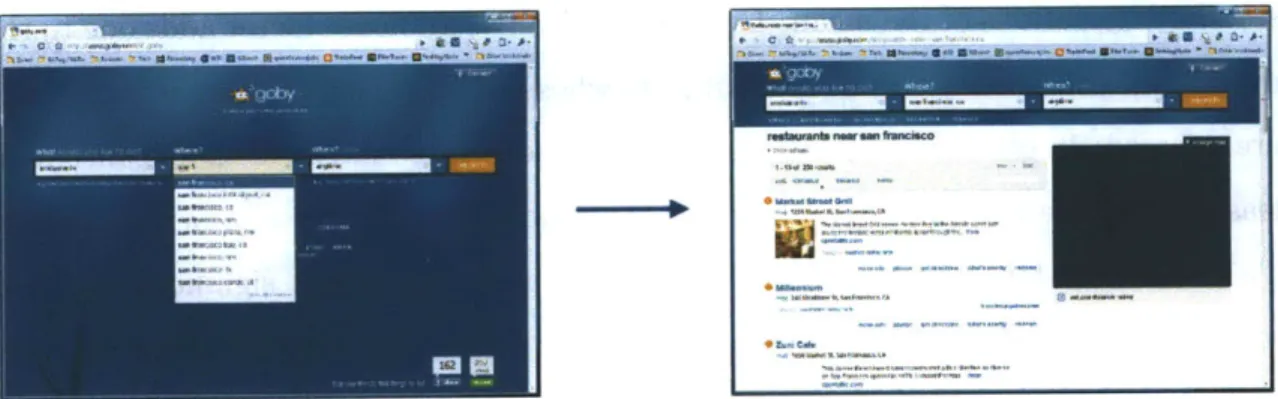
The goal of the experimental process is to simulate a regular deep web query on Goby, i.e. the user is performing the search himself. We provide the query terms verbally to the user. The user then visits Goby.com and keys in the query terms manually. Next, we ask the user to provide a quality score within (0 ...10) for the top 20 search results. Figure 4-1 illustrates the experimental search process on Goby.com.
In addition to registering the quality score, user behavior and comments during the experiment are carefully observed to help us understand how site visitors would evaluate the search quality on Goby's site. User's behavior helps us identify factors that are important to them. This in turn enables us to define meaningful factors in the regression model.
Figure 4-1: Users are given query via verbal instructions. (1) The user then visits Goby.com and inputs query terms, and (2) ranks the top 20 search result by pro-viding a quality score C (0... 10) for each individual result. Each user generates 20
4.2.2
Self-consistency score
The self-consistency score, o, ensures each human test subject is exhibiting consistent behavior when ranking search results. In general, a user's method for evaluating the quality of search result is an inherent psychological behavior that does not deviate within a short period of time. While most test subjects appear to demonstrate a high level of self-consistency, a few (around 23%) are not statistically self-consistent. Prob-lem arises when we factor inconsistent individual scoring functions into our universal scoring function. The factor weights are contaminated by statistically insignificant values.
Consequently, we need a method to determine the self-consistency of users. We define the self-consistency score of a user as follows:
10
0.- = E(4.1)
O3 is defined over the 20 queries executed by each user. It is defined as:
1 avg(F)/std(Fi) > 24
0 otherwise
A particular factor is statistically significant if zero is not contained within two
standard deviations of the mean. Every statistically significant factor adds one to the overall self-consistency score. Test subjects whose self-consistency score is less than 5 are rejected. In other words, only users who demonstrate statistical significance in at least half of the ten factors are used for constructing the universal scoring function. This self-consistency test is crucial for ensuring the statistical significance of any resulting universal scoring functions. Table 4.2 shows the scenario where test user
#17 passes the test, while test user #27 fails the test.
The self-consistency score ranges anywhere from 1 to 8 in the experimental data. Amongst the 30 test users, 7 of them are statistically inconsistent (23%). While this is a relatively small percentage of the total size, most scores are clustered in the 4
fail the self-inconsistency test (50%). If the cut-off score is changed to 7, then 19 users would fail (63%). The error tolerance greatly affects the number of available data points. The 50% cut-off was chosen because we believe that user's behavior is essentially predictable and can be captured by a scoring function.
Test
# F1 F2 F3 F4 F5 F6 F7 F8 F9 F10
Mean 0.70384 0.00000 0.00000 0.59534 1.27219 2.84019 0.45990 0.00000 0.25233 0.00000 6 17 Std 0.21851 0.00000 0.00000 0.50035 0.59290 0.97249 0.40394 0.00000 0.09682 0.00000
Mean/Std 3.22109 N/A N/A 1.18985 2.14573 2.92052 1.13854 N/A 2.60620 N/A
Mean 0.53329 0.24260 0.04736 0.37812 0.74156 1.07418 0.45089 0.00000 0.12637 0.00000 2 27 Std 0.38913 0.13049 0.02529 0.42094 0.35105 0.33895 0.79334 0.00000 0.19944 0.00000
I___ Mean/Std 1.37046 1.85925 1.87218 0.89827 2.11241 3.16917 0.56834 N/A 0.63364 N/A
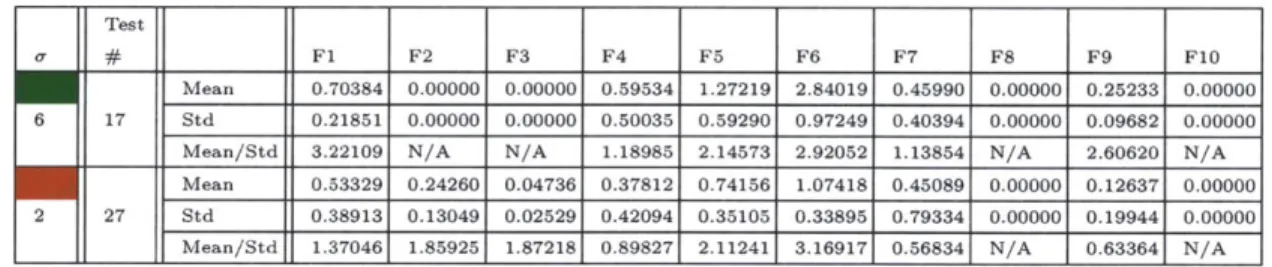
Table 4.2: Table demonstrating two users where #17 passes and #27 fails the self-consistency test. A factor is statistically significant if its Mean\Std ratio is > 2. The self-consistency test rejects test users if their score is less than 50%, i.e. at least
5 of the 10 factors are statistically significant. This test is crucial for ensuring the
statistical significance of the analysis. For the first user, his factors F1, F5, F6, and F
are statistically significant (mean\std ratio > 2). This represents a self-consistency score of 67%. On the other hand, the second user passes has only two statistically significant factors - F5 and F6. This means he has a self-consistency score of 25%.
N/A factors are ignored as they do not play a role in the regression model.
Chapter 5
Experiment Results
5.1
Results overview
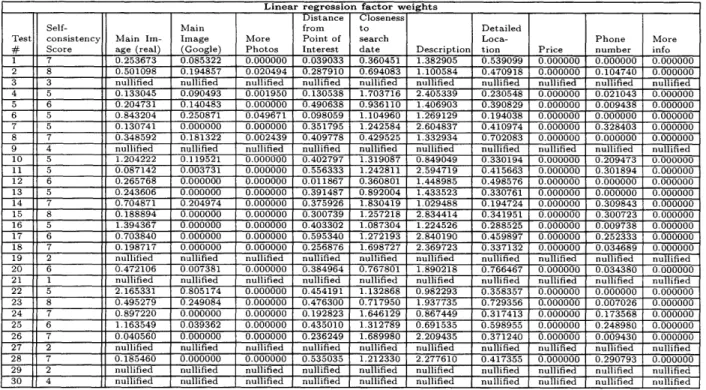
The result of the linear regression model are summarized in table 5.1. In the ex-periments, we have conducted 600 search queries on Goby, involving 30 test users in evaluating the quality of search results.
Linear regression factor weights Distance Closeness
Self- Main from to Detailed
Test consistency Main Im- Image More Point of search Loca- Phone More
# Score age (real) (Google) Photos Interest date Description tion Price number info
1 7 0.253673 0.085322 0.000000 0.039033 0.360451 1.382905 0.539099 0.000000 0.000000 0.000000
2 8 0.501098 0.194857 0.020494 0.287910 0.694083 1.100584 0.470918 0.000000 0.104740 0.000000
3 3 nullified nullified nullified nullified nullified nullified nullified nullified nullified nullified
4 5 0.133045 0.090493 0.001950 0.130538 1.703716 2.405339 0.230548 0.000000 0.021043 0.000000
5 6 0.204731 0.140483 0.000000 0.490638 0.936110 1.406903 0.390829 0.000000 0.009438 0.000000
6 5 0.843204 0.250871 0.049671 0.098059 1.104960 1.269129 0.194038 0.000000 0.000000 0.000000
7 5 0.130741 0.000000 0.000000 0.351795 1.242584 2.604837 0.410974 0.000000 0.328403 0.000000
8 7 0.348592 0.181322 0.002439 0.409778 0.429525 1.332934 0.702083 0.000000 0.000000 0.000000
9 4 nullified nullified nullified nullified nullified nullified nullified nullified nullified nullified
10 5 1.204222 0.119521 0.000000 0.402797 1.319087 0.849049 0.330194 0.000000 0.209473 0.000000 11 5 0.087142 0.003731 0.000000 0.556333 1.242811 2.594719 0.415663 0.000000 0.301894 0.000000 12 6 0.265768 0.000000 0.000000 0.011867 0.360801 1.448985 0.498576 0.000000 0.000000 0.000000 13 5 0.243606 0.000000 0.000000 0.391487 0.892004 1.433523 0.330761 0.000000 0.000000 0.000000 14 7 0.704871 0.204974 0.000000 0.375926 1.830419 1.029488 0.194724 0.000000 0.309843 0.000000 15 8 0.188894 0.000000 0.000000 0.300739 1.257218 2.834414 0.341951 0.000000 0.300723 0.000000 16 5 1.394367 0,000000 0.000000 0.403302 1.087304 1.224526 0.288525 0.000000 0.009738 0.000000 17 6 0.703840 0.000000 0.000000 0.595340 1.272193 2.840190 0.459897 0.000000 0.252333 0.000000 18 7 0.198717 0.000000 0.000000 0.256876 1.698727 2.369723 0.337132 0.000000 0.034689 0.000000
19 2 nullified nullified nullified nullified nullified nullified nullified nullified nullified nullified
20 6 0.472106 0.007381 0.000000 0.384964 0.767801 1.890218 0.766467 0.000000 0.034380 0.000000
21 1 nullified nullified nullified nullified nullified nullified nullified nullified nullified nullified
22 5 2.165331 0.805174 0.000000 0.454191 1.132868 0.982293 0.358357 0.000000 0.000000 0.000000 23 8 0.495279 0.249084 0.000000 0.476300 0.717950 1.937735 0.729356 0.000000 0.007026 0.000000
24 7 0.897220 0.000000 0.000000 0.192823 1.646129 0.867449 0.317413 0.000000 0.173568 0.000000 25 6 1.163549 0.039362 0.000000 0.435010 1.312789 0.691535 0.598955 0.000000 0.248980 0.000000
26 7 0.040560 0.000000 0.000000 0.236249 1.689980 2.209435 0.371240 0.000000 0.009430 0.000000
27 2 nullified nullified nullified nullified nullified nullified nullified nullified nullified nullified
28 7 0.185460 0.000000 0.000000 0.535035 1.212330 2.277610 0.417355 0.000000 0.290793 0.000000
29 2 nullified nullified nullified nullified nullified nullified nullified nullified nullified nullified
30 4 nullified nullified nullified nullified nullified nullified nullified nullified nullified nullified
Table 5.1: This table summarizes the regression results. Each person has an averaged scoring function if his behavior passes the self-consistency test outlined in section 4.2.2
In this section, we present the process for analyzing the results of the experiments. In particular, the discussion focuses on how to transform the raw data into universal scoring functions used in Goby. This section provides the groundwork for the next section, which presents the algorithm for dynamically updating weights based on user behavior. The focus of this section is on the following topics:
" Generating individual scoring functions " Categorizing users and queries
* Generating universal scoring functions
" Change in quality of search result ranking
5.2
Individual scoring functions
Each test user executed 20 search queries on Goby's website. For each query, users were asked to provide the quality score, R (Section 3.2.1), for every individual result ranked in the top 20 by Goby.
There are two approaches in analyzing these data - (1) group all 400 data points
into one single bucket and perform linear regression as if all data points are generated in a single session; (2) maintain data separation and run linear regression only on the 20 data points of each query, i.e. generating 20 scoring functions for each individual. Figure 5-1 illustrates the two approaches. We have chosen the latter approach in the analysis, as we believe it is crucial to ensure the test user is exhibiting consis-tent behavior across queries. In other words, if a user has more than five factors that are statistically insignificant (high variability), this user's behavior is considered inconsistent. Consequently, it does not make sense to generate a scoring function for an inconsistent user. His results are not included in the categorization of users and creation of universal scoring functions. In addition to maintaining statistical significance, putting all users into one bucket prevents us from analyzing individual behavior, which could yield interesting categorization of users as seen in section 5.3.