HAL Id: inserm-00188495
https://www.hal.inserm.fr/inserm-00188495
Submitted on 19 Nov 2007
HAL is a multi-disciplinary open access archive for the deposit and dissemination of sci-entific research documents, whether they are pub-lished or not. The documents may come from teaching and research institutions in France or abroad, or from public or private research centers.
L’archive ouverte pluridisciplinaire HAL, est destinée au dépôt et à la diffusion de documents scientifiques de niveau recherche, publiés ou non, émanant des établissements d’enseignement et de recherche français ou étrangers, des laboratoires publics ou privés.
Evidence of functional connectivity between auditory
cortical areas revealed by amplitude modulation sound
processing.
Marie Guéguin, Régine Le Bouquin-Jeannès, Gérard Faucon, Patrick Chauvel,
Catherine Liégeois-Chauvel
To cite this version:
Marie Guéguin, Régine Le Bouquin-Jeannès, Gérard Faucon, Patrick Chauvel, Catherine Liégeois-Chauvel. Evidence of functional connectivity between auditory cortical areas revealed by amplitude modulation sound processing.. Cerebral Cortex, Oxford University Press (OUP), 2007, 17 (2), pp.304-13. �10.1093/cercor/bhj148�. �inserm-00188495�
EVIDENCE OF FUNCTIONAL CONNECTIVITY BETWEEN AUDITORY
CORTICAL AREAS REVEALED BY AMPLITUDE MODULATION SOUND
PROCESSING
Marie Guéguin
1,2-CA, Régine Le Bouquin-Jeannès
1,2, Gérard Faucon
1,2,
Patrick Chauvel
3and Catherine Liégeois-Chauvel
31- INSERM, U642, Laboratoire Traitement du Signal et de l’Image, Rennes, France 2- Université de Rennes 1, LTSI, Campus de Beaulieu, Rennes 35042 Cedex, France 3- INSERM, U751, Laboratoire de Neurophysiologie et Neuropsychologie, Marseille,
France.
CA- LTSI – INSERM U642
Bâtiment 22 – Campus de Beaulieu 35042 Rennes Cedex
Tel : (33) 2 23 23 52 99 Fax : (33) 2 23 23 69 17
Email : [email protected]
HAL author manuscript inserm-00188495, version 1
HAL author manuscript
ABSTRACT
The human auditory cortex includes several interconnected areas. A better understanding of the mechanisms involved in auditory cortical functions requires a detailed knowledge of neuronal connectivity between functional cortical regions. In human, it is difficult to track in vivo neuronal connectivity. We investigated the inter-area connection in vivo in the auditory cortex using a method of directed coherence (DCOH) applied to depth auditory evoked potentials (AEPs). This paper presents simultaneous AEPs recordings from insular gyrus, primary and secondary cortices (Heschl’s gyrus and planum temporale) and associative areas (BA 22) with multilead intracerebral electrodes in response to sinusoidal modulated white noises in four epileptic patients who underwent invasive monitoring with depth electrodes for epilepsy surgery. DCOH allowed estimation of the causality between two signals recorded from different cortical sites. The results showed: (i) a predominant auditory stream within the primary auditory cortex (PAC) from the most medial region to the most lateral one whatever the modulation frequency (MF), (ii) unidirectional functional connection from the primary to secondary auditory cortex, (iii) a major auditory propagation from the posterior areas to the anterior ones, particularly at 8, 16 and 32 Hz, (iv) a particular role of Heschl’s sulcus (HS), dispatching information to the different auditory areas. These findings suggest that cortical processing of auditory information is performed in serial and parallel streams. Our data showed that the auditory propagation could not be associated to an unidirectional traveling wave but to a constant interaction between these areas, that could reflect the large adaptive and plastic capacities of auditory cortex. The role of the insular gyrus is discussed.
Keywords:
Amplitude modulated sounds; Auditory cortical areas; Directed coherence; Human; Propagation
INTRODUCTION
The human auditory cortex includes several interconnected areas. The complexity of these interacting structures presents a challenge to researchers to determine how this system analyzes and uses auditory information. Indeed, auditory perception comprises the discrimination of a vast array of sound features such as pitch, rhythm, timbre, loudness, or amplitude modulations. Neurophysiologically speaking, the discrimination of two successive sounds differing in one parameter reflects the discrimination of two different neural representations evoked in the same or a different group of neurons. Perception of stimulus change is strongly correlated with the amplitude, latency and other parameters of surface as well as depth-recorded evoked potentials (EPs) (for review, Eggermont and Ponton, 2002). Depth EPs, only detected if a sufficient number of neurons are activated synchronously, have allowed physiological distinction of some of the auditory areas defined by cytoarchitectonic criteria (Braak, 1980; Galaburda and Sanides, 1980; Liégeois-Chauvel
et al., 1991, 1994; Howard et al., 2000). Eloquent auditory cortical areas have been found within
the posterior two-thirds of the superior temporal gyrus including Heschl’s gyrus (HG), planum temporale (PT), the most posterior part of superior temporal gyrus (STG) (Post T1), insular gyrus (IG) and parietal operculum (Liégeois-Chauvel et al., 2004). Little is known about their functional organization and their connectivity, and most current beliefs are derived from work on animals in whom physiological and functional data could be interpreted within an anatomical framework (Rauschecker et al. 1997, 1998; Kaas and Hackett, 1998, 2000). The primate auditory cortex is subdivided into three areas: the core, belt, and parabelt. Most work has shown that auditory information is distributed from the core areas to surrounding belts that relay information to parabelt regions (for review, Kaas et al., 1999; Kaas and Hackett, 2000).
To our knowledge, only a few studies exist on the connectivity between human auditory areas. Most of these have been performed on post-mortem human brains by use of tracer injections (Rivier and Clarke, 1997; Galuske et al., 1999; Tardif and Clarke, 2001), which prevented observation of the
propagation of evoked activity in vivo, or in animals (Ruttgers et al., 1990; Morel and Kaas, 1992; Kosmal et al., 1997; Wallace et al., 2002). In a previous study (Liégeois-Chauvel et al., 1991), we showed that direct electrical stimulation of HG resulted in unidirectional connection from the medial part of HG (PAC) to its lateral part (SAC) and to PT. In a recent study, Howard et al. (Howard et al. 2000), using the same method, showed that electrical stimulation of HG resulted in short latency AEPs in an area that overlapped with the posterior lateral STG (associative auditory cortex), indicating that this area received a corticocortical input, either directly or indirectly from HG.
Previous data have shown that four auditory areas can be identified from the morphological distribution of auditory evoked potentials (AEPs) within the STG: (1) the primary auditory cortex (PAC), located in the medial and intermediate part of HG, (2) the secondary auditory cortex (SAC), located in the lateral part of HG and the planum temporale (PT), (3) an area located in the posterior part of STG (Post T1), and (4) an area located in front of HG, in the anterior part of STG (BA 22) (Liégeois-Chauvel et al., 1991, 1994). In the present study, we had the opportunity to record depth AEPs simultaneously from some of these auditory cortical areas, in epileptic patients suffering from drug resistant epilepsy, during the pre-surgical evaluation of epilepsy surgery (Bancaud et al., 1965).
The aim of the present work was to study the connectivity which exists between these areas using the algorithm of directed coherence (DCOH) introduced by Saito and Harashima (Saito and Harashima 1981), based on multivariate autoregressive (AR) models and Granger causality, which outputs the directional coherences between two EEG signals recorded from distinct regions.
Microelectrode studies in the cat have shown that the synchronized firing rate was always strongly affected by modulation frequency (Schreiner and Urbas, 1986, 1988). Indeed, the sensitivity to AM
frequency appeared to be distributed in cortical areas and reflected as modulations in firing rate that were synchronous across areas (Eggermont, 1994, 1999, 2000). The neural code employed by the auditory system is therefore likely to be determined by the innate areas of the auditory cortex, and the connections of the pathways between these areas and the properties of their neurons produce the coded representation (Ehret, 1997). We used amplitude modulation sound of different modulation frequencies to identify the different pathways.
MATERIALS AND METHODS
Patients
Four patients (two males, two females, 25-35 years of age), among the 20 patients who participated in the study reported in (Liégeois-Chauvel et al., 2004), participated in the present study. They suffered from drug-resistant partial epilepsy and were implanted with chronic SEEG electrodes in the right (2 patients) or in the left auditory cortex (2 patients). Several additional electrodes were implanted in various cortical structures in order to: (i) determine which structures were involved in the initiation and propagation of seizures, and (ii) accurately delineate the limits of future cortical excision (Talairach et al., 1974). The choice of the anatomical location of electrodes was based on clinical and video-EEG recordings and on magnetic resonance imaging (MRI), and was made independently of the present study. Physiology of the auditory cortex has been studied and considered as normal. Neuropsychological assessment indicated that the patients showed typical language representation (left hemisphere). Recordings of brainstem evoked potentials and pure-tone audiograms carried out before SEEG indicated intact cochlear and brainstem auditory functions.
This study did not add any invasive procedure to the depth EEG recordings performed routinely in the neurological evaluation. The patients were informed about the research protocol during SEEG and gave their fully informed consent for participating in this study.
Anatomical definition of depth electrode position
The stereotactic method was based on the co-registration of the patient’s MRI with the stereotactic angiogram. This was performed in order to avoid any injury of brain vessels. Moreover, this method allowed orthogonal introduction of multilead electrodes (0.8 mm diameter, 10 or 15 electrode contacts of 2 mm length each with 1.5 mm spacing between contacts) in the stereotactic space (Szikla et al., 1977; Talairach and Tournoux, 1988). The anatomical position of each contact was
then identified on the basis of (i) an axial scanner image acquired before the removal of electrodes, and (ii) an MRI scan performed after the removal of electrodes (Liégeois-Chauvel et al., 1991).
Anatomical location and responses elicited by pure tones and amplitude modulated tones from these electrodes have been previously reported, and for legibility in describing these electrodes we have attributed the same case number and indicated this in superscript (Liégeois-Chauvel et al., 2004). One of the four patients (Case 3) had three electrodes recording from four different auditory regions giving an exceptional and unique sampling. The first is electrode PC3, whose medial contacts (1-4) recorded activity from the medial part of the right HG (i.e. PAC), whereas the lateral contacts (5-9) recorded activity from PT. The first contacts (1-2) of electrode HC3 (second electrode) were located in the insular gyrus, contacts 3-5 were located in PAC, contact H6 was in the transverse Heschl’s sulcus (HS) and contacts 7-9 were in PT. The third electrode is TC3: contacts 4 and 5 were located in the lateral part of HG, which is in the secondary auditory cortex (SAC), whereas the lateral contacts (6-9) were in BA 22. The three remaining patients had only two electrodes in the auditory cortex. In Case 12, three areas are recorded: the left PAC (H8-H12C12), the left SAC (T12-T15C12) and the left posterior part of Superior temporal gyrus (Post T1 HC12). In Case 1, four contacts of electrode HC1 (H6-H9) were in the right PAC, H10C1 was in the Transverse HS. Eight contacts were located in right postero-lateral part of the superior temporal gyrus (Post T1 HC1 and Post T1 PC1). Case 20 had two electrodes, which explored the left PAC (H10-H15C20 and T10-T15C20).
Stimuli
All stimuli were generated using a 16-bit D/A converter at a sampling frequency of 44.1 kHz. The stimuli were white noises modulated sinusoidally in amplitude at frequencies MF = 4, 8, 16, 32, 64 and 128 Hz, with a 100 % depth modulation. The starting phase of the modulation was fixed at 270° (thus, each stimulus started at an amplitude minimum in the modulation waveform). All AM stimuli were 1 s in duration and were shaped by rising and falling 25-ms cosine ramps/damps. They were
equated in rms (root mean square) and presented binaurally via Sennheiser headphones at 75 dB SPL (rms). Series of 100 mixed stimuli (4/32 Hz, 8/64 Hz, 16/128 Hz,) were delivered to the listener in random order.
Recordings
The recordings of intracerebral AEPs were monopolar, with each contact of a given depth electrode referenced to an extra-dural lead. All signals were amplified and bandpass filtered between 0.15 and 200 Hz (more precisely, a highpass filter (cutoff frequency: 0.15 Hz, rolloff: 12 dB/oct) and a lowpass filter (cutoff frequency: 200 Hz, rolloff: 24 dB/oct) were used to bandpass filter signals). Data acquisition started 164 ms before the presentation of the sound and lasted for 1476 ms. 53 trials were averaged for each sound. During each recording session, the patient lays comfortably in a chair in a sound-attenuated room and listened passively to the sounds.
The averaged signals presented a frequency peak at the modulation frequency in their power spectral density. The oscillations at the modulation frequency were also visible in the temporal shape of the signal in the time window between 200 to 1000 ms post-stimulus onset. Fig. 1 (top) shows typical synchronized AEPs recorded from third lead of electrode HC3 (lead H3 located in the right PAC) in response to a 16 Hz-MF stimulus. Periodic activity characterized by phasic responses close to the onset of each modulation cycle is clearly visible in this AEP preceded by initial evoked response (N1/P2). The power spectral density computed in the 200-1000 ms range is shown on Fig. 1 (bottom).
***Insert Figure 1 about here***
Method
Based on a bivariate autoregressive (AR) model and the Granger causality, the directed coherence (DCOH) has been introduced in (Saito and Harashima, 1981). Compared to the ordinary coherence
defined in (Bendat and Piersol, 1986), the directed coherence provides the direction of propagation between two time series in addition to their degree of linear interaction.
The principle of this method, whose complete description is given in Appendix A (cf. Supplementary Material), is to model two signals X and Y by a bivariate AR model. From this model, two directed coherences DCOHyx(f) and DCOHxy(f), representing the degree of linear
interaction from X to Y and from Y to X respectively, are obtained at any frequency f. In this modeling, different sources are introduced, Wx (respectively Wy) is the source from which signal X
(respectively Y) is generated, and Ws is a common source to X and Y. Sources Wx, Wy, Ws are
gaussian white noises with a null mean and a variance of one. The directed coherences are normalized in the range [0-1] and represent the ratio between the different contributions of sources to one signal.
A simple example is given in equation (1), in which X is autoregressive and Y is computed thanks to
X:
( )
(
)
( )
( )
( )
(
)
( )
( )
0.9 1 10 0.5 1 . x s y s X k X k W k W Y k X k W k W k = ⋅ − + ⋅ + ⎧⎪ ⎨ = ⋅ − + + ⎪⎩ k (1)where k is the current sample.
In this equation, the samples of Y depend on the preceding sample of X, while the samples of X do not depend on the samples of Y. Then X is autogenerated and generates Y. The resulting modules of
DCOHyx(f) and DCOHxy(f) are given in Figure 2, for the frequency f in the range [0-500 Hz], with a
sampling frequency Fs = 1 kHz.
***Insert Figure 2 about here***
In Figure 2, we can see that |DCOHyx(f)| (left) is close to 1, and |DCOHxy(f)| (right) is null, which
shows the influence of X on Y whatever the frequency. This figure confirms the model given in equation (1).
Our aim is to study the propagation between the auditory areas of the oscillatory part of event-related potentials, which oscillates at the modulation frequency of the stimuli. Consequently signals were examined in their quasi-stationary oscillatory part (from 200 to 1000 ms post-stimulus onset) and the DCOH method was applied for each pair of leads at each modulation frequency. We particularly computed, for each modulation frequency MF, the modules of DCOH from Y to X and from X to Y taken at the frequency f = MF, denoted |DCOHxy(MF)| and |DCOHyx(MF)| respectively.
For the study of DCOH in Case 3, who had the largest sampling of electrodes and auditory regions explored, four different stimuli (amplitude modulated white noise at MF = 4, 8, 16 or 32 Hz) were used and the corresponding AR model orders were 140, 100, 70 and 50 respectively. For the three other patients, only stimulus at MF = 8 Hz (AR model order = 100) was used because it corresponded to the most representative modulation transfer function (MTF) across auditory regions as observed in the previous study (Liégeois-Chauvel et al., 2004).
Threshold determination for directed coherence significance
To study the connectivity between auditory cortical areas revealed by AM sound processing, we must distinguish the activity induced by AM stimuli from the background EEG activity by determining a threshold for directed coherence. To determine this threshold, we compare the values obtained on EEG signals with those obtained on responses to stimuli. This preliminary study is carried out at 8 Hz for the leads of PAC of Case 3. In this purpose, we sent 53 stimuli at 8 Hz, which provided us with 53 responses to stimuli (53 trials) and 53 interstimuli signals (background EEG activity without auditory activity) for each recorded lead. We first applied the directed coherence algorithm to the 53 interstimuli signals recorded on each lead of the PAC. A standard
deviation is then computed and a confidence interval derived. Secondly, we applied the directed coherence algorithm to the 53 responses to stimuli using a bootstrap technique: we built an AEP by averaging a set of 53 trials randomly chosen with replacement and we computed the DCOH measure on this AEP. This step is iterated one hundred times and a confidence interval is derived. Results of the propagation expressed by DCOH modules at frequency f = 8 Hz and the 95% confidence intervals of each DCOH measure are reported in Table I for the background EEG activity and in Table II for auditory activity. These tables follow the reading convention of source (column) to target (row). The DCOH obtained on background EEG activity is lower than 0.6 with a low variance. We therefore consider that DCOH measures higher than 0.6 are revealing of flow information for auditory activity.
***Insert Table I about here***
***Insert Table II about here***
Table II shows that 95% confidence intervals of DCOH measures are low, and then DCOH measure is accurate.
RESULTS
Anatomical distribution of AM responses within the different auditory areas
The magnitude of the evoked responses (53 trials) was analyzed as a function of the stimulus modulation frequency (Liégeois-Chauvel et al., 2004). The magnitude values of the spectral components were determined by considering the Fast Fourier Transforms of the responses over 1200 ms. These values are averaged and Fig. 3 shows the amplitude of the spectral peaks at the modulation frequency within main auditory areas (PAC, SAC, BA 22 and Post T1) as a function of AM frequency (4, 8, 16 and 32 Hz) and patients.
***Insert Figure 3 about here***
As reported in the previous study, the distribution of MF varies from one contact to another and predominant response of cortical auditory areas to the low AM frequencies (4-8 Hz) is observed in each region. Best synchronization to 16 Hz could be, however, observed as on the three contacts H13-H15 in the PAC of Case 20. The response to 32 Hz AM is greater within the PAC than in the SAC or BA 22 in Case 3.
Propagation within the primary auditory cortex (PAC)
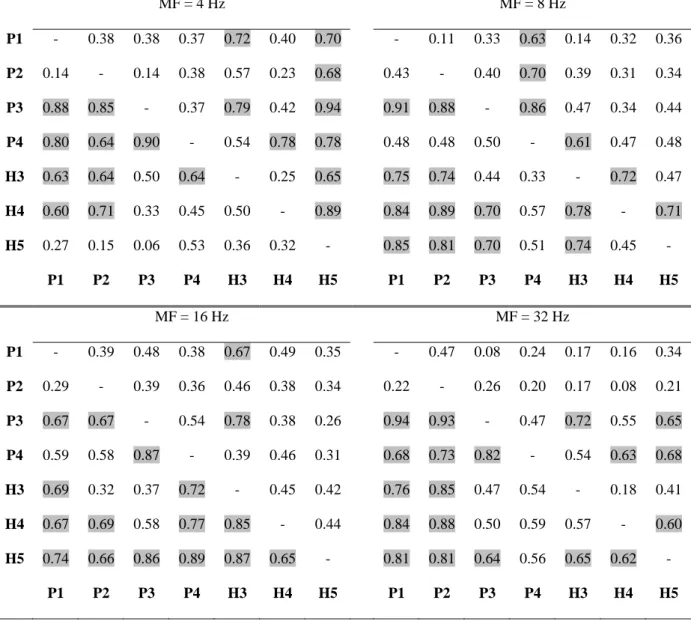
To study the propagation between the different leads located within the PAC, we distinguished the posterior part from the anterior part of PAC in Cases 3 and 20. The corresponding AEPs are taken in the time window between 200 to 1000 ms post-stimulus onset. Results of the propagation expressed by DCOH modules at each frequency f = MF are reported in Table III for Case 3 and in Table A1 for Case 20 at MF = 8 Hz in Supplementary Material. These tables follow the reading convention of source (column) to target (row). In Tables III and A1 the highlighted values correspond to DCOH modules upper than 0.6.
***Insert Table III about here***
In Table III, we observe that the auditory flow tends mainly to propagate serially from the medial leads (lead P1C3) to the most lateral ones (lead P4C3). This direction of propagation is found whatever the AM frequency within the posterior part of PAC (electrode PC3). In the anterior part of PAC (electrode HC3), this unidirectionality seems less clear since it exists for H3C3 whose activity is propagated to H4C3 and H5C3, but less for H4C3. Moreover, some variations are seen according to the AM sound. Interestingly, the oscillatory activity was propagated from the posterior to anterior part of PAC (i.e. from electrode PC3 to HC3) except for 4 Hz.
The values in Tables III and A1 for MF = 8 Hz are reported on Fig. 4a and Fig. 4b for Cases 3 and 20 respectively. The arrow width codes interaction strength (0 ≤ no arrow ≤ 0.6 < increasing width solid lines in step of 0.2). For reasons of clarity in Fig. 4b, only the directed coherences modules superior to 0.8 are represented.
***Insert Figure 4 about here***
Fig. 4a shows that the activity propagates from the posterior part to the anterior part of PAC of Case 3, mainly to H4 and H5. In Fig. 4b dealing with Case 20, the location of the electrode HC20 is in the same region as HC3 and the electrode TC20 is more anterior and lateral than HC20. There is a strong tendency of medio-lateral propagation but which is not strictly serial, for instance auditory stream mainly goes from H10C20 and H1C20 to H14C20 and H15C20 and from T12C20 to T15C20 skipping T13C20 and T14C20. In the anterior-lateral part of PACC20 there is a constant interaction inside this area, predominantly from TC20 to HC20.
Between different anatomical areas
Firstly, we will describe the results obtained from Case 3 because the exceptional sampling of the recording sites within the auditory cortex (see Methods) allowed recording of activity in four different anatomical areas of the right auditory cortex (PAC, SAC, PT, BA 22) and in the insular
gyrus. In the same manner that we distinguished the posterior part (PAC P: P1-4) from the anterior part of PAC (PAC H: H3-5), we separate evoked activity recorded from posterior PT P (P5 to P9) to anterior PT H (H7-9). We studied the functional connectivity between these seven sub-regions.
The directed coherence algorithm was then applied to each couple constituted of AEPs relative to leads located in the different sub-regions. The corresponding AEPs are taken in the time window between 200 to 1000 ms post-stimulus onset. The means of all the DCOH modules over all the frequencies MF = 4, 8, 16 and 32 Hz from the different couplings were summarized in Table A2 (see Supplementary Material) and displayed in Fig. 5 for Case 3.
***Insert Figure 5 about here***
This graph shows the major propagations of the oscillations between the seven auditory sub-regions of Case 3 independently of the AM frequency. The main source of information is the PAC P, which directs auditory information to the PAC H, confirming the posterior-to-anterior influence within the primary auditory cortex, and to the SAC T showing a primary-to-secondary auditory areas connectivity. In the same way, the PAC H is linked to the PT H (medial-to-lateral connection) and to the SAC T. This figure presents examples of strong unidirectional influence of primary auditory areas (PAC P and PAC H) on secondary ones (SAC T and A22 T) and on planum temporale (PT P and PT H). The insular gyrus (Insula H) also seems to send information to other areas (PT H, SAC T and A22 T) and receives information only from PAC P.
For Case 3, the modules of DCOH calculated for 8, 16 and 32 Hz are given in Tables A3, A4 and A5, presented as Supplementary Material. We considered the Heschl’s sulcus (lead H6) as a single area.
Modules of DCOH of Cases 3, 1 and 12 calculated for 8 Hz are summarized on the graphs shown on Fig. 6 a, b, c respectively. Only modules of directed coherences superior to 0.6 are displayed.
***Insert Figure 6 about here***
In Fig. 6a, the main connections are similar to those given in Fig. 5, which correspond to the principal directed connections present between the 8 zones whatever the modulation frequency. But one can readily see that the HS dispatches information to several zones including PAC P, PT P, Insula H, PT H, SAC T and A22 T. The other main source of information is the PAC P which propagates information to the PT P, Insula H, PAC H, PT H, SAC T and A22 T. In general, information flows from posterior to anterior zones and from medial to lateral zones.
In Fig. 6b and Fig. 6c, auditory information propagates from primary and secondary auditory areas (PAC and SAC) to the posterior part of STG (Post T1). As previously observed, HS sends information to PAC but it receives information from Post T1 in Case 12.
Fig. 7a shows the information propagation at MF = 16 Hz in Case 3. As in the previous case, PAC P sends information to PT P, PAC H, PT H, SAC T and A22 T. Mainly, information flows from posterior to anterior zones and from medial to lateral zones. We observe the striking influence of HS, which directs information to the PAC, SAC and BA 22 and even to the Insula.
Interestingly, we notice that the connectivity is frequency dependent as shown in Fig. 7b for 32 Hz. One can readily see that the interaction strengths are very high, particularly from PAC P, Insula H and PAC H to the other zones. Contrary to the two other MFs, the Sulcus H here almost only receives activity from the other zones and a strong connectivity is observed between Insula H and Sulcus H, SAC T and A22 T. More importantly than at other MFs, information flows from posterior to anterior zones and from medial to lateral zones.
***Insert Figure 7 about here***
Fig. 8 summarizes all the results of Case 3 represented in terms of its anatomy. Two main streams emerge, one from the postero-medial part of HG to the anterior part of HG and STG, and another from medial to lateral part of HG. The role of Heschl’s sulcus dispatching auditory stream to the nearby regions is revealed. The connectivity of insula is strongly modulated by the AM frequency and seems maximal for the 32 Hz-MF. Data from the three other patients confirm the medio-lateral stream in HG and show that Post T1 receives information from PAC and SAC, sending in return to PAC via HS.
***Insert Figure 8 about here***
DISCUSSION
Overall, the present data indicate: (i) a medio-lateral propagation within the PAC (ii) a predominant auditory stream from primary to secondary and associative auditory areas, and (iii) a hierarchical and parallel processing between the cortical areas. Finally, the data showed (iv) the special role played by the HS in the dispatching of auditory stream. These results are discussed below.
The human auditory cortex is currently subdivided into several architectonically defined areas. The number of these areas as well as their extent and exact position vary between authors. Using cytoarchitectonic criteria, Brodmann (Brodmann 1909) distinguished three areas, called 41, 42, and 22, and von Economo and Koskinas (von Economo and Koskinas 1925) four areas, as did Braak (Braak 1978). Combining cyto- and myelo-architecture, Galaburda and Sanides (Galaburda and Sanides 1980) identified in the same region eight areas.
Primary auditory cortex
As reported by Rademacher et al. (Rademacher et al. 2001), the precise location and absolute size of PAC cannot be reliably inferred from the macroanatomic landmarks and could comprise between 16 and 92% of the cortical volume of HG according to subjects. Evidence for identification of PAC came from electrophysiological recordings reported in vivo studies (Célesia, 1976; Liégeois-Chauvel et al., 1991). Comparison between cytoarchitectonic studies and our data suggests that areas PAC PC3, PAC HC3,C20 and PAC TC20 would correspond to A1 (Rivier and Clarke, 1997; Clarke and Rivier, 1998) or Te1 (Morosan et al., 2001; Rademacher et al., 2001). The striking result is the co-existence of simplicity and complexity within PAC connectivity. In one hand, we observed a medio-lateral auditory propagation observed along electrodes located in different parts of right and left PAC suggesting a hierarchical processing. On the other hand, the differentiation of physiological regions showed distinct interactions between themselves. Interestingly these areas were not differentiated by AEPs, but by their connectivities. The first two recorded from PC3 and
HC3 showed an unidirectional propagation of auditory stream from right posterior to anterior PAC. This postero-anterior propagation did not seem to continue to occur in the antero-lateral part of PAC, at least in the left hemisphere. We observed that the electrode located in the antero-lateral part (T12-15C20) sent information to HC20, which is located medially and posteriorly to TC20. Although we do not have data on cytoarchitectony, we may be able to derive some information on a putative distinction between the three primary areas from the connectivity patterns. The first one is located in the tip of HG recorded by PC3, the second one is located in the medio-anterior part (HC3 and HC20) and the third one in the antero-lateral of PAC (TC20). This physiological distinction could be related to the subdivisions (Te1.1, Te1.0 and Te2) of PAC reported by Morosan et al. (Morosan et al. 2001) and is close to the organization of auditory core of monkey (Kaas and Hackett, 2000). Our data showed that the auditory propagation could not be associated to an unidirectional traveling wave but to a constant interaction between these areas. That could reflect the large adaptive and plastic capacities of auditory cortex (Engineer et al., 2004; Nelken, 2004). Fritz et al. (Fritz et al. 2003) have recently demonstrated rapid plastic changes in ferret auditory cortex within minutes of the beginning of a tone detection task. Such changes were smaller or absent when the animal was listening passively to same sounds. In human, Schneider et al. (Schneider et al. 2002) demonstrated correlation among the amplitude of N19/P30 primary auditory components, the gray matter volume of PAC and musical aptitude in groups of musicians versus non musicians.
The role of HS
The morphology of AEPs in response to tones in HS was quite different from those recorded from the PAC, the PT or Post T1 that may result in part from differences in thalamic input to these fields. Interestingly, HS dispatches auditory stream to several regions such as Insula, PAC, SAC, PT, BA 22. It receives information from Post T1. Its place between upstream auditory areas (PAC, SAC) and downstream areas (PT, Post T1) (Rivier and Clarke, 1997) leads to speculation regarding its role. Auditory scene analysis needs a continuous processing of sounds that are spectrally and
temporally complex. HS would represent an interface between processing in other auditory cortical regions and could play a modulator role since it sends auditory upstream to PAC only for 8 and 16 Hz.
Role of Insula
Strong connectivity is seen between the posterior part of the insular gyrus (PIC) and SAC, PT and BA 22 especially at highest AM frequency (32 Hz). A functional magnetic resonance imaging (f-MRI) study (Giraud et al., 2000) also investigated the cortical representation of AM using a set of white noises modulated sinusoidally in amplitude at frequencies covering a broad range (4-256 Hz). Consistent with animal studies, this study revealed that, in humans, (i) temporal resolution degrades from the brainstem to the auditory cortex, and (ii) only a few cortical regions were tuned to high AM frequencies, for instance PIC is known to be an eloquent auditory region and seems to be strongly modulated by high AM frequency rather than low AM. Its functional role remains unclear. Firstly, there were discrepancies in the interpretation of functional and anatomical data. As a matter of fact, PAC and PIC had a cytochrome oxidase profile that was compatible with a primary sensory area (Rivier and Clarke, 1997), whereas electrophysiological responses recorded from PIC were clearly different and could not be considered as primary responses (Liégeois-Chauvel et al., 2004). Intracortical electrical stimulations elicited hypoacousia in the contralateral ear or arrest of speech (Ostrowsky et al., 2000) whereas electrical stimulation of PAC elicited auditory hallucinations (De Graaf et al., 2000; Howard et al., 2000).
Hierarchical and Parallel Processing within Human Auditory Areas?
Given that, similarly to the visual system (for review, Felleman and Van Essen, 1991), auditory areas might be organized in a hierarchical system (Rauschecker et al., 1997), we may be able to derive some information on a putative hierarchical order from the DCOH values. An auditory stream from the PAC to the secondary cortex (lateral part of HG and PT) and to BA 22 is observed.
The hierarchical organization within the human auditory cortex proposed by previous studies (Mesulam and Geula, 1994; Hutsler and Gazzaniga, 1996) seemed to be confirmed here. However, our results suggest an organization with a certain degree of parallel processing as observed in a recent study using magnetoencephalography (Inui et al., 2006). These authors found six different cortical areas as a function of latency onset of cortical activity and inferred the existence of a serial model of auditory processing along the medio-lateral axis as well as several parallel streams running from the PAC to the belt region and then the Posterior STG and PT and anteriorly from PAC to BA 22. We also observed a direct propagation from the PAC to BA 22 and to Post T1. The projections from PAC to BA 22 have been shown in neurophysiological studies of the temporal auditory fields in the chimpanzee (Bailey et al., 1943) and rhesus monkey (Ward et al., 1946; Sugar
et al., 1948). Later, electrophysiological (Bignall, 1969) and anatomical (Hackett et al., 1998; Kaas
and Hackett, 1998, 2000) results have confirmed these auditory corticocortical connections in the nonhuman primate. The existence of a projection of HG upon Post T1 has been observed with direct cortical stimulation (Howard et al., 2000; Brugge et al., 2003). While applying electrical stimulation to sites in HG, Howard et al. (Howard et al. 2000) recorded short-latency evoked responses in posterior lateral superior temporal area (PLST) which corresponds to the area that we called Post T1. Moreover, Brugge et al. (Brugge et al. 2003) showed widespread convergence and divergence of input from HG to posterior STG with evidence for a reciprocal functional projection, from posterolateral STG to HG. By our study, we specified that this reciprocal projection was done via HS.
We were unable, however, to ascertain whether these were direct connections between two areas or an indirect one, the latter being consistent with the hierarchical connectivity model of Kaas and Hackett (Kaas and Hackett 1998) based on extensive electrophysiological mapping and neuroanatomic tracer studies in the monkey.
Is directed coherence an accurate tool?
The objective of using directed coherence is to find the propagation direction between two given leads located in auditory cortical areas. The problem may be viewed in terms of delay. Various methods based on linear systems have been proposed. Among non-parametric methods, the most classical corresponds to the maximum of the cross-correlation function. Some variants introducing a weighting window in the frequency domain were derived, such as the maximum likelihood. In the field of parametric methods, besides methods based on the fact that an observation is the sum of one signal derived from another observation and an additive noise, a vectorial autoregressive model was proposed in (Hannan and Thomson, 1981) from which a delay estimation is derived using the cross-power spectral density matrix (Hamon and Hannan, 1974). The first non-linear method, the average amount of mutual information based on mutual entropy, was proposed in (Mars and Van Arragon, 1982). In (Moddemeijer, 1989), the estimation of the probability law is carried out using the histogram method leading to the information theoretical delay estimator. Methods based on higher order moments (Nikias and Raghuveer, 1987) containing phase information are increasingly studied (Emile and Comon, 1995). Parametric approaches have also been proposed in the non-linear field such as the method based on the non-linear regression coefficient (Pijn, 1989).
Contrary to these methods that we have briefly summarised, and other methods of directed coherence such as directed transfer function (DTF) (Kaminski and Blinowska, 1991) or partial directed coherence (PDC) (Baccala and Sameshima, 2001), directed coherence (DCOH) uses a different approach. It takes into account the influence of the rest of the brain on the two investigated signals, in modeling the rest of the brain by a common source influencing these two signals, and thus seems more appropriate to study neuronal connections. This characteristic of the DCOH method, although it does not give the delay, provides the propagation information directly from the relations between samples. The DCOH has already been applied to EEG signals recorded by scalp electrodes in healthy subjects (Jing and Takigawa, 2000) and in epileptic subjects (Takigawa et al.,
1996), or by intracranial electrodes in rats (Wang et al., 2002). Auditory event-related potentials have also been investigated by DCOH (Jing et al., 2001a, 2001b), but to our knowledge this paper is the first to study intracranial auditory event-related potentials.
Conclusion
The aim of the present work was to study the connectivity which exists between human auditory areas using the method of directed coherence (DCOH), applied to depth auditory evoked potentials. DCOH allowed the estimation of causality between two signals recorded from different cortical sites. The results showed: (i) a predominant auditory stream within the primary auditory cortex (PAC) from the most medial region to the most lateral one whatever the MF, (ii) unidirectional functional connection from the primary to secondary auditory cortex, (iii) a major auditory propagation from the posterior areas to the anterior ones, particularly at 8, 16 and 32 Hz, (iv) a particular role of Heschl’s sulcus (HS), dispatching information to the different auditory areas. These findings suggest that cortical processing of auditory information is performed in serial and parallel streams.
REFERENCES
Baccala LA, Sameshima K (2001) Partial directed coherence: a new concept in neural structure determination. Biol Cybern 84: 463-474.
Bailey P, Von Bonin G, Carol HW, McCulloch WS (1943) Functional organization of temporal lobe of monkey and chimpanzee. J Neurophysiol 6: 121-128.
Bancaud J, Talairach J, Bonis A, Schaub C, Szikla G, Morel P, Bordas-Ferrer M (1965) La stéréo-électroencéphalographie dans l'épilepsie: Informations neurophysiopathologiques apportées par l'investigation fonctionnelle stéréotaxique. Paris: Masson.
Bendat JS, Piersol AG (1986) Random Data, Analysis and Measurement Procedures. New York: Wiley and Sons.
Bignall KE (1969) Bilateral temporofrontal projections in the squirrel monkey: origin, distribution and pathways. Brain Res 13 (2): 319-327.
Braak H (1980) Architectonics of the human telencephalic cortex. Berlin: Springer-Verlag.
Brodmann K (1909) Vergleichende localistionslehre der Grosshirnrinde in ihren principien dargestellt auf grund des Zellenbaues. Leipsig: Johann Ambrosius Barth.
Brugge JF, Volkov IO, Garrel PC, Reale RA, Howard MA (2003) Functional connections between auditory cortex on Heschl Gyrus and on the lateral superior temporal gyrus in Humans. J Neurophysiol 90: 3750-3763.
Celesia GG (1976) Organization of auditory cortical areas in man. Brain 99: 403-414.
Clarke S, Rivier F (1998) Compartments within human primary auditory cortex: evidence from cytochrome oxidase and acetylcholinesterase staining. Eur J Neurosci 10: 741-745.
De Graaf JB, Liégeois-Chauvel C, Vignal JP, Chauvel P (2000) Electrical stimulation of the auditory cortex. In: Epileptic seizures - Pathophysiology and clinical semiology (Lüders H, Noachtar S, eds.), pp. 228-236. New York: Churchill Livingston.
von Economo C, Koskinas GN (1925) Die Cytoarchitectonik der Hirnrinde des erwachsenen Menschen. Berlin: Julius Springer.
Eggermont JJ (1994) Neural interaction in cat primary auditory cortex: Effects of sound stimulation. J Neurophysiol 71: 246-270.
Eggermont JJ (1999) Neural correlates of gap detection in three auditory cortical fields in the cat. J Neurophysiol 81: 2570-2581.
Eggermont JJ (2000) Sound induced correlation of neural activity between and within three auditory cortical areas. J Neurophysiol 83: 2708-2722.
Eggermont JJ, Ponton CW (2002) The neurophysiology of auditory perception: from single units to evoked potentials. Audiol Neurootol 7: 71-99.
Ehret G (1997) The auditory cortex. J Comp Physiol A 181: 547-557.
Emile B, Comon P (1995) Estimation de temps de retard entre signaux colorés. XVème Colloque GRETSI, Juan-Les-Pins, France, 285-288.
Engineer ND, Percaccio CR, Pandya PK, Moucha R, Rathbun DL, Kilgard MP (2004) Environmental enrichment improves response strength, threshold, selectivity and latency of auditory cortex neurons. J Neurophysiol 92: 73-82.
Felleman DJ, Van Essen DC (1991) Distributed hierarchical processing in the primate cerebral cortex. Cereb Cortex 1: 1-47.
Fritz J, Shamma S, Elhilali M, Klein D (2003) Rapid task-related plasticity of spectrotemporal receptive fields in primary auditory cortex. Nat Neurosci 6: 1216-1223.
Galaburda A, Sanides F (1980) Cytoarchitectonic organization of the human auditory cortex. J Comp Neurol 190: 597-610.
Galuske RA, Kim DS, Singer W (1999) The role of neurotrophins in developmental cortical plasticity. Restor Neurol Neurosci 15: 115-124.
Giraud AL, Lorenzi C, Ashburner J, Wable J, Johnsrude I, Frackowiak R, Kleinschmidt A (2000) Representation of the temporal envelope of sounds in the human brain. J Neurophysiol 84: 1588-1598.
Hackett TA, Steniewska I, Kaas JH (1998) Subdivisions of auditory cortex and ipsilateral cortical connections of the parabelt auditory cortex in macaque monkey. J Comp Neurol 394: 475-495. Hamon BV, Hannan EJ (1974) Spectral estimation of time delay for dispersive and non dispersive systems. J R Stat Soc Ser C 23: 134-142.
Hannan EJ, Thomson PJ (1981) Delay estimation and the estimation of coherence and phase. IEEE T Acoust Speech 29: 485-489.
Howard MA, Volkov IO, Mirsky R, Garell PC, Noh MD, Granner M, Damasio H, Steinschneider M, Reale RA, Hind JE, Brugge JF (2000) Auditory cortex on the human posterior superior temporal gyrus. J Comp Neurol 416: 79-92.
Hutsler JJ, Gazzaniga MS (1996) Acetylcholinesterase staining in human auditory and language cortices: regional variation of structural features. Cereb Cortex 6: 260-270.
Inui K, Okamoto H, Miki K, Gunji A, Ryusuke K (2006) Serial and parallel processing in the human auditory cortex: a magnetoencephalographic study. Cereb Cortex 16: 18-30.
Jing H, Takigawa M (2000) Observation of EEG coherence after repetitive transcranial magnetic stimulation. Clin Neurophysiol 111: 1620-1631.
Jing H, Takigawa M, Okamura H, Doi W, Fukuzako H (2001a) Comparisons of event-related potentials after repetitive transcranial magnetic stimulation. J Neurol 248: 184-192.
Jing H, Takigawa M, Hamada K, Okamura H, Kawaika Y, Yonezawa T, Fukuzako H (2001b) Effects of high frequency repetitive transcranial magnetic stimulation on P300 event-related potentials. Clin Neurophysiol 112: 304-313.
Kaas JH, Hackett TA (1998) Subdivisions of auditory cortex and levels of processing in primates. Audiol Neurootol 3: 73-85.
Kaas JH, Hackett TA (2000) Subdivisions of auditory cortex and processing streams in primates. P Natl Acad Sci USA 97 (22): 11793-11799.
Kaas JH, Hackett TA, Tramo MJ (1999) Auditory processing in primate cerebral cortex. Curr Opin Neurobiol 9(2): 164-170.
Kaminski MJ, Blinowska KJ (1991) A new method of the description of the information flow in the brain structures. Biol Cybern 65: 203-210.
Kosmal A, Malinowska M, Kowalska DM (1997) Thalamic and amygdaloid connections of the auditory association cortex of the superior temporal gyrus in rhesus monkey (Macaca mulatta). Acta Neurobiol Exp 57: 165-188.
Liegeois-Chauvel C, Lorenzi C, Trebuchon A, Regis J, Chauvel P (2004) Temporal envelope processing in the human left and right auditory cortices. Cereb Cortex 14: 731-740.
Liegeois-Chauvel C, Musolino A, Badier JM, Marquis P, Chauvel P (1994) Evoked potentials recorded from the auditory cortex in man: evaluation and topography of the middle latency components. Electroen Clin Neuro 92: 204-214.
Liegeois-Chauvel C, Musolino A, Chauvel P (1991) Localization of the primary auditory area in man. Brain 114 (Pt 1A): 139-151.
Mars NJ, Van Arragon GW (1982) Time delay estimation in nonlinear-systems using Average Amount of Mutual Information Analysis. Signal Process 4: 139-153.
Mesulam MM, Geula C (1994) Chemoarchitectonics of axonal and perikaryal acetylcholinesterase along information processing systems of the human cerebral cortex. Brain Res Bull 33: 137-153. Moddemeijer R (1989) Delay estimation with application to electroencephalograms in epilepsy. PhD Thesis, University of Twenty, Enschede.
Morel A, Kaas JH (1992) Subdivisions and connections of auditory cortex in owl monkeys. J Comp Neurol 318: 27-63.
Morosan P, Rademacher J, Schleicher A, Amunts K, Schormann T, Zilles K (2001) Human primary auditory cortex: cytoarchitectonic subdivisions and mapping into a spatial reference system. Neuroimage 13: 684-701.
Nelken I (2004) Processing of complex stimuli and natural scenes in the auditory cortex. Curr Opin Neurobiol 14: 474-480.
Nikias CL, Raghuveer MR (1987) Bispectrum estimation: a digital signal processing framework. P IEEE 75: 869-891.
Ostrowsky K, Isnard J, Ryvlin P, Guenot M, Fischer C, Mauguiere F (2000) Functional mapping of the insular cortex: clinical implication in temporal lobe epilepsy. Epilepsia 41: 681-686.
Pijn JP (1989) Quantitative evaluation of EEG signal in epilepsy. PhD Thesis, Amsterdam.
Rademacher J, Morosan P, Schormann T, Schleicher A, Werner C, Freund HJ, Zilles K (2001) Probalistic mapping and volume measurement of human primary auditory cortex. Neuroimage 13: 669–683.
Rauschecker JP, Tian B, Pons T, Mishkin M (1997) Serial and parallel processing in rhesus monkey auditory cortex. J Comp Neurol 382: 89-103.
Rauschecker JP (1998) Parallel processing in the auditory cortex of primates. Audiol neurootol 3: 86-103.
Rivier F, Clarke S (1997) Cytochrome oxidase, acetylcholinesterase, and NADPH-diaphorase staining in human supratemporal and insular cortex: evidence for multiple auditory areas. Neuroimage 6: 288-304.
Ruttgers K, Aschoff A, Friauf E (1990) Commissural connections between the auditory cortices of the rat. Brain Res 509: 71-79.
Saito Y, Harashima H (1981) Tracking of information within multichannel EEG record - causal analysis in EEG. In: Recent Advances in EEG and EMG Data Processing (Yamaguchi N. and Fujisawa K., ed.), pp. 133-146. Amsterdam: Elsevier.
Schneider P, Scherg M, Dosch HG, Specht HJ, Gutschalk A, Rupp A (2002) Morphology of Heschl’s gyrus reflects enhanced activation in the auditory cortex of musicians. Nat Neurosci 5: 688-694.
Schreiner CE, Urbas JV (1986) Representation of amplitude modulation in the auditory cortex of the cat. I. The anterior auditory field (AAF). Hear Res 21: 227-241.
Schreiner CE, Urbas JV (1988) Representation of amplitude modulation in the auditory cortex of
the cat. II. Comparison between cortical fields. Hear Res 32: 49-63.
Sugar O, French JD, Chusid JG (1948) Corticocortical connections of the superior surface of the temporal operculum in the monkey. J Neurophysiol 11: 175-184.
Szikla G, Bouvier G, Hori T, Petrov V (1977) Angiography of the Human Brain Cortex. Atlas of vascular patterns and stereotactic cortical localization. Berlin: Springer-verlag.
Takigawa M, Wang G, Kawasaki H, Fukuzako H (1996) EEG analysis of epilepsy by directed coherence method. A data processing approach. Int J Psychophysiol 21: 65-73.
Talairach J, Bancaud J, Szikla G, Bonis A, Geier S, Vedrenne C (1974) New approach to the neurosurgery of epilepsy. Stereotaxic methodology and therapeutic results. 1. Introduction and history. Neurochirurgie 20: 1-240.
Talairach J, Tournoux P (1988) Co-planar stereotaxic atlas of the human brain. 3-dimensional proportional system: an approach to cerebral imaging. Stuttgart: Georg Thieme Verlag.
Tardif E, Clarke S (2001) Intrinsic connectivity of human auditory areas: a tracing study with DiI. Eur J Neurosci 13: 1045-1050.
Wallace MN, Rutkowski RG, Palmer AR (2002) Interconnections of auditory areas in the guinea pig neocortex. Exp Brain Res 143: 106-119.
Wang HD, Takigawa M, Hamada K, Shiratani T, Takenouchi K (2002) A shift in information flow between prefrontal cortex and the ventral tegmental area in methamphetamine-sensitized rats. Int J Psychophysiol 44: 251-259.
Ward AA, Peden JK, Sugar O (1946) Cortico-cortical connections in the monkey with special reference to area 6. J Neurophysiol 9: 353-462.
TABLES
Table I. P1 - 0.3713 (±0.029) 0.1537 (±0.020) 0.2515 (±0.025) 0.206 (±0.023) 0.1452 (±0.023) 0.1818 (±0.027) P2 0.219 (±0.031) - 0.1501 (±0.020) 0.2162 (±0.024) 0.1667 (±0.020) 0.1409 (±0.023) 0.1637 (±0.027) P3 0.4611 (±0.032) 0.5788 (±0.027) - 0.3971 (±0.029) 0.3839 (±0.032) 0.2339 (±0.029) 0.3247 (±0.033) P4 0.1822 (±0.025) 0.2122 (±0.027) 0.2052 (±0.030) - 0.1418 (±0.021) 0.22 (±0.028) 0.1932 (±0.025) H3 0.1983 (±0.032) 0.2243 (±0.030) 0.1516 (±0.026) 0.1677 (±0.023) - 0.1481 (±0.024) 0.2254 (±0.024) H4 0.3605 (±0.028) 0.3918 (±0.027) 0.1826 (±0.028) 0.2775 (±0.032) 0.4698 (±0.028) - 0.4826 (±0.026) H5 0.256 (±0.026) 0.2567 (±0.029) 0.2294 (±0.029) 0.2054 (±0.028) 0.2124 (±0.027) 0.2537 (±0.029) - P1 P2 P3 P4 H3 H4 H5Table I. DCOH modules at the frequency MF = 8 Hz and the corresponding 95% confidence intervals between all the leads located in the PAC of Case 3 for the background EEG activity.
Table II. P1 - 0.11 (±0.016) 0.33 (±0.016) 0.63 (±0.018) 0.14 (±0.013) 0.32 (±0.012) 0.36 (±0.010) P2 0.43 (±0.011) - 0.4 (±0.018) 0.7 (±0.018) 0.39 (±0.016) 0.31 (±0.014) 0.34 (±0.009) P3 0.91 (±0.006) 0.88 (±0.009) - 0.86 (±0.011) 0.47 (±0.018) 0.34 (±0.015) 0.44 (±0.017) P4 0.48 (±0.016) 0.48 (±0.015) 0.5 (±0.015) - 0.61 (±0.016) 0.47 (±0.016) 0.48 (±0.016) H3 0.75 (±0.009) 0.74 (±0.008) 0.44 (±0.018) 0.33 (±0.013) - 0.72 (±0.008) 0.47 (±0.010) H4 0.84 (±0.007) 0.89 (±0.006) 0.7 (±0.014) 0.57 (±0.015) 0.78 (±0.006) - 0.71 (±0.007) H5 0.85 (±0.007) 0.81 (±0.006) 0.7 (±0.013) 0.51 (±0.015) 0.74 (±0.006) 0.45 (±0.013) - P1 P2 P3 P4 H3 H4 H5
Table II. DCOH modules at the frequency MF = 8 Hz and the corresponding 95% confidence intervals determined by bootstrap between all the leads located in the PAC of Case 3 for the auditory activity.
Table III. MF = 4 Hz MF = 8 Hz P1 - 0.38 0.38 0.37 0.72 0.40 0.70 - 0.11 0.33 0.63 0.14 0.32 0.36 P2 0.14 - 0.14 0.38 0.57 0.23 0.68 0.43 - 0.40 0.70 0.39 0.31 0.34 P3 0.88 0.85 - 0.37 0.79 0.42 0.94 0.91 0.88 - 0.86 0.47 0.34 0.44 P4 0.80 0.64 0.90 - 0.54 0.78 0.78 0.48 0.48 0.50 - 0.61 0.47 0.48 H3 0.63 0.64 0.50 0.64 - 0.25 0.65 0.75 0.74 0.44 0.33 - 0.72 0.47 H4 0.60 0.71 0.33 0.45 0.50 - 0.89 0.84 0.89 0.70 0.57 0.78 - 0.71 H5 0.27 0.15 0.06 0.53 0.36 0.32 - 0.85 0.81 0.70 0.51 0.74 0.45 - P1 P2 P3 P4 H3 H4 H5 P1 P2 P3 P4 H3 H4 H5 MF = 16 Hz MF = 32 Hz P1 - 0.39 0.48 0.38 0.67 0.49 0.35 - 0.47 0.08 0.24 0.17 0.16 0.34 P2 0.29 - 0.39 0.36 0.46 0.38 0.34 0.22 - 0.26 0.20 0.17 0.08 0.21 P3 0.67 0.67 - 0.54 0.78 0.38 0.26 0.94 0.93 - 0.47 0.72 0.55 0.65 P4 0.59 0.58 0.87 - 0.39 0.46 0.31 0.68 0.73 0.82 - 0.54 0.63 0.68 H3 0.69 0.32 0.37 0.72 - 0.45 0.42 0.76 0.85 0.47 0.54 - 0.18 0.41 H4 0.67 0.69 0.58 0.77 0.85 - 0.44 0.84 0.88 0.50 0.59 0.57 - 0.60 H5 0.74 0.66 0.86 0.89 0.87 0.65 - 0.81 0.81 0.64 0.56 0.65 0.62 - P1 P2 P3 P4 H3 H4 H5 P1 P2 P3 P4 H3 H4 H5
Table III. DCOH modules at the frequency f = MF (MF = 4, 8, 16 and 32 Hz) between all the leads located in the PAC of Case 3.
LEGENDS
Figure 1. Above: Shape of the AEP recorded on lead H3 of Case 3 in response to a 16 Hz-MF stimulus. Below: Power spectral density of H3 taken in the range 200-1000 ms post-trigger.
Figure 2. DCOH example
Figure 3. Values of the amplitude spectrum at four modulation frequencies (MF = 4, 8, 16, 32 Hz) for each patient. a) PAC – Case 1, b) SAC – Case 1, c) Post T1 – Case 1, d) PAC – Case 3, e) SAC (HG + PT) – Case 3, f) Area 22 – Case 3, g) PAC + HG – Case 12, h) Post T1 – Case 12, i) PAC – Case 20.
Figure 4a. Graph of propagation between the leads of electrode P and of electrode H located in the PAC, at the frequency MF = 8 Hz for Case 3. The arrow width codes interaction strength (0 ≤ no arrow ≤ 0.6 < increasing width solid lines in step of 0.2). The most medial lead is the first one and the most lateral is the fifth.
Figure 4b. Graph of propagation between the leads of electrode T and of electrode H located in the PAC, at the frequency MF = 8 Hz for Case 20. The arrow width codes interaction strength (0 ≤ no arrow ≤ 0.8 < increasing width solid lines in step of 0.2).
Figure 5. Graph of propagation between 7 auditory sub-regions of Case 3, averaged over all the modulation frequencies MF = 4, 8, 16 and 32 Hz. The arrow width codes interaction strength (0 ≤ no arrow ≤ 0.6 < increasing width solid lines in step of 0.2).
Figure 6a. Graph of propagation between the 8 sub-regions of Case 3 at the frequency MF = 8 Hz. The arrow width codes interaction strength (0 ≤ no arrow ≤ 0.6 < increasing width solid lines in step of 0.2).
Figure 6b. Graph of propagation between the 3 auditory sub-regions of Case 1 at the frequency MF = 8 Hz. The arrow width codes interaction strength (0 ≤ no arrow ≤ 0.6 < increasing width solid lines in step of 0.2).
Figure 6c. Graph of propagation between the 4 auditory sub-regions of Case 12 at the frequency MF = 8 Hz. The arrow width codes interaction strength (0 ≤ no arrow ≤ 0.6 < increasing width solid lines in step of 0.2).
Figure 7a. Graph of propagation between the 8 auditory sub-regions of Case 3 at the frequency MF = 16 Hz. The arrow width codes interaction strength (0 ≤ no arrow ≤ 0.6 < increasing width solid lines in step of 0.2
Figure 7b. Graph of propagation between the 8 auditory sub-regions of Case 3 at the frequency MF = 32 Hz. The arrow width codes interaction strength (0 ≤ no arrow ≤ 0.6 < increasing width solid lines in step of 0.2).
Figure 8. Cortico-cortical connections within the auditory areas of Case 3. Arrows indicate the direction of auditory stream. Localisation of intracerebral electrodes in auditory cortex is superimposed on the patient’s MRI slices. Each dashed line (labeled T, H and P) indicates the anatomical location of a single electrode (each white segment corresponding to a given electrode contact). Each blue, yellow, red, or green line indicates which auditory region is recorded. Note that a single electrode can record cortical activity from different areas.