HAL Id: inserm-00854363
https://www.hal.inserm.fr/inserm-00854363
Submitted on 26 Aug 2013HAL is a multi-disciplinary open access archive for the deposit and dissemination of sci-entific research documents, whether they are pub-lished or not. The documents may come from teaching and research institutions in France or abroad, or from public or private research centers.
L’archive ouverte pluridisciplinaire HAL, est destinée au dépôt et à la diffusion de documents scientifiques de niveau recherche, publiés ou non, émanant des établissements d’enseignement et de recherche français ou étrangers, des laboratoires publics ou privés.
Statistics of acoustically induced bubble-nucleation
events in in vitro blood: a feasibility study.
Jérôme Gateau, Nicolas Taccoen, Mickaël Tanter, Jean-François Aubry
To cite this version:
Jérôme Gateau, Nicolas Taccoen, Mickaël Tanter, Jean-François Aubry. Statistics of acoustically induced bubble-nucleation events in in vitro blood: a feasibility study.. Ultrasound in Medicine & Biology, Elsevier, 2013, 39 (10), pp.1812-25. �10.1016/j.ultrasmedbio.2013.04.011�. �inserm-00854363�
Statistics of acoustically induced
bubble-nucleation events in in vitro blood: a
feasibility study
Jérôme Gateau*, Nicolas Taccoen, Mickaël Tanter and Jean-François Aubry
Institut Langevin, ESPCI ParisTech, CNRS UMR 7587, INSERM U979, Université Denis Diderot, Paris VII, 1 rue Jussieu 75005 Paris, France
* corresponding author : postal address : 1 rue Jussieu 75005 Paris telephone number : +33 (0)6 30 15 27 02 fax number : +33(0)1 80 96 33 55
2 Abstract
Bubbles can form in biological tissues by ultrasonic activation of natural gas nuclei. The damaging aftereffects raise safety concerns. However, the nuclei population is currently unknown and bubble nucleation is stochastic and thus unpredictable. This study investigates the statistical behavior of bubble nucleation experimentally and introduces a model-based analysis to determine nuclei distribution in biological samples. It is tested in two pig blood samples in vitro. Combined ultrafast passive and active cavitation detections with a linear array were used to detect nucleation from pulsed ultrasound excitations at 660 kHz. Single nucleation events were detected for peak rarefaction pressure from -3.6MPa to -24MPa, and the nucleation probability over the range from 0 to 1 was estimated from more than 330 independent acquisitions per sample. Model fitting of the experimental probability revealed that the nuclei distribution is most likely continuous, and nuclei are rare in comparison to blood cells.
Keywords: cavitation, bubble, blood, nucleation probability, ultrasound detection, passive imaging, ultrafast imaging, model-based analysis
3
Introduction
The phenomenon of cavitation in biological tissue has received a considerable interest since Harvey's first studies (Harvey et al 1944a, 1944b, 1945). However, although the biological effects of already formed bubbles are well documented - decompression sickness during diving with compressed gas (Barratt et al 2002), and cell and structure damages during ultrasound exposure (Miller 2007, Church and Miller 2007) - , little is reported about the initiation of cavitation activity in bubble-free tissue1, i.e the nucleation of the first transient or stable microbubbles. There is some evidence that
sub-micrometers gas bodies exist naturally in blood and tissue and behave as bubble nuclei (Blatteau et al 2006). However, the nuclei population is currently unknown, both in terms of local concentration and distribution of activation level. These nuclei could either be transient (Church 2002) or stabilized against dissolution (Atchley and Prosperetti 1989, Fox and Herzfeld 1954, Yount 1997). Recently, Krasovitski et al (2011) have also shown that the intra-membrane space of bilayer cellular membrane could oscillate and expend under ultrasound excitation, and suggested that expended cell membranes could act as cavitation nuclei.
For short ultrasound exposures, the potential formation of microbubbles is mechanically-driven, and results from the subjection of the nuclei to a rarefaction pressure in comparison with the equilibrium state of the medium. Tissue thermal rise induced by ultrasound -that could contribute to nuclei activation- is negligible for short excitations. Different theoretical analysis of ultrasonic excitation parameters (frequency, pulse length and amplitude) that influence the on-set of cavitation assuming pre-existing nuclei have been proposed for sinusoidal (Holland and Apfel 1989, Apfel and Holland 1991, Church 2005) and shockwave (Church 1989, 2002) excitations. These theoretical analyses consider independently single nuclei of different initial sizes in a modeled fluid, and define the initiation of cavitation activity with criteria such as the ratio between the maximum size of the bubble during the expansion phase of a nucleus and the initial size of the nucleus, or the interior temperature
1
The initiation of cavitation activity refers in this paper to the spontaneous nucleation of bubbles in response to a change of pressure in a medium not seeded with artificial nuclei such as ultrasound contrast agents.
4
of the bubble during the subsequent collapse phase. The on-set of cavitation corresponds then to the criterion value exceeding an arbitrary threshold (Leigthon 1997). Such criteria are unfortunately not accessible experimentally in blood and biological tissue, and the lack of experimental data on the statistical distribution of nuclei sizes limits the impact of theoretical studies on the prediction of the initiation of cavitation activity in biological media. Nevertheless, theoretical models describe qualitatively the behavior of gas bodies exposed to short ultrasound excitations, and are of interest to understand the process of bubble nucleation. Thus, if the pressure change induced by the exciting acoustic wave can be considered as quasi-static with respect to the timescale of a nucleus (determined by its high resonance frequency), which is the case for sub-micrometers gas bodies and excitation in the megahertz range, the nucleus is expected to experience an explosive growth that can lead to the formation of a micrometric bubble, only if the rarefaction pressure exceeds a threshold (Leigthon 1997). As a consequence, a nucleus in the excited region will theoretically be activated only if the rarefaction pressure locally exceeds this nucleus threshold, as described by Blake (Blake 1949, Neppiras and Noltingk 1951) and others (Atchley 1989, Holland and Apfel 1989). Experimental studies (Sommer and Pounds 1982, Williams et al 1989, Hynynen 1991, Ivey et al. 1995, Deng et al 1996a) reported a single value for the nucleation threshold in a biological medium, corresponding to the weakest peak rarefaction pressure or acoustic intensity for which cavitation activity was detected. In the case of an a priori complex population of nuclei, these disclosed values could either refer to the lowest nucleus threshold, or to a rarefaction pressure value leading to an arbitrary significant nucleation probability. For cavitation studies in the medical ultrasound community, the nucleation threshold is therefore often arbitrary estimated and defined by the experimentalist. Moreover, different methods were used to detect the on-set of cavitation (Barnett 1998) and could lead to different threshold depending on their sensitivity (Crum et al. 1992). Among the cavitation detection techniques, acoustic ones are the most suited ones for blood and biological tissues (Barnett 1998). These acoustic methods can be broadly divided between passive cavitation detection (PCD) and active cavitation detection (ACD). PCD techniques use the acoustic emissions occurring during the nuclei activation or the subsequent excitation of the generated bubbles, and are mostly based on analyses of the emission spectrum. Second or higher harmonic, sub-harmonic and broadband emissions were
5
probed and their intensity used as criteria. PCD techniques were shown to be useful for the detection of cavitation activity in particular during long sonications (Jensen et al. 2011, McLaughlan et al 2010). ACD techniques use the increase of scattering cross-section and efficiency in a pulse echo configuration, but their sensitivity can be strongly affected by a lack of contrast between the induced bubble and intrinsic scatterers in media such as blood and biological tissue.
To overcome the sensitivity issues of standard PCD and ACD, a novel all-ultrasound ultrafast multi-element nucleation detection technique sensitive to single nucleation events in scattering tissues was recently proposed by our group for short ultrasonic excitations (Gateau et al 2011a). The technique uses a focused single-element transducer driven by a high power electric burst of two cycles to induce bubble nucleation. Detection is performed with a linear array mounted on the side of the single-element transducer to probe its focal spot. A combined ultra-fast passive and active detection is performed with the multi-element ultrasound probe to optimize the sensitivity and specificity of the technique. This combined detection was shown to lead to coherent passive and active cavitation detection images.
The method was first validated in vitro and ex vivo (Gateau et al 2011a) and was then successfully used to study bubble nucleation in vivo in sheep brain tissue (Gateau et al 2011b). In that in vivo study, a statistical analysis on the occurrence of the nucleation events as a function of the peak rarefaction pressure of the excitation was performed over a large range of rarefaction pressure (more than 10MPa) using the developed method. On a macroscopic scale, nucleation in brain tissues was found to be a random phenomenon whose probability increases slowly (over a range of 10MPa) with the decreasing peak negative pressure. The slow increase of the nucleation probability indicated that, on the microscopic scale, the nuclei distribution is not restricted to only one size of nucleus with a high concentration. Unfortunately, no better assessment of the nuclei spectrum could be achieved.
In this paper, to further investigate the on-set of cavitation in biological tissue, statistical models are presented in order to estimate the nuclei distribution. Such models could not be tested with previously acquired data on sheep brain: nucleation probability was not well-enough resolved due to the fair but limited number of independent acquisitions (120 independent locations on 8 sheep brains) that could
6
have been done during that first in vivo study. This limited number of acquisitions was partly due to the fact that a tissue region already insonified once could not be used for a second independent acquisition, as sonication in soft-solid tissue may influence the local nuclei distribution. Freshly harvested blood samples were chosen here to test the statistical models, for three main reasons. First, because it circulates through the entire body and perfuses all the organs. Second, blood is a scattering liquid tissue. Therefore, its acoustic scattering properties are comparable to other biological tissues but, as opposed to soft-solid tissues, blood is homogenous at a mesoscopic scale and can be rehomogenized by gentle mechanical mixing for example. This rehomogenization enables formed bubbles to move away and depleted nuclei to be renewed. As a consequence, a much larger number of independent acquisitions can be performed on the same sample. Finally, as most theoretical studies assume a fluid medium in which nuclei are most likely spherical, a liquid tissue facilitated the development of models for the analysis of the statistical behavior.
We report in this paper in vitro experiments carried out on two pig blood samples. Three different distributions of nuclei activation level were introduced and tested on the estimated nucleation probabilities.
Materials and methods
Sample preparation
Freshly drawn whole pig blood was used for this study. Heparin (2mg/kg) was injected intravenously to the animal before harvesting to prevent blood from coagulation. Blood was then collected in a 450mL blood bag (Teruflex CPDA-1, Terumo penpol limited, India) for each of the two animals included in the study. These bags contain 63mL of a citrate-phosphate-dextrose-adenine (CPDA-1) solution to improve the conservation of red blood cells over several weeks. Experiments were carried out over one week after harvesting, and the blood was kept refrigerated at 5°C in between the experiments. All protocols involved in the blood acquisition were approved by the ethical committee of the IMM Research Group (Institut Mutualiste Montsouris, Paris, France).
7
To avoid acoustic mismatch between the samples and the ultrasound probe, for each animal, a 100mL sample was taken from the bag and placed in a non-lubricated latex condom (thickness 65µm). The condom was sealed so that no air was trapped inside. Since the condom walls were under weak tension, the static pressure in the blood sample was considered equal to the atmospheric pressure. All the acquisitions were performed on these samples.
Experimental set-up
The experimental set-up is presented in
Figure 1. The confocal ultrasound system and the driving electronics were already described in detail elsewhere (Gateau et al. 2011a, 2011b). Therefore, only the main features are presented here. A single-element piezo-composite focused transducer (Imasonic, Vorey sur l’Ognon, France) was used to induce bubble nucleation. It had a center frequency of 660 kHz, a focal distance of 45 mm, and an f -number of 1. It was driven by a function generator (AFG 3101, Tektronix, Beaverton, OR) with a 5 kW RF power amplifier which gain could be adjusted (GA-2500A, RITEC Inc.,Warwick, RI). The detection of nucleation events was performed with a linear array (L7-4, 4.0/7.0 MHz Linear Array Vascular, Philips Medical Systems, Seattle, WA). It was driven by an ultrafast ultrasound scanner prototype (V1, SuperSonic Imagine, Aix en Provence, France) programmable per channel both in receiving (64 channels) and in transmitting (128 channels) modes. This prototype allowed very high frame rate acquisitions (up to 20,000 frames/s) by the receiving aperture. The two transducers were
8
confocally aligned
(
Figure 1).
The confocal system was immersed in a degassed water tank. The sample, hanging from the top, was positioned so that the focal spot of the focused single-element transducer corresponds to the middle of the condom.
Calibration for the single element transducer
The activation of gas nuclei was induced by the transient rarefaction pressure generated in the medium after the excitation of the single-element focused transducer. Although the region of lower rarefaction pressure is concentrated on a focal spot, the calibration performed here consisted on measuring the peak rarefaction pressure (i.e. at focus) for different gains of the amplifier. The transducer was calibrated in degassed water. As for all the experiments carried out in this study, the transducer was driven by two-cycle bursts (at 660 kHz). The pressure waveforms at focus are presented in Figure 2. They were derived from the ultrasonic displacement measured using a Laser heterodyne interferometric method already described and discussed in detail elsewhere (Gateau et al. 2011b).
At high amplitude excitations, the wave propagation was nonlinear, and due to the limited bandwidth of the calibration system, it was impossible to unwrap the phase of the interferometric signal without avoiding 360° jumps and the positive peak value could then not be recorded precisely.
9
The output of the calibration system for the positive peaks resulted in a discontinuity of the curve and non-physical negative values (Figure 2). Nevertheless, the rarefaction phase was well resolved and the value of the negative peak pressure recorded. Discrete amplitudes of excitation were used in this study, based on the control panel of the RITEC amplifier. This led to peak negative pressures ranging from -2.5MPa to -24MPa.
Nucleation detection sequence
The nucleation detection sequence comprised a series of successive high amplitude excitations of the targeted region and subsequent detection of the potentially induced bubble nucleation events. A combined passive detection and ultrafast active plane-wave-imaging sequence described by Gateau et al. (2011a) was used. For each high amplitude excitation, the passive recording occurs while the high amplitude excitation propagates into the medium. It aims at detecting the acoustic emissions induced by bubble nucleation events. The ultrafast active detection takes place 440 microseconds later, once the reverberations of the high amplitude pulse vanished. The induced bubbles then act as strong scatterers, and their echoes are recorded. Ultrafast active images here were composed of two compound plane-wave acquisitions with opposite tilts to increase the contrast and lateral resolution (Montaldo et al. 2009). A series of 80 plane-wave acquisitions with alternating tilts was performed at pulse repetition frequency of 8.8 kHz after each high amplitude excitations. For each plane-wave acquisition, the elements of the array were driven with a single impulse signal of 83 ns (Mechanical index: 0.67), and the pulse-echo signals were recorded. In addition to the active detection after each high amplitude excitation, one ultrafast image was recorded just before the first excitation; it comprised the echoes of the unnucleated medium and served as a reference. The pulse echo signals of this image were subtracted coherently to obtain so-called active change detection (AChD) images.
The high amplitude excitations of the focused transducer and the subsequent passive and active detections were repeated twelve times per nucleation detection sequence in order to provide several attempts to detect the nucleation events and induced bubbles. The amplitude of the excitations was fixed for each acquisition and the pulse repetition frequency (PRF) was set to 101Hz. Before each
10
nucleation detection sequential acquisition, a gentle mechanical mixing was performed manually. This mixing enables formed bubbles to move away and depleted nuclei to be renewed in the targeted area.
Assessment of the nucleation probability
The probability of bubble nucleation is evaluated as a function of the peak negative pressure at the focus. For a given amplitude of the excitation, each nucleation detection sequential acquisition was statistically considered as the outcome of a Bernoulli trial. The value ‘1’ (success) was attributed to the acquisition if at least one nucleation event was detected in the vicinity of the focal point of the single-element transducer (i.e. more than 5mm away from the condom walls). Otherwise, the acquisition got the value ‘0’ (failure). An estimator of the probability for a given peak negative pressure is then the number of successful acquisitions over the total number of acquisitions with the same excitation amplitude. The 95% confidence interval is assessed for this estimator. Given the small number of outcomes (<1000), a method based on a non-asymptotic binomial law is used (Harte 2002).
Models for analysis of the nucleation probability
To analyze the probability distribution of the nucleation events, and attempt to estimate the nuclei spectrum - i.e the statistical distribution of nuclei activation level- in the samples, the nucleation probability assessed experimentally was fitted with different models. Three models were tested. Each corresponds to a different nuclei spectrum. First, discreet nuclei spectra with one type of nucleus, and two types of nuclei were considered. The term type of nuclei refers here to nuclei which have the same nucleation threshold. A continuous nuclei spectrum was then tested. The derivation of the nucleation probability from these nuclei spectra is presented in this section.
Nucleation probability models
For the ultrasonic high amplitude excitations used in this study, the pressure change induced by the acoustic wave can be considered as quasi-static with respect to the timescale of the nuclei (determined by their high resonance frequency). As a consequence, a nucleus in the targeted region will be activated only if the rarefaction pressure locally exceeds this nucleus threshold, as described by Blake
11
(Neppiras and Noltingk 1951) and others (Atchley 1989, Holland and Apfel 1989). Before being activated, the nucleus could either be transient (Church 2002) or stabilized against dissolution (Atchley and Prosperetti 1989, Fox and Herzfeld 1954). Its activation is then characterized by a loss of mechanical stability and an explosive growth. Although the generation of the detected microbubble can imply more complex bubble dynamics, Blake's threshold is valid for predicting the onset of the explosive growth of the nucleus (Leighton 1997). The value of the rarefaction pressure threshold (Pnuc) is less then -Pstat , Pstat being the static pressure in the sample.
Discrete nuclei distribution
The simplest nuclei distributions are discrete, and correspond to nuclei populations with limited dominant types. For one type of nucleus whose activation rarefaction pressure (nucleation threshold) is: Pnuc,i, and whose concentration is ndiscrete,i, the probability that none of the Ninuclei of this type
present in the sample will be activated is:
Ni sample rar i nuc peak rar rar i discreteV
P
P
P
V
P
, , ,min min , ,(
)
1
(eq. 1)with Prar,min the minimum peak rarefaction pressure of the entire volume, V
Prar,peak Pnuc,i Prar,min
the volume in which the local peak rarefaction pressure is below the nucleation threshold Pnuc,i provided the miminum peak rarefaction pressure in space Prar,min., Vsample the total volume of the blood
sample and Ni ndiscrete,i.Vsample.
The probability of this event corresponds to the probability that none of the Ni nuclei of the sample
whose nucleation threshold is Pnuc,i will be within the volume where they can be activated, assuming that nuclei are free to move about in the liquid medium, and that every location is equally probable.
For a liquid sample containing k different types of nuclei, the nucleation probability for each type being independent, the nucleation probability in the medium is given by:
12
)
(
1
)
(
, ,min 1 min , discrete i rar k i rar discreteP
P
(eq. 2)Model 1: one type of nucleus
If the nuclei population comprised only type of nucleus, that is to say if all the nuclei in the sample have the same nucleation threshold Pnuc,0 then :
)
(
1
)
(
,min ,0 ,min 1mod
P
rar
discreteP
rar
(eq. 3)Model 2: two types of nuclei
If the nuclei population is composed of only two types of nuclei whose nucleation thresholds are respectively Pnuc,1 and Pnuc,2 , the nucleation probability is then given by:
)
(
).
(
1
)
(
,min ,1 ,min ,2 ,min2
mod
P
rar
discreteP
rar
discreteP
rar
(eq. 4)Continuous nuclei distribution
For a continuous distribution of nuclei, the concentration of nuclei with a threshold between Pnuc and
Pnuc + dPnuc (with dPnuc the differential of Pnuc) is: nuc nuc continuous dP dP dn
. The probability that none of
these nuclei will be in the differential volume element d3r located around the point
r of the sample is:
. . . 3 1 ) , ( sample nuc nuc continuous V dP dP dn sample nuc continuous V r d r P (eq. 5)
Considering the entire nuclei distribution, the probability that no nucleus will be activated in the differential volume element d3r located around the point
r of the sample is:
)
,
(
)
,
(
) ( min , min , ,r
P
r
P
continuous nuc P P r P P rar continuous stat rar peak rar nuc
(eq. 6)13
with Prar,peak (rPrar,min )the peak rarefaction pressure at the point r provided the minimum peak
rarefaction pressure in the blood sample Prar,min, and assuming that this peak rarefaction pressure is inferior to -Pstat. If the peak rarefaction pressure at the point r
is weaker or equal to -Pstat: 1 ) , (Prar,min r continuous If the function 0 . . 3 1 ) , ( P V dP dn sample nuc continuous sample nuc continuous V r d r P
is positive and Riemann integrable
on
Prar,peak (rPrar,min ),Pstat
with P0 = 1 Pa, a constant pressure used to obtain dimensionlessmathematic expressions, the product integral can be transformed as (Bashirov et al 2008):
stat rar peak rar nuc stat rar peak rar nuc P P r P P nuc nuc continuous nuc continuous P P r P P P dP r P r P ) ( 0 ) ( min , , min , , )). , ( ln( exp ) , ( Then (eq. 7)
stat rar peak rar nuc stat rar peak rar nuc P P r P P nuc nuc continuous Sample sample nuc continuous P P r P P dP dP dn V r d V r P ) ( 3 ) ( min , , min , , ). 1 ln( . exp ) , ( (eq. 8) Since d3r<<Vsample, (eq. 8) can be written :
stat rar peak rar nuc stat rar peak rar nuc P P r P P nuc nuc continuous nuc continuous P P r P P dP dP dn r d r P ) ( 3 ) ( min , , min , , . exp ) , ( (eq. 9)Considering the entire volume of the sample, the nucleation probability in the medium is given by:
sample V r rar continuous rar continuous P P r ) , ( 1 ) ( ,min
,min
(eq. 10) It follows that:14 ) . exp( 1 ) ( min , , min , , 3 ) ( min ,
rar stat peak rar stat rar peak rar nuc P P P V r P P r P P nuc nuc continuous rar continuous dP d r dP dn P (eq. 11) with V
Prar,peak Pstat Prar,min
the volume of the sample for which the peak rarefaction pressure isbelow –Pstat.
We found here again the equation given by Herbert et al. (2006).
Model 3: Exponential size distribution
Using filters with different pore diameters and a static pressure excitation, Yount et al. (1979) measured a continuous nuclei spectrum in gelatin. Nuclei were assumed to be spherical, and the experimental data were shown to correspond to the following exponential size distribution:
) / exp( . ) (R Rmin n1 Rmin R1
ncontinuous nuc (eq. 12)
where Rnuc is the equilibrium radius of a nucleus, Rmin is the minimum equilibrium radius considered,
and n1 and R1 are two positive medium dependant variables.
According to Yount, this exponential size distribution is a persistent feature of nuclei populations in aqueous media (Yount 1997), and corresponds to an equilibrium state. The distribution is therefore dynamically maintained (Yount 1982). As blood is a liquid tissue, it is also reasonable to assume spherical nuclei here. Consequently, this continuous nuclei distribution could be well-suited to model the nuclei population in the blood samples.
The distribution is however given in terms of nuclei size and not in terms of nucleation rarefaction pressure threshold. To develop the corresponding model, the radius was then converted into rarefaction pressure by using the Blake threshold's formula (Blake 1949, Neppiras and Noltingk 1951). The equilibrium radii of the nuclei were assumed to be small enough so that the surface tension is dominant over the viscous and inertial effects, and the vapor pressure was neglected in comparison with the static pressure. Under these assumptions, Blake's nucleation threshold can be expressed as (Leighton 1997):
15 nuc stat nuc R P P 0.77 (eq. 13)
with γ the surface tension and Pnuc < -Pstat.
Consequently (eq. 12) and (eq. 13) can be combined:
stat nuc P P nuc nuc stat nuc nuc nuc dP dP dn P P P n P P n max , . )) /( exp( . ) ( 3 mod max , 1 1 max , (eq. 14)with Pnuc,max the lowest nucleation threshold considered, and P1 a negative variable which depends
on the medium.
The nuclei spectrum can be derived from (eq. 14) :
stat nuc stat nuc stat nuc nuc continuous P P if P P P P P P n dP dn 0 )) /( exp( . ) ( . 1 2 1 1 3 mod (eq. 15)
This nuclei spectrum is continuous and has a maximum for nuc Pstat
P
P
2
1
The corresponding nucleation probability is:
, ,min 3 min , , min , 3 mod ( ) 1 exp ( ( )). rar stat peak rar P P P V r rar peak rar nuc rar n P P r P d r P (eq. 16)
stat rar PP nuc rar peak rar
rar n P P dP V P P P dP P P min , min , , min , 3 mod ( ) 1 exp ( ( )). ( ) (eq. 17) with
min , ,peak ( ) rar rar P dP P P PV being the volume in which the rarefaction pressure is below
the threshold P+dP and above the threshold P.
P Prar,peak (P dP)Prar,min
V Prar,peak P dP Prar,min
V Prar,peak PPrar,min
16
Volume computation
To model the actual nucleation probability, the volume Vsample was taken equal to 100mL and
Prar,peak Pnuc Prar,min
V was computed. To simplify the calculation, it is assumed that the exciting
pressure field corresponds to the one obtained for the center frequency of the focused single-element transducer, and with a linear propagation of the acoustic wave. The peak rarefaction frequency was taken at the focal point of the focused transducer, and the rarefaction pressure isosurfaces were assumed to be prolate spheroids with a main axis corresponding to the transducer axis.
If Pnuc < Prar,min, it follows that V
Prar,peak Pnuc Prar,min
0. Otherwise, the volume
Prar,peak Pnuc Prar,min
V is enclosed in a prolate spheroid whose polar radius L is given by the half
depth-of-focus at Prar , and whose equatorial radius l is given by the radius of the Airy spot at Prar. . Since the f-number of the focused transducer used in this study is equal to 1, it follows that (Angelsen 2000): 1 . 4 . y L
with
min , 1 1 2 . ) 2 . sin( rar nuc P P y y and 0 < y
1≤ 2
(eq. 19)where λ is the center wavelength of the signal emitted by the transducer. For a center frequency fc=660kHz, and a speed of sound c=1500m.s-1, λ ≈ 2.27 mm.
2 . y l with min , 2 2 1 . ) . ( 2 rar nuc P P y y J and 0 < y2≤ 1.22 (eq. 20)
with J1 the Bessel function of the first kind.
The volume V
Prar,peak Pnuc Prar,min
is then given by:
P P P
l LV rar peak nuc rar . .
3
4 2
min ,
17
Numerical implementation
For each Prar,min , y1 and y2 were computed with a precision of 10-5 for ratios
min , rar nuc P P varying from min , rar stat P P
to 1 by 10-5 steps. The corresponding volumes were then derived. For the continuous model,
the integral summation of (eq. 17) was transformed in a discreet summation. The experimental nucleation probability was fitted to the three different models using a least mean square minimization algorithm. The unknown variables of the model were then determined.
Results
Detection of nucleation events
Two typical examples of nucleation detection in the second blood sample are presented in this section, and referred as case #1 and case #2. These examples correspond to the first excitation of two different acquisitions. The peak negative pressure (at the focal point) was equal to -6.4 MPa (evaluated in water) for both of the acquisitions. In case #1 a single cavitating region was induced during the first excitation, whereas in case #2 no nucleation events could be detected. They are thus representative of each probability state involved in the statistical study. The passive and active detection data recorded for the two examples are analyzed in greater detail.
The radio-frequency (RF) signals recorded on one element of the linear array during passive detection are presented in Figure 3(a). The RF signals of the two examples superimpose perfectly for the time interval [0 16µs]. Two strong high frequency pulse shape signals can then be detected 16µs after the beginning of the passive recording for case #1 only. The magnitudes of the Fourier transforms of the RF signals are presented in Figure 3 (b). For case #2, the main spectral component was the fundamental frequency of the excitation (660 kHz). The case #1 spectrum analysis reveals in addition a broadband component (above 2.5 MHz) and a second harmonic component (around 1.3
18
MHz). This spectrum was shown to be a characteristic of the occurrence of a nucleation event with the acoustic excitation parameters used here (Gateau 2011a).
High-pass filtered passive data were beamformed to localize the cavitating region. The case #2 passive image has a low amplitude and contains no recognizable structure. The case #1 passive image is shown in Figure 3(c). Two spots can be distinguished close to the focal point of the focused transducer. They correspond to the two strong pulsed signals visible in the RF signals (Figure 3(a)). Using the passive signals recorded on all the elements of the array, the two pulsed signals were verified to have the same wavefront curvatures. This means that both pulses originated for the same location. The time delay between the two pulses was associated with the time of collapse of a bubble (Gateau et al. 2011a). Consequently, even if two spots appear on the passive image, they actually correspond here to the same nucleation event. The two spots have the same x-coordinate and the upper one (z = 51mm) is the closest to the actual position of the event (Gateau et al. 2011a).
The passive images were compared to the first subsequent image issued from the active detection for the same exposure (Figure 3 (d)). The case #1 active change detection (AChD) image (Figure 3 (e)) shows that a scatterer appeared in the medium since the beginning of the nucleation sequence. This appearance is not detectable on the active image without subtraction (Figure 3 (d)), which justifies the use of AChD images. Red blood cells are scattering in the frequency range of the active detection. The induced scatterer corresponds to the nucleated cavitating region. This is confirmed by the fact that the location of the scatterer on the AChD image (Figure 3 (e)) corresponds to the position of the event on the passive image (Figure 3 (c)). Only random noise appears on the case #2 AChD images.
As already highlighted in previous papers (Gateau et al. 2011a, 2011b), all the results displayed in this section enable determination of the occurrence of nucleation for each acquisition.
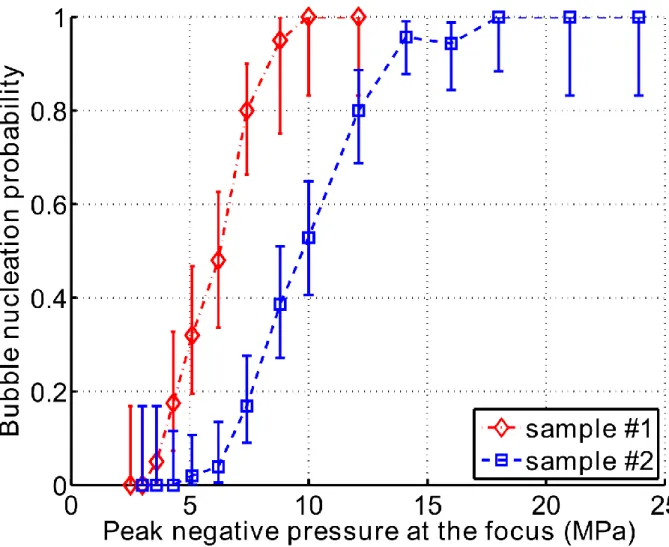
Nucleation probability
The estimations of the nucleation probability in the two blood samples are presented in Figure 4. A total of 330 independent acquisitions were performed for sample #1 and 644 acquisitions for sample #2. The range of nucleation probabilities from 0 to 1 was fully covered. The estimation of the
19
probability was calculated and the cumulative probability determined after each experimental session, and the results were found to be consistent over the 7 days period after harvesting the blood.
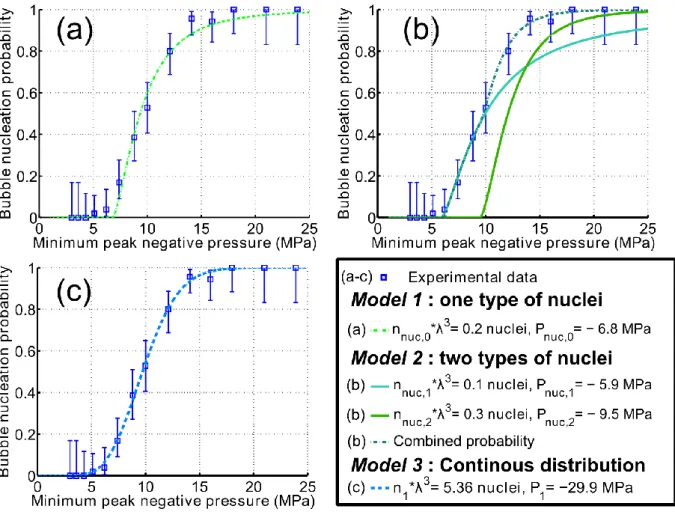
Model fitting
For sake of clarity, the results concerning the blood sample #2 are analyzed in details, and the salient results concerning the two samples are provided in table 1 at the end of the results section. The best fit of the experimental data in the least-squares sense is presented in Figure 5, for each of the three models. For the first discrete model -that assumes a nuclei population of only one type of nucleus-, the best fit was found for a nuclei concentration nnuc,0 ≈ 17.4 nuclei.mL-1, and a rarefaction pressure
threshold of Pnuc,0 = -6.8MPa (Figure 5 (a)). Using Blake's threshold formula given in (eq. 13), and the
surface tension between the whole pig blood and the air (Raymond et al. 1996) (γ ≈ 56 10-3 N.m-1), the
radius of the corresponding spherical nuclei could be estimated: Rnuc,0 ≈ 6 nm. However, Model 1 fails
to fit the experimental points for the peak rarefaction pressures above P0. Indeed, the probability of
Model 1 is equal to zero above Pnuc,0, but nucleation events were detected even with a peak rarefaction
pressure of -5.1MPa.
For the second discrete model, the experimental data were best fitted with a nuclei population comprising a concentration nnuc,1 ≈ 8.5 nuclei.mL-1 of nuclei which rarefaction threshold is
Pnuc,1= -5.9MPa, and a concentration nnuc,2 ≈ 25.6 nuclei.mL-1 of nuclei which rarefaction threshold is
Pnuc,2= -9.7MPa. These two thresholds correspond respectively to the estimated radius of nuclei:
Rnuc,1≈ 7 nm and Rnuc,2≈ 5 nm. In addition to the nucleation probability of Model 2, the nucleation
probability of each nuclei type as if it was alone in the sample (i.e. population of model 1) is plotted Figure 5(b). Fitting errors are lower with Model 2 than Model 1, nevertheless the probability of Model 2 equals zero above Pnuc,1 while nucleation events were detected with a peak rarefaction pressure of
-5.1MPa.
The best fit for the continuous model is presented in Figure 5(c). The corresponding total concentration of nuclei regardless of their rarefaction pressure threshold is equal to: n1= 457
nuclei.mL-1. This concentration corresponds to the limit when P
20
The nuclei spectrum associated with the fitting parameters (cf (eq. 15) ) is shown in Figure 6 for the rarefaction pressures between -Pstat= - 0.1 MPa and -25MPa. The corresponding total concentration of
nuclei (with a nucleation threshold above -25MPa) is 137 nuclei.mL-1. The spectrum has a maximum
for Prar,peak ≈ -15MPa. The sums of the squared residuals are comparable for Model 3 and Model 2, but
the nucleation probability for a peak rarefaction pressure of -5.1MPa was found different from zero with Model 3.
A summary of the results obtained for the two blood samples is given in Table 1.
Discussion
The use of a novel ultrasonic method, able to detect single nucleation events in scattering tissues, enabled us to perform a statistical study of the occurrence of bubble nucleation in whole pig blood in
vitro. The detection method, first applied in soft tissues (Gateau et al 2011a, 2011b), was shown here
to improve detection of bubble nucleation events in scattering liquid tissues as well thanks to the use of high frame-rate images. This study confirms that acoustic bubble nucleation in the blood samples under study was a random phenomenon. The nucleation probability could be measured over a 10MPa range of minimum peak rarefaction pressure and the probability range from 0 to 1 could be fully covered. This result represents a first improvement in the assessment of cavitation properties of blood samples in comparison to the disclosure of a single value of cavitation threshold as given by Deng et al (1996a) in their in vitro study of cavitation in human blood. Moreover, no particles acting as extra potential nuclei were needed to be added to the sample to enable the detection of nucleation events, contrary to Deng et al (1996a)'s study.
When decreasing the peak negative pressure of the high amplitude excitation, there was no sharp transition in the nucleation probability from 0 to 1, but rather a slow increase in the probability over a 10MPa range was found (Figure 4).This probability distribution indicates that the nuclei population in blood does not comprise one type of nucleus only with a high concentration. Thanks to the use of a liquid tissue, a much larger number of independent acquisitions could be performed on a single sample than on a soft-solid tissue like brain (Gateau 2011b). Thus, the nucleation probability could be
21
resolved well enough to allow further analyses. For this purpose, three different models of nuclei spectrum were tested and were shown to fit reasonably well the experimental data. For each, two parameters had to be adjusted: the distribution of nucleation rarefaction pressure thresholds and the local concentration of nuclei corresponding to each threshold. The simplest model (Model 1) had only one type of nucleus, and is therefore unlikely to be realistic. However the experimental data from sample #2 were reasonably well fitted with this model (Figure 5(a)) especially the transition from a probability equals to 0.2 to almost certain. This fitting shows that the concentration of the nuclei is an important parameter. One could have expected a sharp transition with such a nuclei population, but it is worth remembering that for focused transducers, the volume (of the focal spot) for which the nucleation threshold is exceeded depends on the excitation amplitude. A better fit was obtained with the second model (Model 2). Nevertheless, for discrete nuclei spectra, the nucleation probability drops down to zero for peak rarefaction pressures weaker than the weakest nuclei threshold of the modeled nuclei population. In the case of Model 2, the experimental non-zero probability for a peak rarefaction pressure of -5.1MPa in sample #2 could not be fitted. This result reveals that the low probability measurement points are of particular importance in the choice of the best fitting model. Discrete models with more types of nuclei could have been tested, but since there is no evidence that some given nuclei sizes are favored in biological tissues, a continuous nuclei spectrum was modeled. The experimental data including the low probabilities were well fitted with this third model (Figure 5 (c) and Table 1). This tends to confirm Yount's assumption that the exponential size distribution is a persistent feature of nuclei populations in aqueous media (Yount 1997).
Nonetheless, even if the tested models show a reasonable fit with the experimental data, they were unable to truly determine the nuclei population here. Indeed, two main limitations remain. On the one hand, investigations with even larger number of independent acquisitions would be needed, in particular for rarefaction pressure leading to low nucleation probabilities, to better resolve the nucleation probability and improve the model fitting. On the other hand, to the best of our knowledge, no experimental validation of the analysis method is currently accessible. There is no gold-standard method able to measure the nuclei distribution in blood. Among the methods developed to measure the nuclei distribution of liquids and in particular sea water (d'Agostino 1987) and besides acoustic
22
detection, only Coulter counters could be used for blood. This electrical method measures the electrical perturbation produced by the nuclei when passing through a small orifice. It has been used to determine the size distribution of stabilized microbubbles (ultrasound contrast agents). However, current systems were reported to detect only bubbles larger than 0.46 µm (Kamaev et al 2004, Faez et al 2011). Several attempts to establish a controlled nuclei liquid have been performed by adding artificial nuclei in suspension: ultrasound contrast agents (Holland and Apfel 1990) or solid particles (Holland and Apfel 1990, Deng et al 1996b, Borkent et al 2007). Unfortunately, none is suited for the validation of the models presented in this paper. Indeed, ultrasound contrast agents are stabilized bubbles of micrometric size. Their size implies that their dynamics will not correspond to Blake's threshold in the low megahertz range. Solid particles have been shown to lead to reproducible cavitation activity (Borkent et al 2007). However they are not characterized well enough in terms of distribution of nucleation thresholds to be used as controlled nuclei. Despite of the lack of validation, one can notice that at least two statistical studies of the initiation of cavitation activity similar to ours have been performed previously to determine the nuclei distribution in pure water with a focused excitation (Herbert et al 2006) and in distilled water with a uniform excitation (Messino et al 1963). Both studies have shown to result in a better understanding and a quantitative assessment of the nuclei distribution in water.
In our study, model-based fitting represents a useful tool for the analysis of the nucleation probability in the sample, and the model-based analyses performed here present common features that could reveal information about the nuclei population in the samples. A first common point of all the model fits is that the total concentration of nuclei was several orders of magnitude lower than the concentration of blood cells. For pig blood (Thorn 2000), the normal concentration of red blood cells (RBC) and white blood cells (WBC) are respectively 6.5 109 RBC.mL-1 and 16.106 WBC.mL-1, while
the maximal concentration of nuclei determined in this study is 457 nuclei.mL-1. Chambers et al.
(1999) showed with a cavitation susceptibility meter and sheep blood that the in vivo concentration of nuclei with a radius greater than 0.3µm was at most 2.7 nuclei per liter. Even if the animal species are different, both results are consistent with the fact that nuclei concentration is extremely low compared to the blood cells. The second common point is that the nuclei radii estimated with the discrete models
23
are much smaller than 0.3µm, and are close to the value estimated by Hynynen (1991) for dog’s thigh muscle in vivo (~10 nm). This could explain the higher concentration found in comparison with Chamber et al 's study (1999). Whole blood constituents were also tested by Holland and Apfel (1990) as potential cavitation nuclei in vitro, and no evidence were found that they act as vehicles for nuclei. In our study, the nuclei could therefore be stabilized by components of the plasma or the preservative solution. Further investigations comparing the nucleation probability in the whole blood and plasma alone would be needed to test this hypothesis. Moreover, the preservative solution could be avoided by performing in vivo determination of the nuclei characteristics of blood with a bypass like Chambers et al (1999). This solution will in addition allow collecting a large set of independent acquisitions. Such investigations are beyond the scope of this paper, but will be considered in the near future.
The weakest peak rarefaction pressures for which nucleation was detected were quite high in this study (Table 1), and could be interpreted as the cavitation thresholds of the samples. Two other studies have been found in the literature about cavitation thresholds in whole blood sample. They are summarized in table 2. No direct comparison with our results can be done as the blood conditioning and the sonication parameters differ. Nevertheless these studies are the closest ones to the work described in this paper. Measurements performed on fresh blood less than 12 hours after extraction (Deng et al 1996a) or in vivo(Ivey et al. 1995) yield to higher cavitation thresholds than the one obtained in this paper. However, cavitation thresholds obtained from bank blood are similar to ours. They also correspond to the closest setup to our experiments: blood conditioning is similar, very short excitations are used, but the center frequency and the PRF differ, and also the blood specie. No explanation about the discrepancy between fresh blood and bank blood is given in Deng et al(1996a). Concerning the in vivo dog study, pressure levels and sonication durations are close to the ones yielding to in vitro boiling effect (Canney et al 2010) so that nucleation might be due to temperature elevation rather than mechanical effects. In both studies, the authors point out the low sensitivity of the detection due to the presence of scatterers (red blood cells) hiding the bubble signature. According to Deng et al (1996a), this might be the reason why a lower cavitation threshold is measured in the plasma alone. Our differential approach based on the subtraction of very high frame rate images permits to get rid of this hindering effect. A third study using lithotripter shockwave exposure was
24
performed by Williams et al (1989) on in vitro human blood and in vivo dog blood, but the rarefaction peak pressure are not given and difficult to estimate, and so are the cavitation thresholds found. This third study indicates that bubble nucleation in in vivo blood requires higher excitation amplitude than
in vitro blood samples. However, in vitro the authors acknowledged that cavitation could have then
aroused from the blood-container interface. This possibility was avoided here thanks to the localization of the nucleation events.
Our results are in agreement with an indirect estimation of cavitation threshold in blood performed by Hwang et al (2005 and 2006) in rabbits. In their study, Hwang et al investigated cavitation-induced vascular damages at 1MHz with and without injection of ultrasound contrast agent. Without contrast agent, they report a statistically significant increase in endothelial surface damage at 9 MPa (Hwang 2006), with a slight increase in extravasation score between 3.35MPa and 6.5 MPa peak negative pressure (Hwang 2005).
Our study demonstrates both the feasibility of the nucleation probability measurements with a fair accuracy, and the potential of using a model to determine the distribution of the nuclei population in blood. The assessment of the nuclei population in blood would provide a better understanding of the formation of bubbles in medical ultrasound and hyperbaric decompression. In particular, the assessed nuclei population could be used has an input in probabilistic models of decompression sickness (Wienke 2009), so as to predict its occurrence. Since some variability could already be noticed between the two tested samples, investigations on a large number of samples, and a study of the variation of the nucleation probability and nuclei population with the physiological and biochemical properties of the blood would help determining the crucial parameters. Such investigations could result in a great improvement of the safety in diagnostic ultrasound (Duck 2008) and diving with compressed gas (Blatteau et al 2006).
25
Conclusions
Bubble nucleation events were detected in whole pig blood in vitro using ultrasound-based active and passive detection imaging. The nucleation events were induced acoustically with short excitations of high amplitude, and their occurence was confirmed by specific features on both the passive and the active images.
A statistical analysis was developped to evaluate the nucleation probability for pulsed insonifications, and was experimentally tested on two blood samples with at least 330 independant acquisitions with different peak rarefaction pressures at focus. The probability range from 0 to 1 was covered, providing more information about the nucleation properties of a biological sample than the single value of cavitation threshold.
A model-based analysis of the experimental probability was introduced to investigate the amount of additional caracteristics that could be extracted from this statitical information. It showed that for a focused excitation, the concentration of nuclei greatly impacts the probability of nucleation. Moreover, the model fitting introduced here confirms that blood has a very low concentration of nuclei, in comparison with blood cells in particular. Among the tested nuclei spectrum, the continuous distribution of nuclei is the most likely to correspond to the actual population of the tested samples.
Finally and above all, the possibility of assessing the nuclei population in blood opens perspectives for a better understanding of the biological factor determining the nuclei sprectrum, and could impact both medical ultrasound and hyperbaric decompression.
Acknowledgments
The authors thank the IMM research group (Paris, France, ww.imm-recherche.com) for their support and fruitful discussions. We are also thankful to Pr. Frédéric Caupin for helpful discussions about the model part.
26
References
Angelsen BAJ. Ultrasound Imaging: Waves, Signals and Signal Processing, Vol. 1. Emantec AS, 2000.
Apfel RE, Holland CK. Gauging the likelihood of cavitation from short-pulse, low-duty cycle diagnostic ultrasound. Ultrasound Med. Biol. 1991;17:179-85.
Atchley AA. The Blake threshold of a cavitation nucleus having a radius-dependent surface tension. J. Acoust. Soc. Am. 1989;85:152-57.
Atchley AA, Prosperetti A. The crevice model of bubble nucleation. J. Acoust. Soc. Am. 1989;86:1065–84.
Barnett S. Nonthermal issues: Cavitation—Its nature, detection and measurement. Ultrasound Med. Biol. 1998;24 Suppl 1:S11-S21.
Barratt DM, Harch PG, Van Meter K. Decompression illness in divers: a review of the literature. Neurologist. 2002;8:186–202.
Bashirov AE, Kurpınar EM, Özyapıcı A. Multiplicative calculus and its applications, Journal of Mathematical Analysis and Applications. 2008; 337: 36-48
Blatteau JE, Souraud JB, Gempp E, Boussuges A. Gas nuclei, their origin, and their role in bubble formation. Aviat.Space Environ. Med. 2006;77:1068–76.
Blake FG. The Onset of Cavitation in Liquids, Tech. Mem. No. 12, Acoustics Research Laboratory, Harvard University, Cambridge. 1949
Borkent BM, Arora M, Ohl CD. Reproducible cavitation activity in water-particle suspensions J. Acoust. Soc. Am. 2007. 121:1406
Canney MS, Khokhlova VA, Bessonova OV, Bailey MR, Crum LA. Shock-induced heating and millisecond boiling in gels and tissue due to high intensity focused ultrasound. Ultrasound Med. Biol. 2010;36:250-67.
27
Chambers SD, Ceccio SL, Bartlett GRH. Determination of the in vivo cavitation nuclei characteristics of blood. ASAIO Journal 1999;45:541-9.
Church CC. A theoretical study of cavitation generated by an extracorporeal shock wave lithotripter. J. Acoust. Soc. Am. 1989;86:215-27
Church CC. Spontaneous homogeneous nucleation, inertial cavitation and the safety of diagnostic ultrasound. Ultrasound Med. Biol. 2002;10:1349–64.
Church CC. Frequency, pulse length, and the mechanical index. ARLO 2005:6:162-68.
Church CC, Miller MW. Quantification of risk from fetal exposure to diagnostic ultrasound, Prog. Biophys. Mol. Bi. 2007;93:331-53.
Crum LA, Roy RA, Dinno MA, Church CC, Apfel RE, Holland CK, Madanshetty SI. Acoustic cavitation produced by microsecond pulses of ultrasound: A discussion of some selected results. J. Acoust. Soc. Am. 1992;91:1113-9.
d'Agostino L. Experimental and theoretical study on cavitation inception and bubbly flow dynamics : I. Design, development and operation of a cavitation susceptibility meter, Dissertation (Ph.D.), California Institute of Technology 1987
Deng CX, Xu Q, Apfel RE, Holland CK. In vitro measurements of inertial cavitation thresholds in human blood. Ultrasound Med. Biol. 1996a;22:939-48.
Deng CX, Xu Q, Apfel RE, Holland CK. Inertial cavitation produced by pulsed ultrasound in controlled host media, J. Acoust. Soc. Am. 1996b; 100:1199–1208.
Duck FA. Hazards, risks and safety of diagnostic ultrasound. Med Eng Phys. 2008;30:1338-48. Faez T., Goertz D., De Jong N. Characterization of Definity™ Ultrasound Contrast Agent at Frequency Range of 5–15 MHz, Ultrasound Med. Biol. 2011, 37: 338-342
Fox FE, Herzfeld KF. Gas bubbles with organic skin as cavitation nuclei. J. Acoust. Soc. Am. 1954;26:984–89.
28
Gateau J, Aubry JF, Pernot M, Fink M, Tanter M. Combined passive detection and ultrafast active imaging of cavitation events induced by short pulses of high-intensity ultrasound. IEEE Trans. Ultrason Ferroelectr. Freq. Control. 2011a;58:517-32.
Gateau J, Aubry JF, Chauvet D, Boch AL, Fink M, Tanter M. In vivo bubble nucleation probability in sheep brain tissue. Phys. Med. Biol. 2011b;56:7001–15.
Harte D. Non asymptotic binomial confidence intervals. online 2002; available from http://www.statsresearch.co.nz/pdf/confint.pdf .
Harvey EN. Decompression sickness and bubble formation in blood and tissues - Harvey lecture. New York Acad. Med. 1945;21:505-36.
Harvey EN, Barnes DK, McElroy WD, Whiteley AH, Pease DC, Cooper KW. Bubble formation in animals. I, Physical factors. J. Cellular and Comp. Physiol 1944a;24:1-22.
Harvey EN, Whiteley AH, McElroy WD, Pease DC, Barnes DK. Bubble formation in animals. II, Gas nuclei and their distribution in blood and tissues. J. Cellular and Comp. Physiol. 1944b;24:23-24.
Herbert E, Balibar S, Caupin F. Cavitation pressure in water. Phys. Rev. E 2006;74:041603.
Holland CK, Apfel RE. An improved theory for the prediction of microcavitation due to pulsed ultrasound. IEEE Trans. UFFC 1989;36:204–08.
Holland CK, Apfel RE. Thresholds for transient cavitation produced by pulsed ultrasound in a controlled nuclei environment. J. Acoust. Soc. Am. 1990;88:2059:69.
Hynynen K. The threshold for thermally significant cavitation in dog's thigh muscle in vivo. Ultrasound Med. Biol. 1991; 17(2): 157-169
Hwang JH, Brayman AA, Reidy MA, Matula TJ, Kimmey MB, Crum LA. Vascular effects induced by combined 1-MHz ultrasound and microbubble contrast agent treatments in vivo. Ultrasound Med Biol. 2005 31(4):553-64.
Hwang JH, Tu J, Brayman AA, Matula TJ, Crum LA. Correlation between inertial cavitation dose and endothelial cell damage in vivo. Ultrasound Med Biol. 2006 32(10):1611-9.
29
Ivey JA, Gardner EA, Fowlkes JB, Rubin JM, Carson PL. Acoustic generation of intraarterial contrast boluses. Ultrasound Med. Biol. 1995;21:757-67.
Jensen CR, Ritchie RW, Gyöngy M, Collin JRT, Leslie T, Coussios CC. Spatiotemporal Monitoring of High-Intensity Focused Ultrasound Therapy with Passive Acoustic Mapping. Radiology 2012;262:252-61.
Kamaev PP, Hutcheson JD, Wilson ML, Prausnitz MR. Quantification of Optison bubble size and lifetime during sonication dominant role of secondary cavitation bubbles causing acoustic bioeffects, J. Acoust. Soc. Am. 2004; 115: 1818
Krasovitski B, Frenkel V, Shoham S, Kimmel E. Intramembrane cavitation as a unifying mechanism for ultrasound-induced bioeffects. PNAS 2011;108:3258-63.
Leighton TG. The acoustic bubble. Academic Press, 1997.
McLaughlan J, Rivens I, Leighton TG, ter Haar G. A Study of Bubble Activity Generated in Ex Vivo Tissue by High Intensity Focused Ultrasound, Ultrasound Med. Biol. 2010; 36(8):1327-44
Messino D, Sette D, Wanderlingh F, Statistical Approach to Ultrasonic Cavitation. J. Acoust. Soc. Am. 1963; 35: 1575
Miller DL. Overview of experimental studies of biological effects of medical ultrasound caused by gas body activation and inertial cavitation. Prog. Biophys. Mol. Bi. 2007;93:314-30.
Montaldo G, Tanter M, Bercoff J, Benech N, Fink M. Coherent plane-wave compounding for very high frame rate ultrasonography and transient elastography. IEEE Trans. Ultrason Ferroelectr. Freq. Control 2009;56:489-506.
Neppiras EA, Noltingk BE. Cavitation produced by ultrasonics - Theoretical conditions for the onset of cavitation. Proc. Phys. Soc. London B 1951;64:1032–38.
Raymond MA, Smith ER, Liesegang J. The physical properties of blood – forensic considerations. Sci. Justice. 1996;36:153–60.
Sommer FG, Pounds D. Transient cavitation in tissues during ultrasonically induced hyperthermia. Med. Phys. 1982; 9(1):1-3.
30
Thorn CE. Normal hematology of the pig. In: Feldman BF, Zinkl ZG, Jain NC, eds. Schalm's Veterinary Hematology, 5th ed. Philadelphia: Lippincott Williams and Wilkins, 2000; 1089-1095
Wienke BR. Diving decompression models and bubble metrics: Modern computer syntheses. Computers in Biology and Medicine 2009;39:309-31.
Williams AR, Delius M, Miller DL, Schwarze W. Investigation of cavitation in flowing media by lithotripter shock waves both in vitro and in vivo. Ultrasound Med. Biol. 1989;15:53-60.
Yount DE. On the evolution, generation, and regeneration of gas cavitation nuclei. J. Acoust. Soc. Am. 1982;71:1473-81.
Yount DE. On the elastic properties of the interfaces that stabilize gas cavitation nuclei. J Colloid Interface Sci. 1997;193:50-9.
Yount DE, Yeung CM, Ingle FW. Determination of the radii of gas cavitation nuclei by filtering gelatin. J. Acoust. Soc. Am. 1979;65:1440-50.
31
Tables
Blood sample
Continuous model parameters
50% nucleation propability pressure (MPa) Minimum peak rarefactional pressure with detected cavitation events (MPa) n1 (Nuclei /mL) P1 (MPa) r 2 #1 307 -16.9 0.9986 -6.3 -3.6 #2 457 -29.9 0.9948 -9.7 -5.1
Table 1: Summary of the results obtained on the two blood samples. The r² values are the coefficient of determination for the non-linear regression of model 3.
Blood Conservation Frequency Excitation duration
Pulse Repetition Frequency
Peak negative pressure for first cavitation detection Detection method Ref Human, ex vivo with EDTA, from blood bank, extracted two days before
2.5 MHz
20 cycles 1 kHz
-4 MPa Ultrasound active detection, no subtraction: 30MHz focused
detector, perpendicular to
the propagation axis of the high
pressure excitation. Deng et al (1996a) -3 MPa (plasma alone) Human, ex vivo with EDTA, from blood bank, extracted 12 hours before 2.5 MHz < -5.2 MPa 4.3 MHz < -6.2 MPa Dog, in vivo Anesthetized, with isoflurane inhalation 1.8 MHz 12 ms (2.2 104 cycles) - -24 MPa (1. 9 104 W.cm-2) Linear extrapolation Ultrasound active detection, no subtraction : Conventional B-mode imaging at 5MHz and power Doppler at 6MHz Ivey et al. (1995) 250 ms (4.5 105 cycles) -11 MPa (4300 W.cm-2) Linear extrapolation Pig, ex vivo with CPDA-1 and heparin, extracted maximum 7 days before 660kHz 2 cycles 101 Hz -3.6 MPa Combined passive and ultrafast active ultrasound imaging -
Table 2: Summary of studies on cavitation inception in whole blood. The last row corresponds to the study presented in this paper.
32 Figure 1. Experimental set-up
Figure 2: Pressure waveforms recorded for two-cycle high amplitude pulse excitations of the single-element transducer at its focal point. The signals shown are the averages of acquisitions low-pass filtered below 50 MHz (IIR, Butterworth low-pass digital filter design, order 3, 50MHz cutoff frequency). The measurements were made in degassed water. The peak negative pressure is indicated on the pressure axis.
33
Figure 3. Passive and active detection output for two typical cases of nucleation detection. A nucleation event could be detected in case #1 and not in case #2. Unfiltered passive radio-frequency signals recorded with the 33rd detection element of the array (a), and the corresponding magnitude of the Fourier transform (b). The vertical dashed lines indicate the integer multiples of the center frequency of the high-amplitude excitation pulse (660 kHz). Images corresponding to case #1: (c) passive image obtained by beamforming the pass filtered passive signal (IIR, Butterworth high-pass digital filter design, order 3, 3 MHz cutoff frequency), (d) first active image, (e) corresponding AChD image. The focal point of the single-element transducer is marked on the images with a red rhombus.
34
Figure 4: Probability of bubble nucleation in pig whole blood as a function of the peak negative pressure. The error bars represent the 95% confidence interval.
35
Figure 5: Model fits of the experimental nucleation probability of sample #2. The model parameters that provide the best fitting in the least-mean square sense are given in the legend. The curve corresponding to the model is plotted with the experimental data for (a) Model 1, (b) Model 2, (c) Model 3. For Model 2, the probability corresponding to each of the nuclei types independently is plotted in continuous line (b).