HAL Id: hal-00759094
https://hal.archives-ouvertes.fr/hal-00759094
Submitted on 30 Nov 2012
HAL is a multi-disciplinary open access
archive for the deposit and dissemination of sci-entific research documents, whether they are pub-lished or not. The documents may come from teaching and research institutions in France or abroad, or from public or private research centers.
L’archive ouverte pluridisciplinaire HAL, est destinée au dépôt et à la diffusion de documents scientifiques de niveau recherche, publiés ou non, émanant des établissements d’enseignement et de recherche français ou étrangers, des laboratoires publics ou privés.
Genetic variability in biomass allocation to roots in
wheat is mainly related to crop tillering dynamics and
nitrogen status
Vincent Allard, Pierre Martre, Jacques Le Gouis
To cite this version:
Vincent Allard, Pierre Martre, Jacques Le Gouis. Genetic variability in biomass allocation to roots in wheat is mainly related to crop tillering dynamics and nitrogen status. European Journal of Agronomy, Elsevier, 2013, 46, pp.68-76. �10.1016/j.eja.2012.12.004�. �hal-00759094�
Genetic variability in biomass allocation to roots in wheat is mainly related to crop tillering 1
dynamics and nitrogen status 2
3
Vincent Allard1,2, Pierre Martre1,2, Jacques Le Gouis1,2 4
5
1
INRA, UMR 1095 Genetics, Diversity and Ecophysiology of Cereals, 5 chemin de Beaulieu, 6
F-63 039 Clermont-Ferrand, Cedex 2, France 7
2
Université Blaise Pascal, UMR 1095 Genetics, Diversity and Ecophysiology of Cereals, F-8
63 177 Aubière, France 9
10
Author for correspondence: 11 Vincent Allard 12 Tel: +33 4 73 62 44 22 13 Fax: +33 4 73 62 44 57 14 Email: vincent.allard@clermont.inra.fr 15 16 17
Abstract
18
Improving arable crops Nitrogen Use Efficiency (NUE) is a major target of plant breeding. In 19
wheat, a large part of the Nitrogen (N) harvested in the grain originates from N remobilization 20
from vegetative organs during the post-anthesis period. While N remobilization from above-21
ground organs such as leaves and stems has been extensively studied, studies about N 22
remobilization from roots are scarce. The existence of genetic variability for biomass 23
allocation to the root pool as well as for root N concentration and remobilization may strongly 24
affect the N economy of the crop. By studying the root system of 16 elite wheat genotypes 25
under two contrasted N treatments, we showed that the biomass allocation to roots was 26
strongly related to crop tillering dynamics and N nutritional status. Therefore, the apparent 27
genetic variability for biomass allocation to roots is not intrinsic, but rather a consequence of 28
genetic variability for crop growth and N utilization taken as a whole. In addition, we showed 29
here that the N amount potentially remobilized from roots to the grain is extremely small. 30
Existing genetic variability for root N content and remobilization efficiency cannot explain 31
observed differences in genotypes grain N concentration or N yield. These results indicate 32
that there is little prospect for breeding strategies specifically aiming at optimizing wheat root 33
biomass allocation and N remobilization for improving NUE and GPC for elite genotypes at 34
least in highly productive conditions. These results nevertheless do not imply that the root 35
compartment should be totally discarded in all breeding programs since architectural traits 36
such as root length or distribution may impact strongly crop performance. 37
38
Wheat; gentic variability; root; NUE 39
40
41 42
1. Introduction
43
Until very recently, productivity has been the major target of agronomical sciences. The 44
growing demand for low input agriculture, driven both by economical and environmental 45
considerations emphasizes now the improvement of resource use efficiency. Nitrogen (N) 46
fertilizers play a major role in crop productivity, but are also one of the main sources of 47
agricultural pollution either through nitrous oxide (N2O) volatilization or nitrate (NO3-)
48
leaching (IPCC, 2001; DECC, 2010). N fertilization represents also a major cost for farmers. 49
Increasing N use efficiency (NUE) received therefore much attention in the recent years 50
whether through improved agronomical practices (Cui et al, 2011) or plant breeding (eg Hirel 51
et al. 2007; Foulkes et al., 2009; Gaju et al., 2011). This quest for highly efficient wheat 52
cultivars and agronomical practices is made more complex by the fact that not only grain 53
yield but also grain protein concentration (GPC), the major determinant of wheat end-use 54
quality (eg Shewry 2007; Oury et al., 2010) should be improved. The involvement of N in 55
both biomass accumulation and grain protein concentration determination creates a need for 56
studying the complex interactions between carbon and N metabolisms that determine crop 57
productivity and quality (Triboi and Triboi-Blondel, 2002). 58
59
In wheat, the major part of N uptake occurs before anthesis. After anthesis, N remobilization 60
from the vegetative organs toward the growing grains is a strong determinant of both GPC 61
and grain yield through the senescence process that alters the crop photosynthetic capacity 62
(Borell et al., 2001; Triboi et al 2006; Bogard et al. 2011). Understanding finely N 63
remobilization process is therefore a key question for the optimization of the N economy of 64
wheat crops. N distribution and remobilization patterns in aboveground organs have received 65
much attention in past years (e.g. Gregersen et al., 2008; Taylor et al., 2010). In particular, it 66
order kinetic that is independent of organ age, genotype and N nutrition (Bertheloot et al., 68
2008). Genetic variability for N remobilization efficiency has also been characterized 69
(Barbotin et al 2005, Uauy et al., 2006; Kichey et al 2007) showing relatively large genetic 70
variation for this trait and strong interaction with the environment and N fertilizer regimes. 71
72
Oppositely little is known about the N allocation and remobilization pattern in the wheat root 73
system. In controlled conditions, wheat roots have the ability to remobilize N to the grain 74
(Andersson et al., 2005) and are the last organs to senesce (Peoples and Dalling, 1988). In 75
these conditions, N partitioning to the roots and redistribution of N from the roots to the grain 76
may play an important role for the nitrogen budget of the whole plant (Andersson et al., 2005) 77
since a large part (10 to 20%) of the total plant N at maturity appears to remain in the roots 78
(Andersson and Johansson, 2006). This may have several consequences since most studies 79
occult the root compartment. First, accounting for the root compartment may affect to some 80
extent whole plant NUE if it is associated to different shoot/root allocations (Andersson et al., 81
2005). Substantial genetic variation has already been observed for this trait in wheat (Siddique 82
et al., 1990; Hoad 2001). Second, if variations in shoot/root allocation were associated to 83
large differences in root N content and remobilization patterns, it may impact other 84
agronomical traits such as grain protein concentration. The aim of this study was to analyze 85
the N allocation to roots in wheat and the net N remobilization from roots during the post-86
anthesis period under field conditions. A particular emphasis was put on the evaluation of the 87
genetic variability associated with these processes. Root biomass, relative allocation and mass 88
loss were studied on 16 bread wheat cultivars grown in the field at two N levels. Root N 89
content and remobilization were quantified in order to evaluate the potential role of N 90
remobilization from roots in the N economy of the crop. 91
2. Materials and Methods
93
2.1. Plant material and growing conditions
94
Sixteen genotypes of winter bread wheat (Table 2) were studied in a field experiment carried 95
out at Clermont-Ferrand, France (45°47' N, 3°10' E, 329 m elevation) during the 2007-2008 96
growing season. This panel of genotypes represents a large part of the genetic variability for 97
nitrogen use efficiency and its components (Le Gouis et al., 2000; Gaju et al., 2011) and for 98
the deviation from the negative correlation between grain yield and protein concentration (Oury 99
et al., 2003) reported in UK and France elite germplasms. Soil characteristics f are presented in 100
Table 2. Crops were sown at a density of 250 seeds m-2 on 06 November 2007. A high (HN) 101
and a low (LN) N treatments were applied. For the HN treatments, the rates of N fertilisation 102
were determined using the balance sheet method (Rémy & Hébert, 1977) to optimize grain 103
yield. N was applied in four splits as ammonium nitrate granules (33.5% N) with 4, 8, 8, and 4 g 104
N m-2 being applied when Rialto, which has a rate of development in the middle of the range of 105
the sixteen cultivars used in this study (Table 2), reached growth stages (GS; Zadocks et al., 106
1974) GS21 (beginning tillering), GS31 (ear at 1cm), GS39 (male meiosis), and GS61 107
(anthesis) respectively. In the LN treatment, 4 g N m-2 were applied in one split when Rialto 108
reached GS31. The experimental field was not irrigated. All other crop inputs including weed, 109
disease and pest control, and potassium, phosphate and sulfur fertilizers, were applied at 110
levels to prevent nutrients or weeds, diseases and pests from limiting yield. The experimental 111
design was a split-plot in which N treatment was randomized on main plots, cultivars were 112
randomized on the sub-plots and each treatment was replicated three times. Sub-plot size was 113
7 × 1.5 m with an inter-row spacing of 0.17 m. 114
2.2. Plant sampling
116
Plants were sampled at anthesis (GS61) and full grain maturity (GS92). When each genotype 117
reached the appropriate stage, 0.5 m² per sub-plot was cut at ground level. The total fresh 118
mass of the samples was determined and a 25% sub-sample was randomly selected. The main 119
and secondary shoots were separated and counted. Shoots were classified as main when the 120
top of their ear was in the top 0.15 m layer of the canopy. Thirty main shoots were randomly 121
selected and dissected into individual leaf laminae, stems (including leaf sheaths) and ears. 122
The fresh mass of the secondary shoots of the sub-samples was determined, and sub-samples 123
of secondary shoot (20%) were randomly selected. Their fresh mass was determined before 124
separating them into leaf laminae, stems (including leaf sheath) and ears. For both main and 125
secondary shoots, green and dead photosynthetic (identified by their brownish colour) tissues 126
were analysed separately. 127
128
2.3. Root sampling
129
Root sampling was performed with a square-shaped soil corer (height = 40 cm, section = 18 × 130
18 cm). The corer was positioned on the soil, centered on a plant row and drove into the soil 131
to a depth of 30 cm with a sledge hammer. The soil core was then retrieved, soaked into 10 L 132
of water to facilitate soil disaggregation and washed abundantly with water above a 1 mm 133
mesh-size sieve until roots were totally free of soil. 134
135
2.4. Plant tissues dry mass and nitrogen concentration,
136
Lamina, stem, chaff, grains and roots dry mass (DM) of the main shoots were determined 137
after oven drying at 80°C for 48h. Samples were then ground and their total N concentration 138
(N mass per unit dry mass) was determined with the Dumas combustion method (AOAC 139
method n° 7.024) using a FlashEA 1112 N/Protein analyser (Thermo Electron Corp., 140
Waltham, MA, USA). 141
142
2.5. Calculations
143
Several composite traits were calculated. Biomass allocation was investigated by calculating 144
the root/rhoot ratio (R/S) as follows: 145
R/S = SDM / RDM (1)
146
where SDM is the total aboveground dry mass including leaves, stems, chaff and grain and 147
RDM the total root dry mass. The N root/shoot ratio (RN/SN) was calculated similarly as: 148
RN/SN = RN / SN (2)
149
where SN and RN are the N amount in the aboveground and belowground organs 150
respectively. Crop N harvest index was calculated based on shoot N only (NHI) or total plant 151 N (NHItot): 152 NHI = GN / SN * 100 (3) 153 NHItot = GN / (SN + RN) * 100 (4) 154
Where GN is the amount of N in the grains. 155
In order to evaluate the efficiency of N assimilation in the crop, nitrogen utilisation efficiency 156
was calculated based on shoot N only (NUtE) or total plant N (NUtEtot):
157
NUtE = GDM / SN (5)
158
NUtEtot = GDM / (SN + RN) (6)
159
Where GDM is the grain dry mass. 160
The amount of N lost by roots (NLR) during the post-anthesis period was calculated as the 161
differences of N amounts in roots between anthesis (RNanth) and maturity (RNmat):
162
NLR = RNanth - RNmat (7)
The amount of N potentially remobilized from senescent roots (NRR0.3) was estimated based
164
on the assumption that N concentration in dead root tissue was fixed at 0.3% since this value 165
was close from the lowest root N% observed in this study: 166
NRR0.3= (RDManth - RDMmat) x (RN%anth - 0.3) / 100 (8)
167
Where RN%anth is the N concentration in root material at anthesis.
168
Finally the proportion of grain N remobilized from roots (PGNR) was calculated as 169
PGNR= GNmat / NRR0.3 (9)
170
The N nutrition Index (NNI) was estimated at anthesis as proposed by Justes et al. (1994). 171
Nt = 5.35 x SDM-0.442 (10)
172
Where Nt is the critical N concentration (%DM) and SDM expressed in t.ha-1. NNI is then
173
calculated as the ratio between actual shoot N concentration and Nt.
174 NNI = SN% / Nt (11) 175 3. Results 176 3.1. Climate 177
The first part of the crop cycle occurred under relatively dry conditions (Fig. 1). During the 178
September-February period rainfall was about 30 % below the 20-year average for the same 179
period. Oppositely the following part of the cycle occurred under extremely wet conditions. 180
From March to July rainfall reached 390 mm representing a 40% excess compared to the 20-181
year average. Consequently the whole post-anthesis period was characterized by an absence 182
of water limitation. 183
184
3.2. Crop structure at anthesis
185
The genotypes used in the present experiment exhibited a large variation in term of 186
developmental rate. Anthesis date varied from May 19th (Récital) to June 4th (Beaver and 187
Consort; Table 2). Tiller number at anthesis was affected by N treatment (P=0.048) but no 188
genotype effect was found (Table 2). On average, tiller number at anthesis was 442 and 654 189
tiller m-2 under LN and HN, respectively. At anthesis, SDM was strongly affected by N 190
treatment with an 18% increase under HN compared to LN averaged across all genotypes. 191
Statistically significant differences between genotypes were also measured. In particular, 192
Récital and Renan, the two earliest genotypes, had high anthesis SDM under both N 193
treatments. Comparatively RDM was not affected by N treatment with 190 g DM m-2 on 194
average over all combinations (Table 2). Genotypic effect was particularly strong with three 195
genotypes having low RDM under both N treatments (Arche, CF99102 and CF 9107). No 196
correlation was found between SDM and RDM at anthesis (data not shown) with r² of 0.001 197
and 0.02 under LN and HN, respectively. RDM was strongly and positively associated with 198
tiller number (Fig. 2) with about 50% of the RDM variation explained by tiller number under 199
both N treatments. The slope of the regression for LN and HN treatments were not 200
statistically different (common slope: 0.22 gDM tiller-1) but the intercept was significantly 201
lower under HN than LN. Comparatively, tiller number did not explain SDM at anthesis 202
(Fig.2; r² = 0.004 and 0.02 under LN and HN, respectively). The allocation between shoot and 203
root of both DM (Fig. 3) and N were correlated with crop N status but only under LN. Under 204
LN, R/S ratio varied between 0.18 and 0.30 while NNI varied between 0.38 and 0.55 (Fig. 3), 205
the latter values typically found under strong N restrictions. The predictive power of NNI was 206
even stronger for the N allocation with RN/SN values ranging between 0.07 and 0.13 (data 207
not shown). Both relations were poorly explicative under HN (Fig. 3). This was particularly 208
caused by four outliers (genotypes Beaver, Rialto, Savannah and Soissons) with high 209
allocation of DM and N to roots. These outliers were not explained by relatively higher 210
variation coefficients than other genotypes (data not shown). If these outliers are removed, 211
average R/S for the 12 remaining genotypes for HN was 0.19 and RN/SN was 0.08. Both 212
values were similar to the lower range of the values observed for LN (Fig. 3). 213
RDM variation during the post-anthesis period was negatively correlated with RDM at 214
anthesis under both N treatments (Fig. 4, r² = 0.38 and 0.67 under LN and HN respectively) 215
and ranged from -5% to -54%. The proportional loss of belowground biomass increased with 216
the initial belowground biomass present at anthesis. 217
218
3.3. Nitrogen remobilization from the belowground compartment and effects on nitrogen
219
allocation calculations
220
NHI at anthesis was both under strong N treatment and genotype effects (Table 3). On 221
average over genotypes NHI equaled 79 and 72% under LN and HN, respectively. 222
Accounting for belowground N in the calculation led to an about 3 percent point decrease in 223
the calculated NHItot. Nevertheless this did not impact significantly genotypes ranking for this
224
trait. Spearman’s rank test gave correlation Rs values of 0.83 and 0.97 for LN and HN, 225
respectively, indicating strong rank correlations between the two calculations. Results were 226
equivalent for NUtE calculations with a small impact of accounting for belowground N pool. 227
NUtEtot was on average 1.7 percent point lower than NUtE. Again this has no impact on
228
genotypes ranking (Rs values of 0.96 and 0.98) under LN and HN, respectively. Calculation 229
of N potentially lost by roots during the post anthesis period (NLR) indicated that only a small 230
N amount was lost as senesced material or remobilized during this period. The largest part of 231
this N amount was caused by a decreased in RDM and not by a decrease in remaining 232
biomass decrease in N concentration. Indeed, RN% variation during post anthesis under LN 233
was nil (0.41% at both anthesis and maturity) and only marginal under HN (0.83 and 0.79 at 234
anthesis and maturity, respectively). Calculating potentially remobilized N from senesced 235
roots is hazardous since the N concentration of senesced root material was not measured and 236
may vary with time, type of roots, treatment and genotype. Nevertheless, N remobilization 237
from roots (NRR0.3) was estimated based on a putative N concentration in the senesced root
238
material of 0.3%, a value close from the lowest root N concentration observed in the present 239
experiment but much lower than reported values for dead fine roots (Gordon and Jackson, 240
2000). Even based on the assumption of a 0.3% N in dead roots, extremely small amount of 241
potentially remobilized N from roots were calculated. NRR0.3 values were on average 0.1 and
242
0.4 gN m-2 for LN and HN, respectively, corresponding to 0.8 and 2.3% of the total grain N at 243
maturity. Genetic variation observed for both the quantity and the proportion of N 244
remobilized from roots were not correlated with any of the traits of interest such as grain N 245
quantity or concentration (data not shown). In addition remobilization efficiency of the 246
belowground plant material was not related whatsoever with remobilization efficiency of 247
aboveground vegetative organs. 248
249
4. Discussion
250
The aim of this study was to analyze the potential impact of the belowground compartment on 251
the N economy of wheat. Based on previous results in controlled conditions showing that the 252
N economy of the whole plant was affected to a great extent by the N amount in the roots 253
(Andersson et al., 2005), our main objective was to test, under field conditions it the genetic 254
variability associated with N remobilized from roots was detectable. Indeed, large genetic 255
variation associated with this process might strongly impact the assessment of the genetic 256
diversity of agronomical traits of interest such as NUE, post-anthesis N uptake and grain N. It 257
is clear that data obtained in a single environment cannot reveal the full extent of genetic 258
variation among a set of genotypes. However, this information can help determine if 259
putatively observed genetic variability relies on intrinsic genetic differences of the root 260
compartment or if these differences follow a generic response function to traits obtained at the 261
whole plant level. 262
263
4.1. Root sampling methodology
264
In the present experiment root biomass was only sampled in the 0-30 cm horizon. Clearly the 265
full root biomass was not harvested by this method since the maximum rooting depth was 266
evaluated to 90 cm at the experimental site. This would clearly be a strong limitation if the 267
objective was to compare genotypes in term of functional processes such as water and N 268
extraction capacity. Here, the key aspect was to retrieve a large proportion of the total root 269
biomass to assess differences of biomass and nitrogen allocation pattern between genotypes. 270
Kätterer et al. (1993) studied the root biomass of a winter wheat genotype under four 271
management treatments including dry and irrigated crops. On average, after anthesis about 272
85% of the root biomass was found in the top 30 cm horizon. This proportion tended to 273
increase in the well irrigated treatment. Sidique et al. (1990) also observed very high 274
proportion of the total root biomass in the first 30 cm. A root dry matter profile was available 275
for three genotypes and showed that more than 90% of the total root biomass was in this 276
horizon. Similar figures can be found in Wechsung et al. (1999). Xue et al. (2003) reported 277
lower proportion of root biomass (about 60%) in the first 30 cm, but in a soil with a maximum 278
rooting depth of 2 m thus more than twice as deep as our soil. We therefore believe that the 279
sampling method used in the present experiment allowed harvesting a very significant 280
proportion of the total root biomass and that it is very unlikely that significant bias would 281
hamper genotype comparisons. Kätterer et al. (1993) reported roots biomass values at anthesis 282
of 92 g m-2 while values presented by Siddique et al. (1990) at the same developmental stage 283
are three times higher (310 g DM m-2). With average values of about 200 g DM m-2 the values 284
of the present study tend to confirm that the sampled biomass is representative of the whole 285
soil profile. 286
287
4.2. Root biomass allocation and dynamics
288
The present data clearly shows the effect of the genetic differences in tiller numbers on both 289
root biomass and allocation. Comparatively, both aboveground biomass and yield were 290
independent of tiller number in the present study. Tiller number optimization has been 291
identified as a potential candidate trait for yield increase (Reynolds et al., 2009). Under 292
extremely limiting conditions such as strong terminal drought, low tiller number may be a 293
promising trait for water economy and final grain yield (Dugan et al., 2005; Munns and 294
Richards, 2007). The introduction of a reduced tillering (tin) gene in wheat lines has 295
nevertheless been shown to have extremely contrasted effects on yield depending on the 296
environment and genetic background but with a tendency towards grain yield reduction 297
(Mitchell et al., 2012). In the present growing conditions, with elite material, it seems that the 298
observed genetic variations in tiller number is only a phenotypic expression of the strong 299
phenotypic plasticity of wheat, a crop that is able to express yield in a range of ways through 300
strong compensations between yield components (Lawless et al., 2005; Sinclair and Jamieson, 301
2008). In particular the tiller size/density compensation process, well characterized in 302
perennial grasses (Matthews, 1996) seems to have operated in our conditions. Nodal root 303
emission is strongly synchronized with leaf and tiller production (Klepper et al 1984). This 304
coordination does not necessarily induce a metric relationship between tiller number and root 305
biomass. Individual root can vary in diameter, length or density and have a specific branching 306
pattern that potentially breaks this relationship. In addition, low tillering can be seen as a 307
possibility for plants to allocate more resources towards root development (Duggan et al., 308
2005). Nevertheless, the data presented here show that the tillering dynamic of the crop has a 309
strong influence on root biomass at anthesis. 310
311 312
A second strong determinant of biomass allocation to roots at anthesis is the crop nitrogen 313
status. The effect of the plant nitrogen status on the R/S ratio of plant has received much 314
attention in particular for modeling purpose (Hilbert, 1990; Gleeson, 1993; Thornley, 1995; 315
1998; Agren and Franklin, 2003) and clearly demonstrated that the R/S decreases with 316
increasing N supply. These models use plant N concentration (Franklin and Agren, 2003) or 317
C, N availability (Thornley, 1995) to predict biomass allocation and are based on the 318
hypothesis that biomass allocation is strongly controlled at the plant level and optimized in 319
relation to the availability of C and N. In our study, NNI was the best predictive variable for 320
R/S. The nitrogen nutrition index as described in Gastal and Lemaire (2002) allows to 321
quantify the N status of the crop dynamically; i.e. accounting for the decreasing crop N 322
demand as crop gets larger (Gastal and Lemaire, 2002). Therefore, optimal crop relative 323
growth rate is attained for a crop N concentration, called critical N concentration that 324
decreases following a power function of crop biomass. NNI derives from a comparison 325
between actual crop N concentration and critical N concentration at the observed biomass and 326
allows the N status of the crop to be quantified over development and also to compare N 327
status of crops of different biomass. 328
329
Modeling analysis clearly showed that functional equilibrium approaches predicting R/S in 330
term of C and C co-limitation was not valid for extreme conditions of high and low N 331
availability (Agren and Flanklin, 2003). This can be related to the apparent saturation of the 332
R/S response to NNI for high NNI values. Indeed in the present study R/S reached a minimal 333
R/ value of about 0.2 in the HN treatment. A possible explanation for this saturation relies on 334
the positive correlation between tiller density and R/S observed here caused by the strong 335
coordination between tiller and root dynamic (Hoad et al., 2001) which may lead to a minimal 336
R/S under given environmental conditions. 337
Based on the strong association observed between root biomass and crop tillering dynamic on 338
the one hand and allocation and crop N status on the second hand, we believe that the 339
observed genetic variability for biomass allocation to roots (Table 2), is a consequence of 340
genetic variability for crop growth and N utilization taken as a whole rather than an intrinsic 341
variability for biomass allocation to roots. 342
343
In term of potential nutrient remobilization to the grain during the post anthesis period, it is 344
also important to assess the biomass variation of the root pool during this period. In wheat 345
decrease in root mass after anthesis is generally observed due to a root death rate exceeding 346
root production rate (Kätterer et al., 1993; Steingrobe et al., 2001). This is a common feature 347
observed in annual plants for which the developing grain is a strong competitive sink for the 348
carbon resource (Eissenstadt and Yanai, 1997) leading to a strong root length decline after 349
flowering in wheat (Box and Johnson, 1987 in Eissenstadt and Yanai, 1997). In the present 350
study we observed a strong negative correlation between root mass loss during the post-351
anthesis period and root biomass at anthesis. In other words, plants with high root biomass at 352
anthesis tend to loose a greater proportion of this biomass. A possible explanation relies on 353
the much shorter life span of fine roots compared to larger roots (Eissenstadt et al., 2000). 354
Indeed a large part of the root biomass variability may be associated with branching 355
variability leading to a greater proportion of fine roots in plants with high root biomass. No 356
root separation by class size could be performed in the present study therefore the causal 357
explanation of this process remains putative. Nevertheless, the key aspect is that the apparent 358
genotypic variation associated with root biomass loss follows general responses and probably 359
do not mean a genetic variability for root longevity stricto sensu. 360
361
4.3. Root nitrogen content and remobilization
362
In the present study no attempt was made to differentiate live from dead roots in the sampled 363
material. Therefore the analyzed material is a mixture of roots differing in age and state. 364
Nevertheless based on this coarse dataset it seems clear that net N remobilization from roots 365
during the post-flowering period in wheat grown in the field is a marginal process. First, N 366
concentration in the sampled root materials did not vary between anthesis and maturity (Table 367
3). Comparatively, other vegetative organs are a net source of N for the developing grain and 368
remobilize about 70% of the N present at anthesis (e.g. Gaju et al., 2011). The remobilization 369
pattern of these vegetative organs follows a robust first-order kinetics independent of organ 370
age, genotype and N nutrition (Bertheloot et al., 2008). Second, the estimated potential N 371
remobilization from dead roots represents less than 3% of the total grain N at maturity. Our 372
estimate of remobilized N is in addition probably overestimated since past studies focusing 373
specifically on nutrient remobilization from dying fine roots tended to show that N 374
concentration did not vary between live and dead roots material implying little if no N re-375
translocation from senescing roots (Gordon and Jackson, 2008). Based on an experiment in 376
hydroponic conditions, Andersson and Johansson (2006) observed that N amount in the root 377
at maturity was 10-20% of total plant N thus potentially affecting NUE calculations. Here we 378
clearly show that under field conditions N amount in the roots is about 4% of total plant N 379
and affects only marginally calculated variables such as NHI or NutE with in particular no 380
effect on genotype ranking for these variables. In addition no correlation between root N 381
concentration or estimated amount of N remobilized from roots and agronomic variables of 382
interest were found. Quantitatively speaking, the amount of N potentially remobilized from 383
roots, in spite of its probable over estimation in the present study cannot affect significantly 384
the amount of N in the grain. Clearly, the observed genetic variation for grain N content is not 385
likely to be determined by variations in the root N pool. 386
387
5. Conclusions
388
This experiment provided strong indications that the apparent genetic variability existing for 389
wheat root biomass and allocation is driven by crop growth pattern rather than root growth 390
variability per se. Similarly, root loss during the post-anthesis period appeared to be largely 391
driven by root biomass at anthesis. More generally root biomass dynamics seems to be 392
determined to great extent by the crop status at anthesis. There seems to be little prospect for a 393
further exploration of root biomass genetic variability that is independent of crop response. 394
Given the relatively small proportion of N in the roots and the apparent low N remobilization 395
from this pool to the grain, taking into account roots in the determination of N related traits 396
such as NUE appears of little interest. In particular, genotype ranking for this trait is not 397
affected by the accounting or not of this generally ignored N compartment. Of course, root 398
architectural traits such as total root length and root vertical distribution may be of major 399
importance for crop N, water acquisition and adaptation. Observed genetic variability for 400
such traits may be strong determinants of wheat genotypes performance in particular in 401
limited environment (Manshadi et al., 2010), but this was beyond the scope of the present 402
study. 403
405
Acknowledgements
406
Bernard Bonnemoy build the soil corer and did all soil sampling and root washing. Joelle 407
Messaoud did all plant sampling, biometric measurements and elemental analysis. The 408
authors also want to thank Nicole Allard for her technical participation to this experiment. 409
410
References
411
Ågren, G.I., and Franklin, O., 2003. Root : Shoot Ratios, Optimization and Nitrogen 412
Productivity. Ann.Bot. 92, 795 -800. 413
Andersson, A., and Johansson, E., 2006. Nitrogen Partitioning in Entire Plants of Different 414
Spring Wheat Cultivars. J. Agron. Crop Sci. 192, 121-131. 415
Andersson, A., Johansson, E., and Oscarson, P., 2005. Nitrogen redistribution from the roots 416
in post-anthesis plants of spring wheat. Plant Soil 269, 321-332. 417
Barbottin, A., Lecomte, C., Bouchard, C., and Jeuffroy, M.-H., 2005. Nitrogen 418
Remobilization during Grain Filling in Wheat. Crop Sci. 45, 1141. 419
Bertheloot, J., Martre, P., and Andrieu, B., 2008. Dynamics of Light and Nitrogen 420
Distribution during Grain Filling within Wheat Canopy. Plant Physiol.148, 1707-421
1720. 422
Borrell, A., Hammer, G., and van Oosterom, E., 2001. Stay-green: A consequence of the 423
balance between supply and demand for nitrogen during grain filling? Ann. Appl. 424
Biol. 138, 91-95. 425
Cui, Z., Zhang, F., Chen, X., Li, F., and Tong, Y., 2011. Using In-Season Nitrogen 426
Management and Wheat Cultivars to Improve Nitrogen Use Efficiency. Soil Sci. 427
Soc. Am. J. 75, 976. 428
DECC, 2010. Agriculture GHG inventory summary factsheet. 429
Duggan, B.L., Richards, R.A., Van Herwaarden, A.F., and Fettell, N.A., Agronomic 430
evaluation of a tiller inhibition gene (tin) in wheat. I. Effect on yield, yield 431
components, and grain protein. Aust. J. Agric. Res. 56, 169-178. 432
Eissenstat, D.M., Wells, C.E., Yanai, R.D., and Whitbeck, J.L., 2000. Building roots in a 433
changing environment: implications for root longevity. New Phytol. 147, 33-42. 434
Eissenstat, D.M., and Yanai, R.D., 1997. The Ecology of Root Lifespan. Adv. Ecol. Res. 27, 435
2-60. 436
Gaju, O., Allard, V., Martre, P., Snape, J.W., Heumez, E., LeGouis, J., Moreau, D., Bogard, 437
M., Griffiths, S., Orford, S., et al., 2011. Identification of traits to improve the 438
nitrogen-use efficiency of wheat genotypes. Field Crops Res. 123, 139-152. 439
Gastal, F., and Lemaire, G., 2002. N uptake and distribution in crops: an agronomical and 440
ecophysiological perspective. J. Exp. Bot. 53, 789-799. 441
Gleeson, S.K., 1993. Optimization of Tissue Nitrogen and Root-Shoot Allocation. Ann. Bot. 442
71, 23 -31. 443
Gordon, W.S., and Jackson, R.B., 2000. Nutrient Concentrations in Fine Roots. Ecology 81, 444
275-280. 445
Le Gouis, J., Béghin, D., Heumez, E., and Pluchard, P., 2000. Genetic differences for nitrogen 446
uptake and nitrogen utilisation efficiencies in winter wheat. Eur. J. Agron. 12, 163-447
173. 448
Gregersen, P.L., Holm, P.B., and Krupinska, K., 2008. Leaf senescence and nutrient 449
remobilisation in barley and wheat. Plant Biol. 10, 37-49. 450
Hilbert, D.W., 1990. Optimization of Plant Root: Shoot Ratios and Internal Nitrogen 451
Concentration. Ann. Bot. 66, 91 -99. 452
Hirel, B., Le Gouis, J., Ney, B., and Gallais, A., 2007. The challenge of improving nitrogen 453
use efficiency in crop plants: towards a more central role for genetic variability 454
and quantitative genetics within integrated approaches. J. Exp.Bot. 58, 2369 -2387. 455
Hoad, S.P., Russell, G., Lucas, M.E., and Bingham, I.J., 2001. The management of wheat, 456
barley, and oat root systems. Adv. Agron. 74, 193-246. 457
IPCC, 2001: Climate Change 2001: The Scientific Basis. Contribution of Working Group I to 458
the Third Assessment Report of the Intergovernmental Panel on Climate Change 459
[Houghton, J.T., Ding, Y., Griggs, D.J. , Noguer, M., van der Linden, P.J., Dai, X., 460
Maskell, K. and C.A. Johnson (Eds.)]. Cambridge University Press, Cambridge, 461
United Kingdom and New York, NY, USA, 881pp. 462
Justes, E., Mary, B., Meynard, J.-M., Machet, J.-M., and Thelier-Huche, L., 1994. 463
Determination of a Critical Nitrogen Dilution Curve for Winter Wheat Crops. 464
Ann. Bot. 74, 397-407. 465
Kätterer, T., Hansson, A.-C., and Andrén, O., 1993. Wheat root biomass and nitrogen 466
dynamics—effects of daily irrigation and fertilization. Plant Soil 151, 21-30. 467
Kichey, T., Hirel, B., Heumez, E., Dubois, F., and Le Gouis, J., 2007. In winter wheat 468
(Triticum aestivum L.), post-anthesis nitrogen uptake and remobilisation to the 469
grain correlates with agronomic traits and nitrogen physiological markers. Field 470
Crops Res. 102, 22-32. 471
Klepper, B., Belford, R.K., and Rickman, R.W., 1984. Root and Shoot Development in 472
Winter Wheat. Agron. J. 76, 117. 473
Lawless, C., Semenov, M.A., and Jamieson, P.D., 2005. A wheat canopy model linking leaf 474
area and phenology. Eur. J. Agron. 22, 19-32. 475
Manschadi, A.M., Christopher, J.T., Hammer, G.L., Devoil, P., 2010. Experimental and 476
modelling studies of drought-adaptive root architectural traits in wheat (Triticum 477
aestivum L.). Plant Biosystems 144, 458–462. 478
Matthew, C., 1996. Seasonal patterns of root, tiller and leaf production in a Grasslands 479
Ruanui ryegrass sward. In Proceedings of the New Zealand Grassland Association, 480
pp. 73-76. 481
Mitchell, J.H., Chapman, S.C., Rebetzke, G.J., Bonnett, D.G., Fukai, S., 2012. Evaluation of a 482
reduced-tillering (tin) gene in wheat lines grown across different production 483
environments. Crop. Pasture Sci. 63, 128-141. 484
Munns, R., and Richards, R.A., Recent Advances in Breeding Wheat for Drought and Salt 485
Stresses, in: Jenks, M.A. , Hasegawa, P.M., S.M. Jain (Eds.), Advances in 486
Molecular Breeding Toward Drought and Salt Tolerant Crops, Springer 487
Netherlands, Dordrecht, pp. 565-585. 488
Oury F.X., Berard P., Brancourt-Hulmel M., Depatureaux C., Doussinault G., Galic N., 489
Giraud A., Heumez E., Lecomte C., Pluchard P., Rolland B., Rousset M. and 490
Trottet M. – Yield and grain protein concentration in bread wheat: a review and a 491
study of multi-annual data from a French breeding program [Triticum aestivum 492
L.]. J. Gen. Breed. 57, 59-68.
493
Oury, F.-X., Chiron, H., Faye, A., Gardet, O., Giraud, A., Heumez, E., Rolland, B., Rousset, 494
M., Trottet, M., Charmet, G., et al., 2009. The prediction of bread wheat quality: 495
joint use of the phenotypic information brought by technological tests and the 496
genetic information brought by HMW and LMW glutenin subunits. Euphytica 497
171, 87-109. 498
Palta, J.A., Fillery, I.R.P., and Rebetzke, G.J., 2007. Restricted-tillering wheat does not lead 499
to greater investment in roots and early nitrogen uptake. Field Crops Res.104, 52-500
59. 501
Peoples, M.B., Dalling, M.S., 1988. The interplay between proteolysis and amino acid 502
metabolism during senescence and nitrogen reallocation, in Nodden, L.D., 503
Leopold, A.C. (Eds.), Senescence and Aging in Plants. Academic Press, New 504
York, pp. 182–217. 505
Rémi, J., and Hébert, J., 1977. Le devenir des engrais dans le sol. Compte Rendu De 506
l’Académie d’Agriculture De France 63, 700-710. 507
Reynolds, M., Foulkes, M.J., Slafer, G.A., Berry, P., Parry, M.A.J., Snape, J.W., and Angus, 508
W.J., 2009. Raising yield potential in wheat. J. Exp. Bot. 60, 1899 -1918. 509
Rickman, R.W., Klepper, B., and Belford, R.K., 1984. Root and Shoot Development in 510
Winter Wheat. Agron. J. 76, 117-122. 511
Shewry, P.R., 2007. Improving the protein content and composition of cereal grain. J. Cereal 512
Sci. 46, 239-250. 513
Siddique, K.H.M., Belford, R.K., and Tennant, D., 1990. Root:shoot ratios of old and modern, 514
tall and semi-dwarf wheats in a mediterranean environment. Plant Soil 121, 89-98. 515
Sinclair, T.R., and Jamieson, P.D., 2008. Yield and grain number of wheat: A correlation or 516
causal relationship?: Authors’ response to ―The importance of grain or kernel 517
number in wheat: A reply to Sinclair and Jamieson‖ by R.A. Fischer. Field Crops 518
Res. 105, 22-26. 519
Taylor, L., Nunes‐ Nesi, A., Parsley, K., Leiss, A., Leach, G., Coates, S., Wingler, A., Fernie, 520
A.R., and Hibberd, J.M., 2010. Cytosolic pyruvate,orthophosphate dikinase 521
functions in nitrogen remobilization during leaf senescence and limits individual 522
seed growth and nitrogen content. Plant J. 62, 641-652. 523
Thornley, J.H.M., 1995. Shoot: Root Allocation with Respect to C, N and P: an Investigation 524
and Comparison of Resistance and Teleonomic Models. Ann. Bot. 75, 391 - 405. 525
Triboi, E., Martre, P., Girousse, C., Ravel, C., and Triboi-Blondel, A.-M., 2006. Unravelling 526
environmental and genetic relationships between grain yield and nitrogen 527
concentration for wheat. Eur. J. Agron. 25, 108-118. 528
Triboi, E., and Triboi-Blondel, A.-M., 2002. Productivity and grain or seed composition: a 529
new approach to an old problem—invited paper. Eur. J. Agron. 16, 163-186. 530
Uauy, C., Brevis, J.C., and Dubcovsky, J., 2006. The high grain protein content gene Gpc-B1 531
accelerates senescence and has pleiotropic effects on protein content in wheat. J. 532
Exp. Bot. 57, 2785-2794. 533
Wechsung, G., Wechsung, F., Wall, G.W., Adamsen, F.J., Kimball, B.A., Pinter JR., P.J., 534
Lamorte, R.L., Garcia, R.L., and Kartschall, T., 1999. The effects of free-air CO2 535
enrichment and soil water availability on spatial and seasonal patterns of wheat 536
root growth. Global Change Biol. 5, 519-529. 537
Xue, Q., Zhu, Z., Musick, J.T., Stewart, B.A., and Dusek, D.A., 2003. Root growth and water 538
uptake in winter wheat under deficit irrigation. Plant Soil 257, 151-161. 539
Zadoks, J.C., Chang, T.T., and Konzak, C.F., 1974. A decimal code for the growth stages of 540
cereals. Weed Res. 14, 415-421. 541
. 542 543
Figures captions
544
Figure 1: Monthly mean temperatures during the growing season (closed circles) and
545
averaged over the 1990-2008 period (open circles), monthly cumulative rainfall during the 546
growing season (grey bars) and averaged over the 1990-2008 period (open dashed bars) at 547
Clermont-Ferrand. The letters indicate sowing (S), nitrogen applications for the HN and LN 548
treatments, and the periods covering the flowering (F) and the maturity (M) samplings. 549
550
Figure 2: Relations between tiller density and (A) root dry mass or (B) shoot dry mass at
551
anthesis under LN (open circles) and HN full black circles) treatments. Numbers between 1 552
and 16 refer to genotype code (see table 2). 553
554
Figure 3: Relation between (A) crop nitrogen nutrition index (NNI), (B) tiller density at
555
anthesis and Root to shoot ratio at anthesis (R/S) under LN (open circles) and HN full black 556
circles) treatments. Numbers between 1 and 16 refer to genotype code (see table 2). 557
558
Figure 4 : Relation between belowground dry mass at anthesis and below ground dry mass
559
variation between anthesis and maturity under LN (open circles) and HN full black circles) 560
treatments. Numbers between 1 and 16 refers to genotype code (see table 2). 561 562 563 564 565 566 567 568
569 R ainf all (m m m ont h -1 ) 0 20 40 60 80 100 120 140 M ont hly m ean tem peratu re (°C) -10 -5 0 5 10 15 20 25
Sep Oct Nov Dec Jan Feb Mar Apr May Jun Jul Aug
2007 2008 S N+ N-N+ N-N+ N+ F M 570 Figure 1 571
R oot D M at ant hesis ( g D M m -2 ) 100 150 200 250 300 1 2 3 4 5 6 7 8 9 10 11 12 13 14 15 16 1 2 3 4 5 6 7 8 9 10 11 12 13 14 15 16 R²=0.52 R² = 0.42 B
Tillers number at anthesis (tillers m-2)
300 400 500 600 700 800 900 S hoot D M at ant hesis ( g D M m -2 ) 600 700 800 900 1000 1100 1200 1 2 3 4 5 6 7 8 9 10 11 12 13 14 15 16 1 2 3 4 5 6 7 8 9 10 11 12 13 14 15 16 A R² = 0 R²=0.02 572 Figure 2 573 574
575 576
Tiller number at anthesis (tillers m-2)
300 400 500 600 700 800 900 1 2 3 4 5 6 7 8 9 1011 12 13 14 15 16 1 2 3 4 5 6 7 8 9 10 11 12 13 14 15 16 R² = 0.21 R² = 0.42 B A NNI 0.0 0.2 0.4 0.6 0.8 1.0 1.2 R /S 0.10 0.15 0.20 0.25 0.30 0.35 1 2 3 4 5 6 7 8 9 10 11 12 13 14 15 16 1 2 3 4 5 6 7 8 9 10 11 12 13 14 15 16 R² = 0.43 R² = 0.02 577 Figure 3 578
579 580 Belowground DM at anthesis (g DM m-2) 100 150 200 250 300 Be low g rou nd DM v ar iati on betw ee n an thesi s an d mat ur ity ( % ) -60 -50 -40 -30 -20 -10 0 1 2 3 4 5 6 7 8 9 10 11 12 13 14 15 16 1 2 3 4 5 6 7 8 9 10 11 12 13 14 15 16 R²=0.38 R²=0.67 581 Figure 4 582 583 584
Tables
585 586
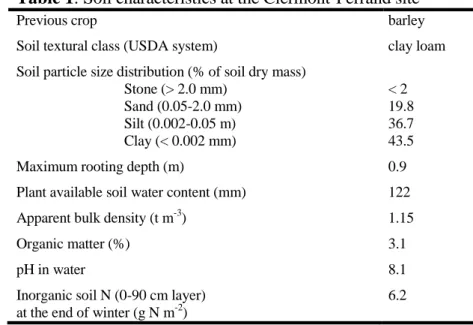
Table 1: Soil characteristics at the Clermont-Ferrand site
587
Previous crop barley
Soil textural class (USDA system) clay loam Soil particle size distribution (% of soil dry mass)
Stone (> 2.0 mm) < 2
Sand (0.05-2.0 mm) 19.8
Silt (0.002-0.05 m) 36.7
Clay (< 0.002 mm) 43.5
Maximum rooting depth (m) 0.9
Plant available soil water content (mm) 122
Apparent bulk density (t m-3) 1.15
Organic matter (%) 3.1
pH in water 8.1
Inorganic soil N (0-90 cm layer) at the end of winter (g N m-2)
6.2
Table 2: Anthesis date, root dry mass (RDM), shoot dry mass (SDM) and grain dry mass
(GDM) at anthesis and grain maturity. Data are means of three replicates. Means for the LN and HN treatments are calculated. P values were obtained with a split plot ANOVA.
Genotype Anthesis Maturity
Treatment Name Code Anthesis
Date RDM SDM RDM SDM GDM g DM m-2 g DM m-2 g DM m-2 g DM m-2 g DM m-2 LN Alchemy 1 03/06/08 183 750 122 1118 499 Beaver 2 04/06/08 207 799 128 1278 590 Consort 3 04/06/08 203 756 104 1037 493 Paragon 4 02/06/08 184 845 131 1152 482 Rialto 5 30/05/08 176 697 121 1054 480 Robigus 6 02/06/08 212 735 155 1327 618 Savannah 7 03/06/08 185 816 126 1234 592 Soissons 8 20/05/08 176 890 150 1066 479 Arche 9 26/05/08 158 906 104 1411 680 CF9107 10 22/05/08 146 795 111 1099 516 CF99102 11 26/05/08 135 725 127 1377 624 Perfector 12 28/05/08 229 773 124 1248 595 Quebon 13 29/05/08 184 788 109 1344 583 Récital 14 19/05/08 191 962 163 1074 464 Renan 15 21/05/08 181 1039 136 1260 505 Toisondor 16 27/05/08 186 789 123 1331 649 Mean LN 184 817 127 1213 553 HN Alchemy 1 03/06/08 192 924 132 1422 633 Beaver 2 04/06/08 243 1026 127 1719 803 Consort 3 04/06/08 186 1040 143 1750 846 Paragon 4 02/06/08 181 957 158 1736 702 Rialto 5 30/05/08 214 868 153 1543 730 Robigus 6 02/06/08 196 925 138 1883 898 Savannah 7 03/06/08 245 956 133 1705 797 Soissons 8 20/05/08 261 961 122 1491 746 Arche 9 26/05/08 167 875 126 1704 787 CF9107 10 22/05/08 162 984 110 1435 734 CF99102 11 26/05/08 159 920 119 1666 794 Perfector 12 28/05/08 204 971 136 1827 847 Quebon 13 29/05/08 165 958 157 1638 739 Récital 14 19/05/08 190 1003 142 1270 614 Renan 15 21/05/08 196 1069 130 1581 708 Toisondor 16 27/05/08 189 975 134 1679 812 Mean HN 197 963 135 1628 762 Source of variance Treatment 0.248 0.005** 0.123 0.019* 0.014* Genotype 0.001** 0.019* 0.397 0.010* <0.001*** TxG 0.251 0.425 0.464 0.865 0.886
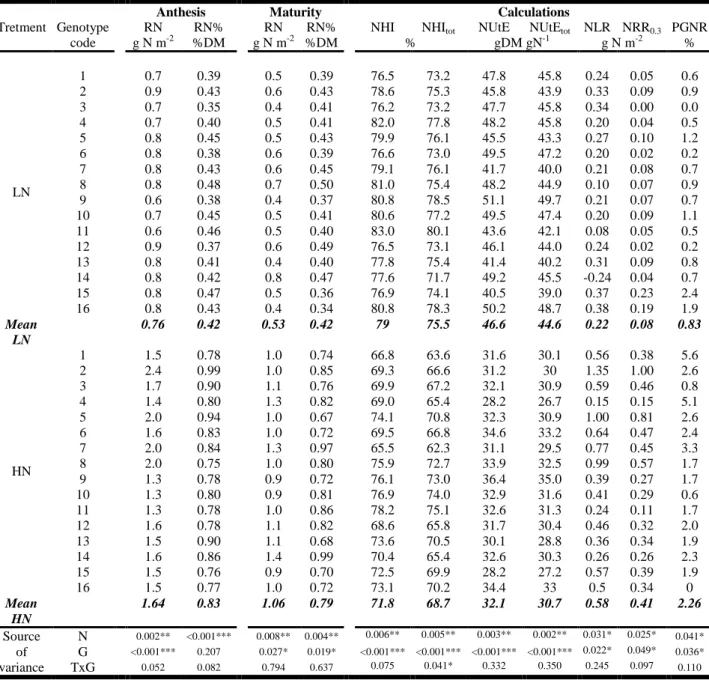
Table 3: root N amount (RN), root N concentration (RN%) at anthesis and grain maturity.
Calculated variables are nitrogen harvest index based on shoot N only (NHI) or total plant N (NHItot), N utilization efficiency based on shoot N only (NUtE) or total plant N (NUtEtot), N
lost from root between anthesis and maturity (NLR), N potentially remobilized by roots assuming 0.3% N in the dead roots (NRR0.3) and the proportion of grain N originating from
roots (PGNR). Data are means of three replicates. Means for the LN and HN treatments are calculated. P values were obtained with a split plot ANOVA.
Anthesis Maturity Calculations
Tretment Genotype RN RN% RN RN% NHI NHItot NUtE NUtEtot NLR NRR0.3 PGNR code g N m-2 %DM g N m-2 %DM % gDM gN-1 g N m-2 % LN 1 0.7 0.39 0.5 0.39 76.5 73.2 47.8 45.8 0.24 0.05 0.6 2 0.9 0.43 0.6 0.43 78.6 75.3 45.8 43.9 0.33 0.09 0.9 3 0.7 0.35 0.4 0.41 76.2 73.2 47.7 45.8 0.34 0.00 0.0 4 0.7 0.40 0.5 0.41 82.0 77.8 48.2 45.8 0.20 0.04 0.5 5 0.8 0.45 0.5 0.43 79.9 76.1 45.5 43.3 0.27 0.10 1.2 6 0.8 0.38 0.6 0.39 76.6 73.0 49.5 47.2 0.20 0.02 0.2 7 0.8 0.43 0.6 0.45 79.1 76.1 41.7 40.0 0.21 0.08 0.7 8 0.8 0.48 0.7 0.50 81.0 75.4 48.2 44.9 0.10 0.07 0.9 9 0.6 0.38 0.4 0.37 80.8 78.5 51.1 49.7 0.21 0.07 0.7 10 0.7 0.45 0.5 0.41 80.6 77.2 49.5 47.4 0.20 0.09 1.1 11 0.6 0.46 0.5 0.40 83.0 80.1 43.6 42.1 0.08 0.05 0.5 12 0.9 0.37 0.6 0.49 76.5 73.1 46.1 44.0 0.24 0.02 0.2 13 0.8 0.41 0.4 0.40 77.8 75.4 41.4 40.2 0.31 0.09 0.8 14 0.8 0.42 0.8 0.47 77.6 71.7 49.2 45.5 -0.24 0.04 0.7 15 0.8 0.47 0.5 0.36 76.9 74.1 40.5 39.0 0.37 0.23 2.4 16 0.8 0.43 0.4 0.34 80.8 78.3 50.2 48.7 0.38 0.19 1.9 Mean LN 0.76 0.42 0.53 0.42 79 75.5 46.6 44.6 0.22 0.08 0.83 HN 1 1.5 0.78 1.0 0.74 66.8 63.6 31.6 30.1 0.56 0.38 5.6 2 2.4 0.99 1.0 0.85 69.3 66.6 31.2 30 1.35 1.00 2.6 3 1.7 0.90 1.1 0.76 69.9 67.2 32.1 30.9 0.59 0.46 0.8 4 1.4 0.80 1.3 0.82 69.0 65.4 28.2 26.7 0.15 0.15 5.1 5 2.0 0.94 1.0 0.67 74.1 70.8 32.3 30.9 1.00 0.81 2.6 6 1.6 0.83 1.0 0.72 69.5 66.8 34.6 33.2 0.64 0.47 2.4 7 2.0 0.84 1.3 0.97 65.5 62.3 31.1 29.5 0.77 0.45 3.3 8 2.0 0.75 1.0 0.80 75.9 72.7 33.9 32.5 0.99 0.57 1.7 9 1.3 0.78 0.9 0.72 76.1 73.0 36.4 35.0 0.39 0.27 1.7 10 1.3 0.80 0.9 0.81 76.9 74.0 32.9 31.6 0.41 0.29 0.6 11 1.3 0.78 1.0 0.86 78.2 75.1 32.6 31.3 0.24 0.11 1.7 12 1.6 0.78 1.1 0.82 68.6 65.8 31.7 30.4 0.46 0.32 2.0 13 1.5 0.90 1.1 0.68 73.6 70.5 30.1 28.8 0.36 0.34 1.9 14 1.6 0.86 1.4 0.99 70.4 65.4 32.6 30.3 0.26 0.26 2.3 15 1.5 0.76 0.9 0.70 72.5 69.9 28.2 27.2 0.57 0.39 1.9 16 1.5 0.77 1.0 0.72 73.1 70.2 34.4 33 0.5 0.34 0 Mean HN 1.64 0.83 1.06 0.79 71.8 68.7 32.1 30.7 0.58 0.41 2.26 Source of variance N 0.002** <0.001*** 0.008** 0.004** 0.006** 0.005** 0.003** 0.002** 0.031* 0.025* 0.041* G <0.001*** 0.207 0.027* 0.019* <0.001*** <0.001*** <0.001*** <0.001*** 0.022* 0.049* 0.036* TxG 0.052 0.082 0.794 0.637 0.075 0.041* 0.332 0.350 0.245 0.097 0.110