W
ORKING
P
APERS
SES
F
A C U L T É D E SS
C I E N C E SE
C O N O M I Q U E S E TS
O C I A L E SW
I R T S C H A F T S-
U N DS
O Z I A L W I S S E N S C H A F T L I C H EF
A K U LT Ä TU
N I V E R S I T É D EF
R I B O U R G| U
N I V E R S I T Ä TF
R E I B U R G12.2012
N° 439
Value Relevance of the Fair Value
Hierarchy of IFRS 7 in Europe -
How reliable are mark-to-model
Fair Values?
Value Relevance of the Fair Value Hierarchy of IFRS 7 in
Europe –How reliable are mark-to-model Fair Values?
Patrick Bosch
Abstract
According to IFRS 7, banks have to disclose the inputs used in measuring the fair value of …nancial instruments. For this purpose the standard de…nes a three-level measurement hierarchy. The reliability of fair values is expected to decrease with decreasing hierarchy level due to the lower quality of the input factors. Using a value relevance research setting, I …nd that investors perceive the reliability of level 3 fair values as signi…cantly lower than the reliability of level 1 fair values. However, in contrast to expectations, level 2 fair values are not perceived as less reliable. Thus, investors only doubt the reliability of fair values whose inputs are based on discretionary assumptions. Additionally, this paper analyses the impact of the reclassi…cation of …nancial assets and of the regulatory capital ratio on the reliability of fair values. While I …nd a weakly signi…cant impact of the regulatory capital ratio, the reclassi…cation has in general no in‡uence on the reliability of reported fair values.
Keywords: Fair Value Hierarchy, Reclassi…cation, Reliability, Value Relevance JEL Classi…cation: C23, G14, G21, M41
Patrick Bosch, Chair of Finance and Accounting, University of Fribourg / Switzerland, Bd. de Pérolles 90, CH-1700 Fribourg, Tel.: +41 26 300 8289, Fax: +41 26 300 9659, Email: [email protected].
1 Introduction 2
1
Introduction
Fair value accounting has been one of the most controversial issues in …nancial reporting over the last 20 years. Proponents argue that full fair value accounting (FFVA) improves market discipline and reveals risks from maturity transformation and changes in credit risks earlier than historic cost accounting. Thus, it can reduce the procyclicality of the …nancial system. Opponents, on the other hand, argue that FFVA increases earnings and equity volatility, reduces the resilience of …nancial institutions against …nancial shocks, and lacks reliability when markets are inactive and valuation models have to be used to measure fair values (e.g. Enria et al. (2004)). Nevertheless, the International Accounting Standards Board (IASB) continually expanded the application of fair values in IFRS.1
During the …nancial crisis, the debate about fair value accounting, especially for …nancial in-struments, gained momentum (see for a broad discussion Laux and Leuz (2009)). Fair value accounting was again criticized for being unreliable. The reliability of fair values has been widely discussed before in the value relevance research (e.g. Barth (1994), Barth et al. (1996), Nelson (1996)). This research can be seen as an instrument to operationalize IASB’s most important qualitative characteristics of decision useful accounting information, relevance and reliability (Barth et al. (2001)).2 While fair values undoubtedly possess relevance for economic decision making, a lack of reliability can diminish the value relevance of fair values signi…cantly. A vast majority of value relevance studies …nds evidence that fair values are overall value relevant and have incremental explanatory power in comparison to historic cost measures. Nonetheless, several studies show that fair values of illiquid …nancial instruments are signi…cantly less value relevant than fair values of liquid …nancial instruments (e.g. Petroni and Wahlen (1995), Ec-cher et al. (1996)). Accordingly, illiquid …nancial instruments are perceived as less reliable by investors. Since market illiquidity was one of the major problems during the subprime crisis, this supports the current criticism of fair value accounting for …nancial instruments.
1
Some observes even supposed that the IASB was following a hidden agenda to introduce FFVA. See e.g. Whittington (2008).
2 In the new Conceptual Framework the IASB replaces reliability by faithful representation. However, Barth
(2007) argues that the new term is just a more accurate speci…cation of reliability. Hence, I will use the term reliability instead of faithful representation throughout this paper.
1 Introduction 3
The IASB reacted to the reliability issue and increased the disclosure requirements concerning the fair value measurement of …nancial instruments by amending IFRS 7 Financial Instruments: Disclosures. Entities applying IFRS now have to disclose …nancial instruments measured at fair value by using a three-level hierarchy. The levels of this fair value hierarchy are based on the quality of the input factors used in the measurement process. Level 1 inputs are quoted prices in active markets, level 2 inputs include all observable data other than quoted prices, and level 3 inputs comprise all non-observable data. This fair value hierarchy is equivalent to the hierarchy of SFAS 157 (now Topic 820), albeit limited to …nancial instruments, and anticipates the disclosure requirements established in IFRS 13 Fair Value Measurement. Any measurement based on inputs of the …rst level of this hierarchy is also labelled as mark-to-market, while fair value measurement based on inputs of lower levels is called mark-to-model, which Warren Bu¤ett famously denounced as mark-to-myth (Bu¤ett (2003)). Even though he said that mark-to-model only in rare cases declines to a mark-to-myth, it can clearly be stated that the reliability of fair values is decreasing with a decreasing measurement level. The reduced reliability of level 2 and level 3 fair values arises from two factors. First, model-based fair values can be biased due to unintentional measurement errors. Second, management can deliberately use discretion in fair value measurement for earnings management. Thus, fair values based on mark-to-model might be noisy measures of the “true” value. Goh et al. (2009), Kolev (2008), and Song et al. (2010) investigate the value relevance of this fair value hierarchy for the U.S. market. They show that fair values of all hierarchy levels are value relevant. However, as expected, fair values based on level 2 or 3 inputs are signi…cantly less value relevant than fair values based on quoted prices. Another concern about fair value accounting for …nancial instruments was its procyclical e¤ect on the …nancial sector. This e¤ect occurs when banks adjust their balance sheet structures following asset price changes (e.g. Plantin et al. (2008)). If prices of assets which are marked to market decrease, leverage ratios increase, and regulatory capital requirements can necessitate banks to sell assets to reduce their leverage. These asset sales might further depress asset prices. Therefore, European politicians pressed the IASB during the …nancial crisis to relax fair value accounting for …nancial instruments by allowing banks to reclassify their …nancial assets measured at fair value to categories which require amortized cost measurement. The IASB conceded and created new reclassi…cation options by amending IAS 39 Financial Instruments:
1 Introduction 4
Recognition and Measurement. Studies of Bischof et al. (2010) and Kholmy and Ernstberger (2010) analyze which intentions banks pursued by reclassifying …nancial assets. Bischof et al. (2010) …nd that banks reclassi…ed …nancial assets to avoid a violation of regulatory capital requirements. Kholmy and Ernstberger (2010) analyze additionally whether pro…tability might have had an impact on reclassi…cation decisions. The authors conclude that banks use the new reclassi…cation options for general earnings management.
This study focusses on the …rst concern about fair values, i.e. the lack of reliability. Therefore, the fair value hierarchy for …nancial instruments is examined in a value relevance research setting similar to Song et al. (2010). However, it extends the existing literature (Goh et al. (2009), Kolev (2008), Song et al. (2010)) by analyzing, for the …rst time, the value relevance and the reliability of the IFRS 7 fair value hierarchy based on the …nancial data of European banks. Furthermore, this study covers a longer time period than prior studies. While Goh et al. (2009), Kolev (2008), and Song et al. (2010) focus on data from 2008, I use …nancial data from 2006 to 2010. The results show that fair values of all measurement levels are value relevant. Further, level 3 fair values are signi…cantly less reliable than level 1 or level 2 fair values. In a next step, the study analyzes the impact of regulatory capital and of reclassi…cation decisions on the reliability of mark-to-model fair values. In contrast to the results of Goh et al. (2009), it can be shown that the regulatory capital ratio has no signi…cant in‡uence on the reliability of level 3 fair values. Additionally, notwithstanding the results of Bischof et al. (2010) and Kholmy and Ernstberger (2010) that banks use the new reclassi…cation option for earnings management and to avoid violating regulatory requirements, capital markets do not perceive mark-to-model fair values of reclassifying banks as less reliable than fair values of non-reclassifying banks.
In the next Section the institutional background, i.e. the relevant accounting standards, is discussed. Section 3 summarizes the related literature and discusses the contribution of this study. Section 4 contains the empirical investigation, including sample selection, hypotheses development, empirical modelling, and results. Section 5 concludes.
2 Institutional Background 5
2
Institutional Background
I will refer to IAS 39 and IFRS 7 throughout this study without considering IFRS 9 and IFRS 13. IFRS 9 Financial Instruments and IFRS 13 Fair Value Measurement, which were issued in 2009 and 2011 respectively, have amended both IAS 39 and IFRS 7. While IFRS 13 was not applicable during the sample period, the IASB would have allowed an early voluntary application of IFRS 9 starting with November 2009. However, the European Commission has not endorsed the new standard until today. Therefore, the sample banks could not apply the new accounting standards during the sample period.
2.1 IFRS 7 - Fair Value Hierarchy
IAS 39.9 de…nes fair value as “the amount for which an asset could be exchanged, or a liabil-ity settled, between knowledgeable, willing parties in an arm’s length transaction.” From this de…nition follows that the fair value is a measure which is closely related to the market value. Yet, it cannot be assumed that fair and market values are identical in all cases, because fair values can be based on valuation models. IAS 39 de…nes a hierarchy for the measurement of fair values of …nancial instruments. The quoted market price of a …nancial instrument is always the best estimate for the fair value if an active market exists. However, if there is no active market, entities have to use established valuation approaches to measure the fair value of a …nancial instrument. In this case, the reliability of the fair value deteriorates because of two reasons. First, the model-based valuation might include an undeliberate measurement error. Second, entities could use the discretion in valuation models to manage earnings. Hence, mark-to-model fair values might be noisy measures of the “true”values. For …nancial markets it is thus vital to get information about the fair value hierarchy because accounting information has to be both relevant and reliable to be useful for decision making. While markets usually do not doubt the relevance of fair values for the decision making process, the reliability of fair values became more important at the climax of the last …nancial crisis. Although IFRS 7 required some disclosures regarding the measurement of fair values prior to 2009, entities did not have to disclose sep-arately which amount of …nancial instruments measured at fair value was based on valuation models.
2.2 IAS 39 - Reclassi…cation of Financial Instruments 6
Eventually, the IASB reacted to the information needs of capital market participants and amended IFRS 7 in March 2009 (IASB (2009)). This amendment implemented an input-based measurement hierarchy for …nancial instruments (IFRS 7.27A). There are three levels of inputs:
Level 1: Quoted market prices of identical …nancial instruments. Level 2: Inputs based on observable market data.
Level 3: Inputs not based on observable market data.
Entities have to classify their …nancial instruments measured at fair values according to this input hierarchy. The level of a fair value is determined by the lowest level of signi…cant inputs used in the valuation process. The amendment does not only de…ne this fair value hierarchy but adds several quantitative disclosure requirements regarding the fair value measurement (IFRS 7.27B). For example, entities have to disclose signi…cant transfers between di¤erent measurement levels and a reconciliation from the opening balance to the closing balance for level 3 fair values. But most important for this study, entities have to make quantitative disclosures regarding the fair values measured at the di¤erent levels of the fair value hierarchy.
When it adopted this fair value hierarchy for …nancial instruments, the IASB clearly followed SFAS 157 (now Topic 820) and anticipated the results of the Fair Value Measurement Project (IFRS 13). However, this “new” measurement hierarchy can rather be seen as a further speci-…cation of the hierarchy de…ned in IAS 39 and, accordingly, fair values based on level 2 and 3 inputs should su¤er from a reduced reliability.
2.2 IAS 39 - Reclassi…cation of Financial Instruments
The second major issue regarding fair value accounting during the …nancial crisis was the reclas-si…cation of …nancial instruments. Generally, in IFRS, similar to US-GAAP, the measurement of …nancial instruments is determined by a classi…cation of these instruments at initial recognition in one of …ve categories. While the categories “at fair value through pro…t or loss” (AFV) and “available for sale”(AFS) require a measurement at fair value, the categories “held to maturity” (HTM), “loans and receivables” (LAR), and “other liabilities” (OL) demand a measurement at amortized costs. Prior to the amendment to IAS 39 and IFRS 7 from October 2008 (IASB
2.2 IAS 39 - Reclassi…cation of Financial Instruments 7
(2008)), the reclassi…cation options were very limited. An entity could only reclassify …nancial instruments, without facing sanctions, from the category AFS to the category HTM. In addition, entities could reclassify …nancial instruments from the category HTM to the category AFS, but would face sanctions if reclassifying more than an insigni…cant amount. The IASB’s intention behind these very limited reclassi…cation options was to restrain earnings management. Politi-cians however, concerned about the procyclical e¤ect of fair value accounting, at the climax of the …nancial crisis pressed the IASB to relax reclassi…cation rules. The EU Commission even threatened the IASB with another carve-out from IAS 39 that would allow European …rms to reclassify …nancial instruments (McCreevy (2008)). Eventually, the IASB conceded to the po-litical pressure and amended IAS 39 and IFRS 7, primarily to avoid new reclassi…cation options without accompanying disclosure requirements (Bischof et al. (2010)). The amendment did not follow the IASB’s due process for standard-setting, went e¤ective retroactively in July 2008 and had no impact on the existing reclassi…cation options. Thus, it can clearly be identi…ed as an emergency measure.
The new reclassi…cation rules allow entities to reclassify …nancial assets from the trading to the banking book, i.e. from categories which require measurement at fair value to categories which require measurement at amortized costs (IAS 39.50-50F). More precisely, entities can now reclassify …nancial assets held for trading into the categories AFS, HTM and LAR and …nancial assets available for sale into the category LAR. However, entities are not allowed to reclassify …nancial derivatives and …nancial instruments which were designated at initial recognition as AFV. Furthermore, …nancial assets can only be reclassi…ed from AFV into AFS or HTM in rare circumstances. The de…nition of a rare circumstance is, however, somewhat imprecise. The IASB assumes that it is due to a “single event that is unusual and highly unlikely to recur in the near term”(IAS 39.BC104D). Therefore, the identi…cation of such a market condition might be open for dispute.
As mentioned before, the IASB conceded to the political pressure because it wanted to avoid new reclassi…cation options without accompanying disclosures. Therefore, the IASB did not only amend IAS 39 in October 2008 but also IFRS 7. According to this amendment, entities are obliged to follow extensive disclosure requirements regarding reclassi…ed …nancial assets
3 Related Literature 8
(IFRS 7.12A). For example, entities have to disclose reclassi…ed amounts, involved categories, carrying amounts, and fair values of …nancial assets which were reclassi…ed in current or previous reporting periods. Furthermore, entities have to disclose the facts that might indicate that a rare circumstance is existent.
Overall, the new reclassi…cation rules draw criticism. First, the standard-setting process was the result of a severe interference in the independence of the standard-setting body. Second and most important, the relaxed reclassi…cation rules open up new possibilities for earnings management. Hence, the amendment from October 2008 had most likely a negative e¤ect on the overall accounting quality of IFRS.
3
Related Literature
This study is based on the vast body of value relevance literature on fair value accounting for …nancial instruments. These studies generally …nd, beginning with Barth (1994), that disclosed (e.g. Ahmed and Takeda (1995), Eccher et al. (1996), Simko (1999)) as well as recognized (e.g. Park et al. (1999), Carroll et al. (2003), Ahmed et al. (2006)) fair values are value relevant and provide investors with incremental information in comparison to historic cost measures. Several studies, however, cast doubt to the value relevance of illiquid …nancial instruments (Petroni and Wahlen (1995), Eccher et al. (1996)). The results of these studies indicate that market participants perceive the reliability of illiquid …nancial instruments as substantially deteriorated. This might be due to the fact that entities have to use valuation models to estimate the fair values of these instruments. Hence, the fair values might be only, as argued before, noisy measures of the “true” values. Nevertheless, Carroll et al. (2003) …nd for their sample of closed-end investment funds that investors do not value fair values of liquid and illiquid …nancial assets di¤erently. This striking result could be explained by private information an entity can provide by using valuation models. Some evidence for such an e¤ect of private information is provided by Beaver and Venkatachalam (2003). They split loan fair values into discretionary, non-discretionary, and noise components and show that the discretionary component is priced higher by investors than its balance sheet value indicates. The positive e¤ect of discretion on the relevance of accounting
3 Related Literature 9
information might thus outweigh its negative e¤ect on reliability. Summing up the evidence, it is not obvious whether the value relevance of model-based fair values is signi…cantly reduced. More recent studies have focused on the reliability of fair values of …nancial instruments during the last …nancial crisis. While Kolev (2008), Goh et al. (2009), and Song et al. (2010) analyze the value relevance of the SFAS 157 fair value hierarchy in 2008, Fiechter and Novotny-Farkas (2011) lay their focus on the value relevance of …nancial instruments of IFRS-adopting banks for the period from 2006 to 2008. Kolev (2008), Goh et al. (2009), and Song et al. (2010) …nd that fair values of all measurement levels are value relevant. However, they also show consistently that level 3 fair values have signi…cantly reduced valuation coe¢ cients. Goh et al. (2009) even …nd evidence that investors perceive level 2 fair values as signi…cantly less value relevant than level 1 fair values. Overall, these …ndings indicate that the reduced reliability of mark-to-model fair values outweighs any positive e¤ect of private information on the relevance of fair values. The results of Fiechter and Novotny-Farkas (2011) support this notion. They analyze fair values of IFRS-adopting banks, but do not use fair value hierarchy disclosures because they were not obligatory in IFRS until 2009. Instead, they use fair values of …nancial instruments held for trading and of …nancial instruments which were designated at initial recognition at fair value through pro…t or loss. They assume that designated …nancial instruments are less reliable because it is a discretionary decision to measure them at fair value and banks can use this discretion for earnings management. The authors show that investors, indeed, perceive these fair values as less value relevant than the fair values of …nancial instruments held for trading. Yet the theoretical foundation of this study is disputable because the discretion in designating …nancial instruments at fair value is very limited (IAS 39.9b, IAS 39.12A) and the designation is an irrevocable decision.
Additionally, the studies show that the value relevance of mark-to-model fair values is less reduced for banks with better corporate governance (Song et al. (2010)), big-4 auditors, and high regulatory capital (Goh et al. (2009)). Thus, capital markets discount mark-to-model fair values of banks with lower incentives for earnings management less.
Overall, the recent evidence supports the hypothesis that mark-to-model fair values are less reliable than mark-to-market fair values. Nevertheless, there are several limitations to this
4 Empirical Analysis 10
conclusion. First, the studies focus on the subprime crisis in 2008 and do not cover the post-crisis period. Hence, the perception of the reliability of mark-to-model fair values could have changed in 2009 or 2010. Second, Kolev (2008), Goh et al. (2009), and Song et al. (2010) analyze the fair value hierarchy only for U.S. banks. Third, the study of Fiechter and Novotny-Farkas (2011), which indeed focuses on fair value accounting in European banks, does not analyze the fair value hierarchy and lacks a convincing theoretical foundation. Accordingly, there is currently no study analyzing the value relevance of the IFRS 7 fair value hierarchy. This study is aimed to mitigate these limitations by analyzing the IFRS 7 fair value hierarchy for European banks from 2006 to 2010.
Another string of research this study picks up, is the accounting choice literature. This litera-ture provides essential inputs for the question which intentions banks pursued by using the new reclassi…cation options. The studies show that banks used the relaxed rules to avoid violating regulatory capital requirements (Bischof et al. (2010)) and, in very general terms, for earnings management (Kholmy and Ernstberger (2010)). Therefore, one would expect an overall dete-riorated accounting quality for reclassifying banks. This study will investigate whether this is also re‡ected in the value relevance of mark-to-model fair values. In this context, I also exam-ine whether capital markets price the di¤erence between the fair value and the book value of reclassi…ed …nancial assets.
4
Empirical Analysis
4.1 Sample Selection and Descriptive Statistics
Although both IAS 39 and IFRS 7 are not industry-speci…c standards, this paper focuses on the banking sector. This is due to the fact that the largest part of banks’balance sheets consists of …nancial instruments, while they usually only represent marginal positions in other industries.3 I limit the sample to European banks, i.e. banks from EU 27 and EFTA states, for a sample period from 2006 to 2010. As mentioned before, quantitative fair value disclosures only became
3
With the notable exception of Simko (1999), all value relevance studies on fair value accounting for …nancial instruments focus on the …nancial sector.
4.1 Sample Selection and Descriptive Statistics 11
obligatory in 2009. However, there were banks which already started to disclosure fair value hierarchy information in 2006. While one can easily argue that banks which made fair value hierarchy disclosures in 2008 were early adopters of the IFRS 7 amendment, the case of banks disclosing fair value hierarchy information in 2006 and 2007 is more di¢ cult because there was not even an IASB discussion paper. The early quantitative disclosures could have been caused by a US-GAAP orientation of the disclosing banks, where SFAS 157 was issued in October 2006. An example supporting this hypothesis is Deutsche Bank. Deutsche Bank adopted US-GAAP in 2001, but had to apply IFRS in accordance with EU law (European Union (2002)) since 2007. In its annual report from 2007 Deutsche Bank makes quantitative disclosures, but states that it is following the IFRS fair value hierarchy (Deutsche Bank (2007), pp. 158-159). Thus, the bank might have used SFAS 157 to interpret the disclosure requirements of IFRS 7.
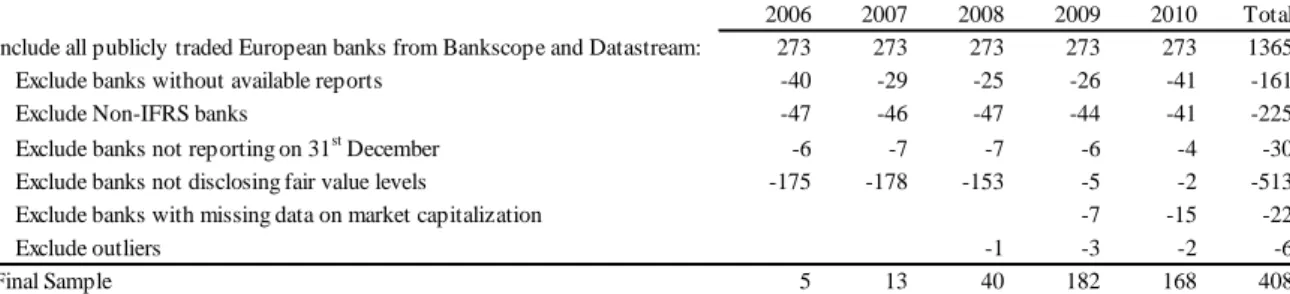
I include all publicly traded European banks which are either listed in Bureau von Dijk Bankscope or Thomson Reuters Datastream. From these I exclude all non-IFRS banks and banks without readily available reports. The latter step is necessary because both databases do not include any information regarding the fair value hierarchy or the reclassi…cation of …nancial assets. Thus, my sample is essentially hand-collected. In a further step, all banks with …scal-year end other than 31st December are excluded from the sample to avoid confounding economic e¤ects in the empirical analysis. Subsequently, bank-years without quantitative hierarchy disclosures are ex-cluded. Most of these excluded bank-years are obviously in 2006, 2007, and 2008 (see Table 1). Quite remarkably, even in 2009 and 2010 some banks did not make the required fair value hier-archy disclosures. For example, OTP Banka Slovensko does not make such disclosures in 2009 (OTP Banka Slovensko (2009)). Other previous studies found similar or even more appalling ev-idence regarding the non-compliance with obligatory disclosure requirements (e.g. Bischof et al. (2010)). Finally, I exclude all banks without su¢ cient data on the market capitalization and outliers. Because the sample size is rather limited, I do not use quantitative methods to exclude or to correct for outliers but I select them manually. Three banks with overall six bank-years are excluded from the …nal sample, Crédit Industriel et Commercial, Dexia Banka Slovensko, and Tatra Banka Slovensko. Both Dexia Banka Slovensko and Tatra Banka Slovensko have several tranches of stocks of which some are highly illiquid. Therefore, it is impossible to calculate an accurate …rm value. Crédit Industriel et Commercial, on the other hand, has a per stock book
4.1 Sample Selection and Descriptive Statistics 12
value of assets that deviates substantially from the median value of the total sample4 which could bias the empirical results. The remaining sample consists of 408 bank-years, 85.8% of them in 2009 and 2010.
[Insert Table 1 about here]
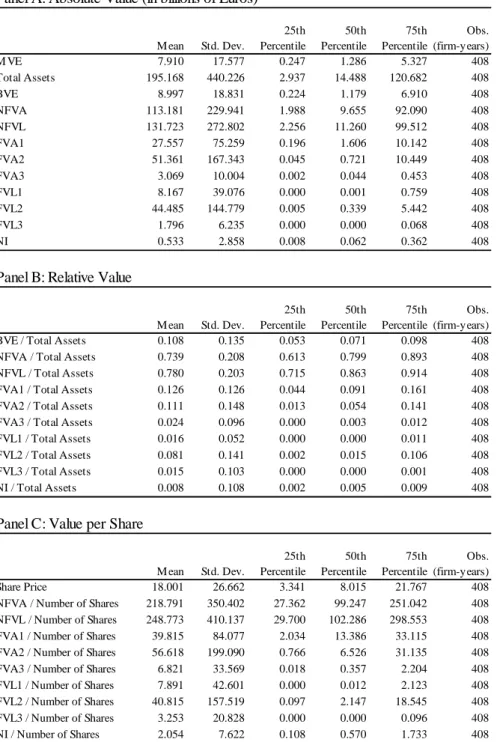
Table 2 displays descriptive statistics of this bank sample. Panel A provides absolute values, Panel B relative values, i.e. values compared to total assets, and Panel C values per share. Panel B reveals that fair value positions, in contrast to their prominence in the public debate during the …nancial crisis, only comprise a relatively small part of the balance sheet. On average, fair value assets account for 26.1% of total assets, while fair value liabilities account only for 11.2%. The median values are even lower. While the median value of fair value assets is 14.9%, it is just 1.5% for fair value liabilities. The largest part of …nancial assets (liabilities) measured at fair value are based on level 1 (level 2) inputs. Though, the lower relevance of fair value accounting for …nancial liabilities does not come unexpected with regard to the restrictive fair value option of IAS 39. The low amount of …nancial liabilities measured at fair value and the signi…cant number of banks which do not recognize any liabilities at fair values might, however, impair the signi…cance of the results of further statistical analysis.
[Insert Table 2 about here]
Another important observation is that for Panel A as well as for Panel C the mean values are substantially higher than the median values. Hence, the absolute values and the values per share have a highly right skewed distribution. While one expects a substantial impact of large observations in Panel A, the skewed distribution in Panel C is more critical. The number of outstanding shares is often used in market-based accounting research as a de‡ator to mitigate scale e¤ects, i.e. the undue in‡uence of large observations on regression results. However, the descriptives indicate that the number of outstanding shares might only replace one scaling factor
4.2 Hypotheses Development 13
(market value of equity) by another (price per share). This problem will be discussed in more detail in the robustness checks.
4.2 Hypotheses Development
The value relevance research design is a means to operationalize the trade-o¤ between relevance and reliability which is inherent in every accounting information (Barth (2000), pp. 16-17). Therefore, if an accounting information is value relevant, i.e. the regression coe¢ cient is signif-icantly di¤erent from zero, its relevance at least outweighs any lack of reliability. One can also state that accounting information is more relevant for equity investors if it is forward-looking. However, any forward-looking accounting information can be biased by measurement error or deliberate manipulation and thus lacks reliability. An example for forward-looking information are fair values because they generally represent present values of expected future cash ‡ows. Accordingly, they are highly relevant for investors, but might lack reliability. However, it seems to be unlikely that investors do not price fair values at all and therefore I expect the relevance of fair values of …nancial instruments to outweigh any lack of reliability, even for mark-to-model fair values.
H1a: Fair value assets and liabilities of all hierarchy levels are value relevant.
It is reasonable to expect the value relevance of fair value assets to decrease with decreasing hierarchy level, because the reliability declines with decreasing level. The e¤ect is more di¢ cult to predict for …nancial liabilities. Basically, the coe¢ cients on fair value liabilities should increase with decreasing hierarchy level because banks might use their discretion to recognize lower values and thus show higher pro…ts. On the other hand, measurement errors and the overall very low relative amounts of fair value liabilities might add a signi…cant noise component to the estimated coe¢ cients. Hence, I do not include fair value liabilities in H1b.
H1b: The value relevance of fair value assets decreases with decreasing hierarchy level. As mentioned before, the accounting choice literature on the relaxed reclassi…cation option …nds evidence that banks use the option to manage earnings and to avoid violating regulatory cap-ital requirements (Bischof et al. (2010), Kholmy and Ernstberger (2010)). Hence, reclassifying
4.2 Hypotheses Development 14
banks are likely to being perceived by capital market participants as less committed to a high accounting quality because these banks have shown their willingness to actively manage earnings and balance sheet relations, i.e. the decision to reclassify will be interpreted as a signal of low accounting quality. This negative signal also casts doubt on the reliability of mark-to-model fair values because banks which have used the reclassi…cation option for earnings management are more likely to use their discretion in measuring fair values for the same purpose. Therefore, I expect the value relevance of mark-to-model fair values to be signi…cantly lower for reclassifying banks than for non-reclassifying banks.
H2a: The value relevance of level 2 and 3 fair value assets is lower for reclassifying banks than for non-reclassifying banks.
The early literature on the value relevance of fair values of …nancial instruments essentially investigates whether disclosed fair values can provide incremental information to recognized historic costs. Most of these studies …nd supporting evidence (e.g. Barth et al. (1996), Eccher et al. (1996)). I expand the basic idea of this research to the reclassi…cation of …nancial assets. While banks recognize their reclassi…ed assets at amortized costs, they still have to disclose the fair values of these assets. If one assumes that banks use the reclassi…cation option to manage earnings and not to faithfully report their …nancial position, investors should price the fair value information disclosed in the notes. Therefore, the di¤erence between disclosed fair values and recognized amortized costs should be value relevant and explain cross-sectional variations of share prices.
H2b: The di¤erence between fair values and book values of reclassi…ed …nancial assets can explain cross-sectional and time-series variations of share prices.
The third and last hypothesis regards the …nancial position of the sample banks. As a proxy for the …nancial position I use the Tier 1 capital ratio. I assume that banks with lower Tier 1 capital, i.e. banks in a poor …nancial position, have higher incentives to use discretion to manage earnings and balance sheet relations. Consequently, similar to H2a, mark-to-model fair values of banks with low Tier 1 capital ratios should have a reduced value relevance.
4.3 Empirical Model 15
H3: The value relevance of level 2 and 3 fair value assets is lower for banks with low Tier 1 capital ratio than for banks with high Tier 1 capital ratios.
It must be stated that the Tier 1 capital ratio might be a noisy proxy for the …nancial position of a bank. Solvent and pro…table banks could intentionally hold less equity capital in order to increase their return on equity, while banks which have su¤ered a severe deterioration of the credit quality of their loan portfolios might still show a high Tier 1 capital ratio because the Tier 1 capital does not re‡ect this deterioration immediately due to the incurred loss model for …nancial assets recognized at amortized costs. Furthermore, H2a and H3 are likely to overlap at least to some extent because banks with low Tier 1 capital ratios are more likely to reclassify …nancial assets.
4.3 Empirical Model
Market-based accounting research is based on di¤erent valuation models. The most common models are the balance sheet approach and the residual income approach. The balance sheet approach was introduced to the value relevance literature by Landsman (1986). This approach uses the balance sheet identity, i.e.
BVE m X i=1 BVAi n X j=1 BVLj; (1)
where BVE, BVA, and BVL are the book values of equity, assets, and liabilities. The corre-sponding valuation model assumes that the market value of equity (MVE ) is solely determined by the market value of balance sheet assets (MVA) and liabilities (MVL):
M VE = m X i=1 M VAi n X j=1 M VLj: (2)
Although this valuation approach seems to be very appealing because of its simplicity, the empirical implementation reveals several weaknesses. First, not all assets and liabilities are measured at fair value. Hence, the book value is, in general, a very noisy proxy for the market value. Second, not all items satisfy the recognition criteria of the IASB Framework. Any empirical implementation of this valuation model will thus rely on accounting information, which
4.3 Empirical Model 16
does neither represent all assets and liabilities of a company nor in any case market values. Thus, in the absence of perfect markets, a valuation model that is solely based on balance sheet data might not be descriptive. Therefore, when implementing this approach, it is common practice to include a proxy for non-recognized assets, which is typically net income (NI ) (Barth and Landsman (1995), Aboody et al. (1999)).
An alternative valuation approach is the Ohlson (1995) residual income valuation model. It explicitly models information dynamics, i.e. the time-series behavior of residual income:
M VEt= BVEt+ 1RIt+ 2 t; (3)
where RI is residual income, captures other (non-accounting) information, and 1 and 2
are valuation coe¢ cients dependent on interest rates and information dynamics. The main advantages of this valuation model in comparison to the balance sheet approach are the strong theoretical foundation and the allowance for other information. However, there does not yet seem to be a conclusive empirical measure for other information. While some studies explicitly assume that other information is represented in the error term (e.g. Barth and Clinch (1998)), other studies make the same assumption implicitly (e.g. Song et al. (2010)), even though this limits the Ohlson (1995) model substantially (Liu and Ohlson (2000)). In the end, the empirical implementation of both valuation approaches does not di¤er signi…cantly. Some studies even state explicitly that their empirical model can be seen as based either on the balance sheet approach or on the Ohlson (1995) model (e.g. Aboody et al. (1999), Barth et al. (1998)). Following Song et al. (2010), I use a regression model which can be regarded as based on either a modi…ed Ohlson (1995) model or the balance sheet approach:5
Pit = 0+ 1N F VAit+ 2N F VLit+ 3F VA1it+ 4F VA2it+ 5F VA3it
+ 6F VL1it+ 7F VL2it+ 8F VL3it+ 9N Iit+ "it (4)
where P is the price per share three months after …scal-year end, NFVA (NFVL) are non-fair value assets (liabilities), and FVA1 (FVL1 ), FVA2 (FVL2 ), and FVA3 (FVL3 ) are non-fair
4.3 Empirical Model 17
value assets (liabilities) of the three IFRS 7 measurement levels. The study uses the number of outstanding shares as a de‡ator to mitigate scale e¤ects (Barth and Clinch (2009)). Hence, all variables are on a per share basis. Another factor that has to be considered are possible cross-sectional (time …xed e¤ects) and time-series dependencies (…rm …xed e¤ects) of the regression residuals. Following Petersen (2009), I use clustered standard errors to control for …xed e¤ects. In order to test H2a, the variable ReclassAssets is included in the regression model. ReclassAssets is a dummy variable that takes the value of one if a bank has reclassi…ed …nancial assets on its balance sheet and zero otherwise. The variable is interacted with fair value assets of all measurement levels. I do not interact it with fair value liabilities because these in general account for only a very low percentage of total assets, and a substantial number of banks does not report any liabilities at fair value.
Pit= 0+ 1N F VA + 2N F VLit+ 3F VA1it+ 4F VA1it ReclassAssetsit
+ 5F VA2it+ 6F VA2it ReclassAssetsit+ 7F VA3it+ 8F VA3it
ReclassAssetsit+ 9F VL1it+ 10F VL2it+ 11F VL3it+ 12N Iit
+ 13ReclassAssetsit+ "it (5)
In addition, I expand Equation 5 by including the variable ReclassAssetsFVBV which is the di¤erence between disclosed fair values and recognized amortized costs of assets which were reclassi…ed in accordance with the relaxed reclassi…cation option.
Pit= 0+ 1N F VA + 2N F VLit+ 3F VA1it+ 4F VA1it ReclassAssetsit
+ 5F VA2it+ 6F VA2it ReclassAssetsit+ 7F VA3it+ 8F VA3it
ReclassAssetsit+ 9F VL1it+ 10F VL2it+ 11F VL3it+ 12N Iit
+ 13ReclassAssetsF VBVit+ 14ReclassAssetsit+ "it (6)
For the third hypothesis, the variable ReclassAssets is replaced by the variable LowTier1Ratio. This variable is another dummy which is one for all banks with a Tier 1 capital ratio below the
4.3 Empirical Model 18
median Tier 1 capital ratio and zero otherwise. Again, the dummy is interacted with fair value assets but not with fair value liabilities.
Pit = 0+ 1N F VA + 2N F VLit+ 3F VA1it+ 4F VA1it LowT ier1Ratioit
+ 5F VA2it+ 6F VA2it LowT ier1Ratioit+ 7F VA3it+ 8F VA3it
LowT ier1Ratioit+ 9F VL1it+ 10F VL2it+ 11F VL3it+ 12N Iit
+ 13LowT ier1Ratioit+ "it (7)
In the …nal model, I combine Equations 5 and 7, i.e. I include both dummy variables in order to control for confounding e¤ects. Confounding e¤ects might occur in Equations 5 and 7 because banks use, as Bischof et al. (2010) show, new reclassi…cation options to avoid violating regulatory capital requirements. Accordingly, these banks most likely have less regulatory capital than the median bank. Signi…cant results in Equation 5 might therefore be solely driven by the e¤ect of low capital ratios and not by the e¤ects of a reclassi…cation decision on the perceived accounting quality.
Pit= 0+ 1N F VA + 2N F VLit+ 3F VA1it+ 4F VA1it ReclassAssetsit
+ 5F VA1it LowT ier1Ratioit+ 6F VA1it ReclassAssetsit LowT ier1Ratioit
+ 7F VA2it+ 8F VA2it ReclassAssetsit+ 9F VA2it LowT ier1Ratioit
+ 10F VA2it ReclassAssetsit LowT ier1Ratioit+ 11F VA3it+ 12F VA3it
ReclassAssetsit+ 13F VA3it LowT ier1Ratioit+ 14F VA3it ReclassAssetsit
LowT ier1Ratioit+ 15F VL1it+ 16F VL2it+ 17F VL3it+ 18N Iit
+ 19ReclassAssetsit+ 20LowT ier1Ratioit+ 21ReclassAssetsit
4.4 Results 19
4.4 Results
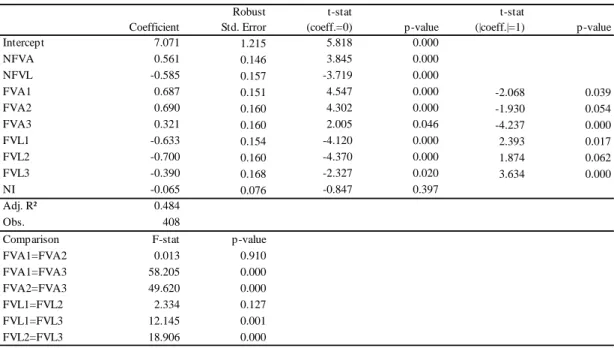
Table 3 shows the results of the basic OLS regression model (Equation 4). These results show that all fair value assets and liabilities, even level 3 fair values, are value relevant, i.e. their coe¢ cients are signi…cantly di¤erent from zero. Hence, the evidence supports H1a. Furthermore, when comparing the coe¢ cients of the di¤erent fair value levels, it can be seen that only the coe¢ cients of level 3 fair values are signi…cantly di¤erent from the coe¢ cients of other levels. This is true both for assets and liabilities. Accordingly, only level 3 fair values are perceived by capital markets as less reliable than level 1 fair values. One can thus not assert that every mark-to-model is some kind of mark-to-myth because investors distinguish between level 2 and level 3 fair values and even price the least reliable fair values. The fact that the coe¢ cients of fair value liabilities decrease with decreasing hierarchy level is somewhat striking. Following the consideration that banks use their discretion in fair value measurement for earnings management, increasing coe¢ cients would be expected. However, as argued before, most banks have very low or even zero amounts of fair value liabilities. Thus, the coe¢ cients on fair value liabilities might not be representative or even biased. Summing up, the evidence only weakly supports H1b.
[Insert Table 3 about here]
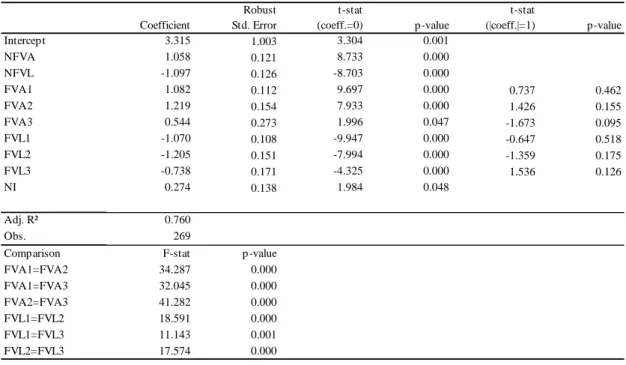
Based on the balance sheet model one would expect coe¢ cients of 1 for assets and -1 for lia-bilities. A deviation from these expected coe¢ cients could be explained by a lack of reliability. The results show, indeed, that all fair value assets and liabilities have coe¢ cients which are signi…cantly di¤erent from the theoretically expected coe¢ cients. But the results also seem to suggest that the investors even discount fair value assets and liabilities of the …rst hierarchy level, i.e. fair values based on quoted market prices. Hence, the observed discounts cannot be explained only by a lack of reliability of single accounting positions. They might, though, re‡ect institutional characteristics of the reporting banks or country …xed e¤ects which are not considered in the valuation approach. To test for these e¤ects I split the sample …rst by coun-try groups (Table 4) and then by bank size (Table 5). For the …rst split I de…ne two councoun-try groups, i.e. EU 15 and Other European. The latter includes all new EU member states and
4.4 Results 20
the EFTA states. As the results of Fiechter and Novotny-Farkas (2011) indicate, investors place higher discounts on fair values of banks from non-EU 15 countries. These discounts might be explained by lower regulatory quality and less sophisticated capital markets in those countries. The results in Table 4 show indeed that for EU 15 banks, only the coe¢ cients on level 3 fair values deviate signi…cantly from expected values, while for banks from other European coun-tries, all coe¢ cients on fair value assets and liabilities deviate from expected values. Panel B even reveals that level 3 fair values totally lose value relevance for banks from other European countries. Therefore, the deviation from expected values in the complete sample seems to be driven by banks from other European countries. Another factor in‡uencing the results could be institutional characteristics of the sample banks. These characteristics might be re‡ected in bank size (e.g. Song et al. (2010)). Therefore, I split the sample in large banks (above median total assets) and small banks (below median total assets). The results of this partitioning are reported in Table 5. While all fair value assets and liabilities are value relevant and coe¢ cients do not signi…cantly di¤er from expected values for small banks (Panel B), they do di¤er for large banks, and level 3 fair values even lose value relevance (Panel A). At …rst glance these results are striking. For large banks one would expect higher scrutiny by capital market participants and an intense analyst coverage. Therefore, the reliability of recognized fair values should be higher for large banks than for small banks. On the other hand, one could also argue that investors can use other sources of information than …nancial statements when valuing large banks, while for small banks they have to rely on this one source of information. Accordingly, the value of large banks could be driven by other information. This, however, should have no impact in value relevance research as long as this information is re‡ected in …nancial statement positions. The low coe¢ cients of large banks could therefore indicate that the additional information is a correlated omitted variable in the regression model which casts some doubts on the valuation approach. As discussed before, there is no convincing empirical measure for other information and therefore a change to the Ohlson (1995) or Feltham and Ohlson (1995) model is not a feasible solution to this problem. Another possible explanation for the low coe¢ cients for large banks could be confounding e¤ects, i.e. the majority of large banks could be situated in other European countries. However, the data show that EU 15 banks have on average assets worth EUR 276.94bn, while banks from other European countries only have EUR 36.92bn. Hence, the
4.4 Results 21
low coe¢ cients of large banks cannot be explained by less sophisticated markets or a weaker regulatory environment. Overall, the low coe¢ cient on level 1 fair value assets (FVA1 ) in the full sample and the low coe¢ cients on fair value assets of all measurement levels in the subsam-ples for banks from other European countries and large banks might indicate that the valuation model is not descriptive for all banks. Therefore, the empirical results must be interpreted with caution.
[Insert Table 4 about here]
[Insert Table 5 about here]
The results of the expanded empirical models (Equations 5-8) are shown in Table 6. The …rst model analyzes the e¤ect of the reclassi…cation of …nancial assets. For this purpose, the sam-ple period is reduced to the years 2008 to 2010 because the relaxed reclassi…cation rules went e¤ective retroactively in July 2008. The results on the interaction terms between ReclassAssets and the di¤erent levels of fair value assets are rather weak. The coe¢ cients on the interaction terms do neither have the expected signs nor are they signi…cant. The decision to reclassify …nancial assets does not seem to be interpreted by capital market participants as a signal of a lower accounting quality. One could argue that these results are driven by a self-selection bias because for the year 2008, the sample includes only those banks which voluntarily disclose fair value hierarchy data. Voluntary disclosing might indicate that these banks are committed to a higher accounting quality. However, when the observations from 2008 are excluded from the sample, the coe¢ cients on the interaction terms remain far from signi…cant at conventional levels (untabulated). Another potential problem might be caused by the variable ReclassAs-sets. This variable has a value of one as long as a bank has reclassi…ed …nancial assets on its balance sheet. Yet, the actual reclassi…cation of the …nancial assets might have occurred in the previous …scal years. If investors only interpret the decision to reclassify as a signal of a lower accounting quality, the regression results might be ‡awed. Therefore, I replace ReclassAssets by the variable ReclassDecision which is one if the bank has reclassi…ed …nancial assets in the current reporting period and zero otherwise. Again, the relevant coe¢ cients are insigni…cant (untabulated). Accordingly, the evidence suggests that investors do not perceive the fair value
4.4 Results 22
disclosures of reclassifying banks as less value relevant. In a further step, the variable Reclas-sAssetsFVBV is included in the regression model. As mentioned above, this variable covers the di¤erence between the fair value and the book value of reclassi…ed …nancial assets. Again, the coe¢ cients of this variable and of the interaction terms remain insigni…cant. Summing up, the results do not support H2a and H2b.
In the third expanded empirical model, I test for the e¤ects of regulatory capital on the perceived reliability of fair values. Again, the sample period includes all sample years, i.e. 2006 to 2010, but without bank-years where information about Tier 1 ratios is missing. As stated in H3, I expect mark-to-model fair values to be less value relevant for banks with low regulatory capital than for banks with high regulatory capital. In contrast to results for the reclassi…cation, two of three coe¢ cients on the interaction terms are signi…cant at conventional levels. The e¤ect of regulatory capital is signi…cant for level 1 and level 2 fair values. While I do not make any assumption about the impact on level 1 fair values, the results show, contrary to my predictions, a signi…cantly positive e¤ect of low regulatory capital on the value relevance of level 2 fair values. The coe¢ cient on the interaction between low regulatory capital and level 3 fair values has the expected sign but is not signi…cant.6
[Insert Table 6 about here]
In a …nal step, I test for both the e¤ects of reclassi…cation and of low regulatory capital in a combined model to control for possible confounding e¤ects. The sample for this combined model di¤ers from the samples of the separate models because it re‡ects the constraints of both mod-els. The sample period spans from 2008 to 2010 and all bank-years without regulatory capital information are excluded. The …ndings are again very weak. Coe¢ cients on the interaction terms only get signi…cant for level 2 fair values. Here, one can observe a positive signi…cant e¤ect of low regulatory capital and of the decision to reclassify …nancial assets. Even if a bank has reclassi…ed …nancial assets and low regulatory capital, markets value its level 2 fair values
6 Goh et al. (2009) …nd a signi…cantly negative impact of low regulatory capital on the reliability of level 3 fair
4.5 Robustness Checks 23
at a premium (11 cents for each Euro of level 2 assets) in comparison to non-reclassifying banks with high regulatory capital.
Overall, the results of the expanded models do not seem to support hypotheses H2 and H3. Nevertheless, one can ascertain that generalizations about mark-to-model fair values are not feasible because market participants value level 2 and 3 fair values di¤erently. The insigni…cant impact of low regulatory capital on the perceived reliability of mark-to-model fair values remains noticeable. This result might be explained by the fact that most banks with low Tier 1 ratios are situated in the EU 15. This means that the indicator variable LowTier1Ratio might also cover di¤erences in value relevance between EU 15 and other European countries.
4.5 Robustness Checks
My descriptive statistics cast some doubt on the ability of the number of outstanding shares to mitigate scale e¤ects. Therefore, I test the basic regression model with alternative de‡ators. Since the number of outstanding shares is rather unrelated to the economics of the sample …rms, I use two more strongly related de‡ators, book value and market value of equity, to test for the robustness of the regression results. Book value of equity is a very common de‡ator in the value relevance literature (e.g. Eccher et al. (1996), Nelson (1996)). Market value of equity, on the other hand, is less common. This de‡ator was proposed by Easton and Sommers (2003). They argue that market capitalization as of …scal-year end represents the scale in a sample. Therefore, they suggest to use market capitalization as a de‡ator. This would result in the following regression model:
M VEit M VEit = 0 1 M VEit + 1 N F VAit M VEit + 2 N F VLit M VEit + 3 F VA1it M VEit + 4 F VA2it M VEit + 5 F VA3it M V Eit + 6 F VL1it M V Eit + 7 F VL2it M V Eit + 8 F VL3it M V Eit + 9 N Iit M V Eit + "it: (9)
The obvious problem is that the dependent variable will take a value of one for every observation. So an OLS estimation is no longer feasible. The authors recommend to use a WLS regression with the inverted square of the market capitalization as a weight, which is consistent with the regression above.
5 Conclusion 24
[Insert Table 7 about here]
The results of the regressions based on these alternative de‡ators are reported in Table 7 (BVE in Panel A, MVE in Panel B). They reveal that the fair values of all levels remain signi…cant for both alternative de‡ators, with the notable exception of level 3 assets in the regression de‡ated by the book value of equity. Overall, the results still support H1a. However, the absolute values of the coe¢ cients are substantially lower for the regression models based on the alternative de‡ators. Furthermore, the coe¢ cient of level 2 fair value assets is now signi…cantly smaller than the coe¢ cient of level 1 fair value assets and - when using the market value of equity as a de‡ator - level 2 assets are no longer more value relevant than level 3 assets. This strongly supports H1b. Rather striking is the very low adjusted R2 of the regression de‡ated by the book value of equity. This means that accounting measures can only explain a small part of the cross-sectional and time-series variation of market-to-book ratios, as is well known from previous literature (e.g. Eccher et al. (1996), Nelson (1996)).
Summing up, the results based on the alternative de‡ators substantially deviate from the results of the share-de‡ated regression model. Though the basic hypotheses hold when testing the regressions for robustness, the decreased value of the coe¢ cients in models based on book value and market value of equity indicates that there are scale e¤ects which cannot be e¤ectively mitigated by the number of shares.
5
Conclusion
This study is the …rst which analyses the value relevance of the IFRS 7 fair value hierarchy. The main result is that fair values of …nancial instruments are value relevant, but level 3 fair values are perceived as less reliable than other fair values. In addition, Investors price fair values of EU 15 banks substantially higher than fair values of banks from other European countries, which can be explained by di¤erences in regulatory quality and …nancial market sophistication. I also …nd that capital markets price fair values of small banks higher than fair values of large banks.
5 Conclusion 25
This might indicate that market prices of large banks are more strongly driven by information not re‡ected in …nancial statements.
The study also analyses the e¤ects of a reclassi…cation of …nancial assets and of regulatory capital on the reliability of fair value assets. While it …nds no signi…cant e¤ects for the reclassi…cation, there is a weakly signi…cant impact of the regulatory capital on the reliability of mark-to-model fair values.
A limitation this study shares with all value relevance studies is that it is based on the assumption of e¢ cient markets. This assumption might be, however, particularly questionable during the …nancial crisis. The low coe¢ cients could be explained by these extraordinary circumstances. Overall, the results show that fair values of all measurement levels remain value relevant even during the …nancial crisis. Finally, the signi…cant variation of the coe¢ cients of the di¤erent fair value levels proves that the new disclosure requirements provide decision-useful information for investors.
References 26
References
Aboody, D., Barth, M. E. and Kasznik, R. (1999). Revaluations of …xed assets and future …rm performance: Evidence from the UK, Journal of Accounting and Economics 26(1-3): 149– 178.
Ahmed, A. S., Kilic, E. and Lobo, G. J. (2006). Does Recognition versus Disclosure Matter? Evidence from Value-Relevance of Banks’ Recognized and Disclosed Derivative Financial Instruments, The Accounting Review 81(3): 567–588.
Ahmed, A. S. and Takeda, C. (1995). Stock market valuation of gains and losses on commercial banks’investment securities - An empirical analysis, Journal of Accounting and Economics 20(2): 207–225.
Barth, M. E. (1994). Fair Value Accounting: Evidence from Investment Securities and the Market Valuation of Banks, The Accounting Review 69(1): 1–25.
Barth, M. E. (2000). Valuation-based accounting research: Implications for …nancial reporting and opportunities for future research, Accounting and Finance 40(1): 7–31.
Barth, M. E. (2007). Standard-setting measurement issues and the relevance of research, Ac-counting and Business Research 37(3): 7–15.
Barth, M. E., Beaver, W. H. and Landsman, W. R. (1996). Value-Relevance of Banks’ Fair Value Disclosures under SFAS No. 107, The Accounting Review 71(4): 513–537.
Barth, M. E., Beaver, W. H. and Landsman, W. R. (2001). The relevance of the value-relevance literature for …nancial accounting standard setting: another view., Journal of Accounting and Economics 31(1-3): 77 –104.
Barth, M. E., Clement, M. B., Foster, G. and Kasznik, R. (1998). Brand Values and Capital Market Valuation, Review of Accounting Studies 3(1-2): 41–68.
Barth, M. E. and Clinch, G. (1998). Revalued Financial, Tangible, and Intangible Assets: Asso-ciations with Share Prices and Non-Market-Based Value Estimates, Journal of Accounting Research 36(Supplement): 199–233.
References 27
Barth, M. E. and Clinch, G. (2009). Scale E¤ects in Capital Market-Based Accounting Research, Journal of Business Finance and Accounting 36(3-4): 253–288.
Barth, M. E. and Landsman, W. R. (1995). Fundamental Issues Related to Using Fair Value Accounting for Financial Reporting, Accounting Horizons 9(4): 97–107.
Beaver, W. H. and Venkatachalam, M. (2003). Di¤erential Pricing of Components of Bank Loan Fair Values, Journal of Accounting, Auditing and Finance 18(1): 41–67.
Bischof, J., Brüggemann, U. and Daske, H. (2010). Relaxation of Fair Value Rules in Times of Crisis: An Analysis of Economic Bene…ts and Costs of the Amendment to IAS 39, Working paper.
Bu¤ett, W. E. (2003). Chairman’s letter, Annual Report 2002, Berkshire Hathaway, pp. 3–23. Carroll, T. J., Linsmeier, T. J. and Petroni, K. R. (2003). The Reliability of Fair Value versus
Historical Cost Information: Evidence from Closed-End Mutual Funds, Journal of Account-ing, Auditing and Finance 18(1): 1–23.
Deutsche Bank (2007). Annual review 2007, Report.
Easton, P. D. and Sommers, G. A. (2003). Scale and the Scale E¤ect im Market-based Account-ing Research, Journal of Business Finance and AccountAccount-ing 30(1-2): 25–55.
Eccher, E. A., Ramesh, K. and Thiagarajan, S. R. (1996). Fair value disclosure by bank holding companies, Journal of Accounting and Economics 22(1-3): 79–117.
Enria, A., Cappiello, L., Dierick, F., Grittini, S., Haralambous, A., Maddaloni, A., Molitor, P., Pires, F. and Poloni, P. (2004). Fair Value Accounting and Financial Stability, Occasional Paper Series 13, European Central Bank.
European Union (2002). REGULATION (EC) No 1606/2002 OF THE EUROPEAN PAR-LIAMENT AND OF THE COUNCIL of 19 July 2002 on the application of international accounting standards, Regulation.
Feltham, J. A. and Ohlson, J. A. (1995). Valuation and Clean Surplus Accounting for Operating and Financial Activities, Contemporary Accounting Research 11(2): 689–731.
Fiechter, P. and Novotny-Farkas, Z. (2011). Pricing of Fair Values during the Financial Crisis: International Evidence, Working paper.
References 28
Goh, B. W., Ng, J. and Yong, K. O. (2009). Market Pricing of Banks’Fair Value Assets Reported under SFAS 157 during the 2008 Economic Crisis, Working paper.
IASB (2008). Reclassi…cation of Financial Assets - Amendments to IAS 39 Financial Instru-ments: Recognition and Measurement and IFRS 7 Financial InstruInstru-ments: Disclosures, Amendment.
IASB (2009). Improving Disclosures about Financial Instruments - Amendments to IFRS 7 Financial Instruments: Disclosures, Amendment.
Kholmy, K. and Ernstberger, J. (2010). Reclassi…cation of Financial Instruments in the Financial Crisis - Empirical Evidence from the European Banking Sector, Working paper.
Kolev, K. (2008). Do Investors Perceive Marking-to-Model as Marking-to-Myth? Early Evidence from FAS 157 Disclosure, Working paper, NYU Stern School of Business.
Landsman, W. (1986). An Empirical Investigation of Pension Fund Property Rights, The Ac-counting Review 61(4): 662–691.
Laux, C. and Leuz, C. (2009). The crisis of fair-value accounting: Making sense of the recent debate, Accounting, Organizations and Society 34(6-7): 826–834.
Liu, J. and Ohlson, J. A. (2000). The Feltham-Ohlson (1995) Model: Empirical Implications, Journal of Accounting, Auditing and Finance 15(3): 321–331.
McCreevy, C. (2008). Lamfalussy follow up: future structure of supervision, Euro-pean Parliament Plenary Session, 8 October 2008, URL: http://europa.eu/rapid/ pressReleasesAction.do?reference=SPEECH/08/513&format=HTML&aged=0&language= EN&guiLanguage=en.
Nelson, K. K. (1996). Fair Value Accounting for Commercial Banks: An Empirical Analysis of SFAS No. 107, The Accounting Review 71(2): 161–182.
Ohlson, J. A. (1995). Eamings, Book Values, and Dividends in Equity Valuation, Contemporary Accounting Research 11(2): 661–687.
References 29
Park, M. S., T., P. and Park, B. T. (1999). Fair Value Disclosures for Investment Securities and Bank Equity: Evidence from SFAS No. 115, Journal of Accounting, Auditing and Finance 14(3): 347–370.
Petersen, M. A. (2009). Estimating Standard Errors in Finance Panel Data Sets: Comparing Approaches, Review of Financial Studies 22(1): 435–480.
Petroni, K. R. and Wahlen, J. M. (1995). Fair Values of Equity and Debt Securities and Share Prices of Property-Liability Insurers, Journal of Risk and Insurance 62(4): 719–737. Plantin, G., Sapra, H. and Shin, H. S. (2008). Fair value accounting and …nancial stability,
Research Paper 08-15, The University of Chicago Graduate School of Business.
Simko, P. J. (1999). Financial Instrument Fair Values and Non…nancial Firms, Journal of Accounting, Auditing and Finance 14(3): 247–274.
Song, C. J., Thomas, W. B. and Yi, H. (2010). Value Relevance of FAS No. 157 FairValue Hier-archy Information and the Impact of Corporate Governance Mechanisms, The Accounting Review 85(4): 1375–1410.
Whittington, G. (2008). Fair Value and the IASB/FASB Conceptual Framework Project: An Alternative View, Abacus 44(2): 139–168.
Tables 30
Table 1: Sample Selection
2006 2007 2008 2009 2010 Total Include all publicly traded European banks from Bankscope and Datastream: 273 273 273 273 273 1365 Exclude banks without available reports -40 -29 -25 -26 -41 -161 Exclude Non-IFRS banks -47 -46 -47 -44 -41 -225 Exclude banks not reporting on 31st December -6 -7 -7 -6 -4 -30 Exclude banks not disclosing fair value levels -175 -178 -153 -5 -2 -513 Exclude banks with missing data on market capitalization -7 -15 -22
Exclude outliers -1 -3 -2 -6
Final Sample 5 13 40 182 168 408
T his table depict s the sample select ion process. First, both BvD Bankscope and T homson Reuters Dat ast ream were used to identify all publicly traded European (EU 27 + EFT A) banks. T hen, all firm-years without readily available reports were excluded. Based on t he reports all banks not reporting on 31st December and firm-years wit hout fair value level disclosures were eliminat ed. In a final step, I excluded firm-years wit h missing data on market capitalizat ion and outliers.
Tables 31
Table 2: Descripitive Statistics Panel A: Absolute Value (in billions of Euros)
M ean Std. Dev. 25th Percentile 50th Percentile 75th Percentile Obs. (firm-y ears) M VE 7.910 17.577 0.247 1.286 5.327 408 Total Assets 195.168 440.226 2.937 14.488 120.682 408 BVE 8.997 18.831 0.224 1.179 6.910 408 NFVA 113.181 229.941 1.988 9.655 92.090 408 NFVL 131.723 272.802 2.256 11.260 99.512 408 FVA1 27.557 75.259 0.196 1.606 10.142 408 FVA2 51.361 167.343 0.045 0.721 10.449 408 FVA3 3.069 10.004 0.002 0.044 0.453 408 FVL1 8.167 39.076 0.000 0.001 0.759 408 FVL2 44.485 144.779 0.005 0.339 5.442 408 FVL3 1.796 6.235 0.000 0.000 0.068 408 NI 0.533 2.858 0.008 0.062 0.362 408
Panel B: Relative Value
M ean Std. Dev. 25th Percentile 50th Percentile 75th Percentile Obs. (firm-y ears) BVE / Total Assets 0.108 0.135 0.053 0.071 0.098 408 NFVA / Total Assets 0.739 0.208 0.613 0.799 0.893 408 NFVL / Total Assets 0.780 0.203 0.715 0.863 0.914 408 FVA1 / Total Assets 0.126 0.126 0.044 0.091 0.161 408 FVA2 / Total Assets 0.111 0.148 0.013 0.054 0.141 408 FVA3 / Total Assets 0.024 0.096 0.000 0.003 0.012 408 FVL1 / Total Assets 0.016 0.052 0.000 0.000 0.011 408 FVL2 / Total Assets 0.081 0.141 0.002 0.015 0.106 408 FVL3 / Total Assets 0.015 0.103 0.000 0.000 0.001 408 NI / Total Assets 0.008 0.108 0.002 0.005 0.009 408
Panel C: Value per Share
M ean Std. Dev. 25th Percentile 50th Percentile 75th Percentile Obs. (firm-y ears) Share Price 18.001 26.662 3.341 8.015 21.767 408 NFVA / Number of Shares 218.791 350.402 27.362 99.247 251.042 408 NFVL / Number of Shares 248.773 410.137 29.700 102.286 298.553 408 FVA1 / Number of Shares 39.815 84.077 2.034 13.386 33.115 408 FVA2 / Number of Shares 56.618 199.090 0.766 6.526 31.135 408 FVA3 / Number of Shares 6.821 33.569 0.018 0.357 2.204 408 FVL1 / Number of Shares 7.891 42.601 0.000 0.012 2.123 408 FVL2 / Number of Shares 40.815 157.519 0.097 2.147 18.545 408 FVL3 / Number of Shares 3.253 20.828 0.000 0.000 0.096 408 NI / Number of Shares 2.054 7.622 0.108 0.570 1.733 408
T his table presents descriptive statistics for the whole sample of banks from 2006 t o 2010. Panel A reports absolute values in billions of Euros, Panel B relat ive values in per cent of total assets, and Panel C values per share. MVE (Share Price) is the market value of equity (share price) three mont hs aft er fiscal year end. BVE represents the book value of equity. NFVA (NFVL) is non-fair value assets (liabilit es). FVA1 (FVL1), FVA2 (FVL2), and FVA3 (FVL3) represent fair value asset s (liabilities) of the three IFRS 7 hierarchy levels. NI is net income.
Tables 32
Table 3: Value Relevance of Fair Value Assets and Liabilities Dependent Variable: Share Price (fiscal year end + three months)
Coefficient Robust Std. Error t-stat (coeff.=0) p-value t-stat (|coeff.|=1) p-value Intercept 7.071 1.215 5.818 0.000 NFVA 0.561 0.146 3.845 0.000 NFVL -0.585 0.157 -3.719 0.000 FVA1 0.687 0.151 4.547 0.000 -2.068 0.039 FVA2 0.690 0.160 4.302 0.000 -1.930 0.054 FVA3 0.321 0.160 2.005 0.046 -4.237 0.000 FVL1 -0.633 0.154 -4.120 0.000 2.393 0.017 FVL2 -0.700 0.160 -4.370 0.000 1.874 0.062 FVL3 -0.390 0.168 -2.327 0.020 3.634 0.000 NI -0.065 0.076 -0.847 0.397 Adj. R² 0.484 Obs. 408
Comparison F-stat p-value FVA1=FVA2 0.013 0.910 FVA1=FVA3 58.205 0.000 FVA2=FVA3 49.620 0.000 FVL1=FVL2 2.334 0.127 FVL1=FVL3 12.145 0.001 FVL2=FVL3 18.906 0.000
T he table presents OLS coefficient estimates, standard errors, t-stats, and p-values. T he comparison section tests for significant differ-ences between the OLS coefficient estimates of fair value assets (liabilities) of different measurement levels. T he sample period spans from 2006 to 2010. NFVA (NFVL) is non-fair value assets (liabilites). FVA1 (FVL1), FVA2 (FVL2), and FVA3 (FVL3) represent fair value assets (liabilities) of the three IFRS 7 hierarchy levels. NI is the net income. All variables are on a per share basis. T he standard errors are clustered t o control for fixed effects (Petersen (2009)).
Tables 33
Table 4: Value Relevance of Fair Value Assets and Liabilities: EU15 and other European Banks Dependent Variable: Share Price (fiscal year end + three months)
Panel A: EU 15 Banks Coefficient Robust Std. Error t-stat (coeff.=0) p-value t-stat (|coeff.|=1) p-value Intercept 3.315 1.003 3.304 0.001 NFVA 1.058 0.121 8.733 0.000 NFVL -1.097 0.126 -8.703 0.000 FVA1 1.082 0.112 9.697 0.000 0.737 0.462 FVA2 1.219 0.154 7.933 0.000 1.426 0.155 FVA3 0.544 0.273 1.996 0.047 -1.673 0.095 FVL1 -1.070 0.108 -9.947 0.000 -0.647 0.518 FVL2 -1.205 0.151 -7.994 0.000 -1.359 0.175 FVL3 -0.738 0.171 -4.325 0.000 1.536 0.126 NI 0.274 0.138 1.984 0.048 Adj. R² 0.760 Obs. 269
Comparison F-stat p-value FVA1=FVA2 34.287 0.000 FVA1=FVA3 32.045 0.000 FVA2=FVA3 41.282 0.000 FVL1=FVL2 18.591 0.000 FVL1=FVL3 11.143 0.001 FVL2=FVL3 17.574 0.000
Panel B: Other European Banks
Coefficient Robust Std. Error t-stat (coeff.=0) p-value t-stat (|coeff.|=1) p-value Intercept 10.537 1.653 6.373 0.000 NFVA 0.275 0.079 3.458 0.001 NFVL -0.277 0.088 -3.162 0.002 FVA1 0.448 0.087 5.164 0.000 -6.352 0.000 FVA2 0.342 0.095 3.596 0.000 -6.911 0.000 FVA3 -0.005 0.133 -0.038 0.970 -7.542 0.000 FVL1 1.517 0.237 6.403 0.000 10.624 0.000 FVL2 -0.558 0.088 -6.343 0.000 5.020 0.000 FVL3 -0.048 0.120 -0.402 0.689 7.929 0.000 NI 0.113 0.101 1.118 0.266 Adj. R² 0.600 Obs. 139
Comparison F-stat p-value FVA1=FVA2 4.327 0.039 FVA1=FVA3 27.430 0.000 FVA2=FVA3 16.062 0.000 FVL1=FVL2 65.953 0.000 FVL1=FVL3 31.985 0.000 FVL2=FVL3 17.640 0.000
T his table represents the OLS regression results for two subsamples. Panel A includes all banks in EU 15 states while Panel B comprises all other European banks, i.e. banks from new EU member states and EFT A states. T he sample period spans from 2006 to 2010. NFVA (NFVL) is non-fair value assets (liabilites). FVA1 (FVL1), FVA2 (FVL2), and FVA3 (FVL3) represent fair value assets (liabilities) of the three different hierarchy levels. NI is the net income. All variables are on a per share basis. T he standard errors are clustered to control for fixed effects (Petersen (2009)).
Tables 34
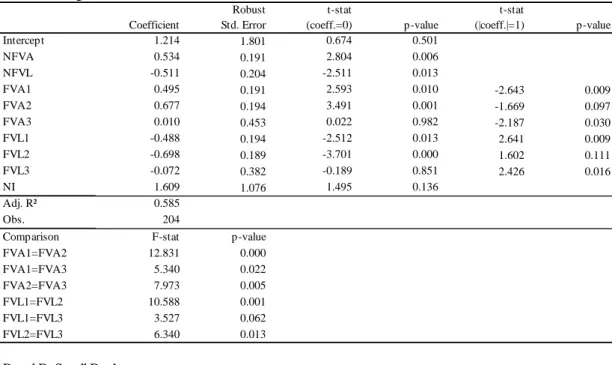
Table 5: Value Relevance of Fair Value Assets and Liabilities: Large and Small Banks Dependent Variable: Share Price (fiscal year end + three months)
Panel A: Large Banks
Coefficient Robust Std. Error t-stat (coeff.=0) p-value t-stat (|coeff.|=1) p-value Intercept 1.214 1.801 0.674 0.501 NFVA 0.534 0.191 2.804 0.006 NFVL -0.511 0.204 -2.511 0.013 FVA1 0.495 0.191 2.593 0.010 -2.643 0.009 FVA2 0.677 0.194 3.491 0.001 -1.669 0.097 FVA3 0.010 0.453 0.022 0.982 -2.187 0.030 FVL1 -0.488 0.194 -2.512 0.013 2.641 0.009 FVL2 -0.698 0.189 -3.701 0.000 1.602 0.111 FVL3 -0.072 0.382 -0.189 0.851 2.426 0.016 NI 1.609 1.076 1.495 0.136 Adj. R² 0.585 Obs. 204
Comparison F-stat p-value FVA1=FVA2 12.831 0.000 FVA1=FVA3 5.340 0.022 FVA2=FVA3 7.973 0.005 FVL1=FVL2 10.588 0.001 FVL1=FVL3 3.527 0.062 FVL2=FVL3 6.340 0.013
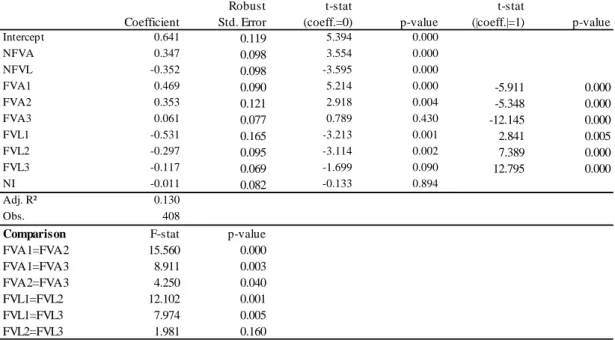
Panel B: Small Banks
Coefficient Robust Std. Error t-stat (coeff.=0) p-value t-stat (|coeff.|=1) p-value Intercept 6.448 0.929 6.937 0.000 NFVA 0.929 0.119 7.807 0.000 NFVL -0.979 0.129 -7.574 0.000 FVA1 0.978 0.120 8.118 0.000 -0.182 0.855 FVA2 0.883 0.122 7.236 0.000 -0.962 0.337 FVA3 0.868 0.140 6.219 0.000 -0.944 0.347 FVL1 -0.673 0.309 -2.179 0.031 1.058 0.291 FVL2 -0.894 0.117 -7.650 0.000 0.903 0.368 FVL3 -0.931 0.145 -6.433 0.000 0.480 0.632 NI -0.238 0.082 -2.893 0.004 Adj. R² 0.648 Obs. 204
Comparison F-stat p-value FVA1=FVA2 12.680 0.000 FVA1=FVA3 4.617 0.033 FVA2=FVA3 0.069 0.793 FVL1=FVL2 0.208 0.649 FVL1=FVL3 0.275 0.601 FVL2=FVL3 0.290 0.591
T his table represents the OLS regression results for two subsamples partitioned by total assets. Panel A comprises large banks, i.e. banks with total assets above median value. Panel B comprises all banks with total assets below median value. T he sample period spans from 2006 to 2010. NFVA (NFVL) is non-fair value assets (liabilites). FVA1 (FVL1), FVA2 (FVL2), and FVA3 (FVL3) represent fair value assets (liabilities) of the three IFRS 7 hierarchy levels. NI is the net income. All variables are on a per share basis. T he standard errors are clustered t o control for fixed effects (Petersen (2009)).