A statistical time series analysis of hydro-climatic stress
on karst aquifer system (Switzerland)
Francesco Kimmeier1
, Mahmoud Bouzelboudjen1 , Laurent Eisenlohr2, Yvan Rossier3, François Zwahlen1 1
CHYN - Centre d'Hydrogéologie, Université de Neuchâtel, Emile-Argand 11, 2007 Neuchâtel, Suisse
2
CETE Environnement, 25 avenue François Mitterrand, Case n° 1 F-69674 BRON Cedex France
3
ATE, 17 rue du Perigord, 69330 Meyzieu, France.
ABSTRACT
In order to determine the impact of climatic variations on several spring discharge, five karst aquifer systems were chosen in the Neuchâtel Jura (three basins over an area of 359 km2) and in the Prealps (2 basins of 4 and 10 km2 respectively). The records of air temperature, precipitation and groundwater discharge vary between 13 and 91 years. Statistical trend analyses (Kendall and Spearman tests) and correlation and spectral analyses have been used to analyze these records. The aim of this paper is not to generalize the results to all karstic aquifers in Switzerland but to answer the three following questions : (i) is there a trend at a given station for given parameters ?, (ii) are the trends the same for the different stations ?, (iii) and finally can we detect the impact of possible climatic changes on the natural responses of five karst springs in the Jura and Prealps ? For the Neuchâtel Jura, a regional trend of rising air temperature has been demonstrated. This is marked by two successive increases in 1945 and 1980. In the Prealps of Vaud, this trend is less well defined. Only the increase in the 1980's has been locally detected. The statistical study of precipitation shows its random character at the regional scale of the Neuchâtel Jura and Prealps. The trend of a reduction in groundwater discharge at Champs-du-Moulin in the Areuse basin is visible since 1945. It is part of a regional trend towards lower discharge, no trend has been observed at the La Doux and Noiraigue Springs. In the Prealps, a rising trend has been observed at Les Avants Spring since 1976 and a falling trend in discharge can be identified at Grandchamp Spring since 1988. Despite the fact that in certain cases, there has been a coincidence between the beginning of temperature increase and of falling discharge, the trends shown do not allow us to state that the only cause is that of climatic changes
Keywords : Climatic changes, statistics, karstic aquifer, Neuchâtel Jura, Vaud
Prealps.
1. INTRODUCTION
For over a decade, global studies have shown an increase in the concentration of carbon dioxide and rare gases [Watts 1980; Clark 1982]. One of the consequences of these increases is a climatic evolution shown by an increase in temperature [Kellogg 1979; Berger 1981; Manabe 1983; Flohn & Fantechi 1984; Sadourny 1992; Marsh and al. 1994], a change in precipitation patterns [Manabe & Stouffer 1980;
Washington & Mehl 1983] and finally a variation in the parameters linked to solar insolation [Chou and al. 1982].
At a global scale, an increase in the average air temperature has been shown for this century (Fig. 1). This increase began around 1925 and stabilized between 1945 and 1980. Since 1980, the mean air temperature changed constantly until 1994 [Hadley Centre, Meteorological Office, UK, 1994].
Figure 1 : Variation of the average air temperature at the globe surface during the 136 last years [Hadley 1994].
It is only recently that studies have attempted to show evidence at regional or local scales of the effect of climatic variations on water resources [Gleick, 1989; Bultot and al. 1988, 1992; Kite 1989; Chahine 1992; Szentimrey and al. 1992]. These studies do not mention the effect of climatic variations on aquifers. However, some studies do consider the impact of climatic variations on groundwater resources at a continental scale [Zekter & Loaiciga, 1993]. In England, Wilkinson & Cooper [1993] and Cooper and al. [1995] have studied the impact of climatic variations on highly idealized aquifers. The aim of this paper is not to generalize the results to all karstic aquifers in Switzerland but to answer the three following questions : (i) is there a trend at a given station for given parameters ?, (ii) are the trends the same for the different stations ?, (iii) and finally can we detect the impact of possible climatic changes on the natural responses of five karst springs in the Jura and Prealps ?
2. MATERIALS AND METHODS
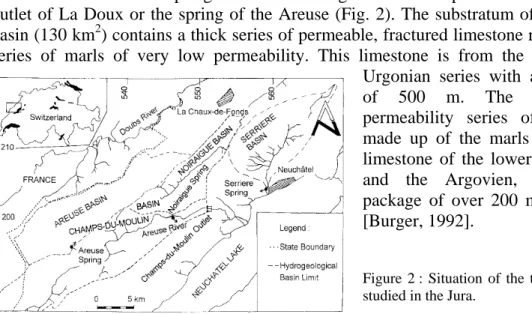
The statistical study of trends and cycles is on two distinct regions. The first is situated in the Neuchâtel Jura (359 km2 - Fig. 2) and the second in two small drainage basins of less than 10 km2 each in the Prealps of Vaud (Fig. 3). This type of aquifer reacts very quickly to variations in infiltration. Residence times and renewal times for groundwater in karst are effectively short. In the Neuchâtel Jura, we have used the data for the springs of the Areuse (outlet of the La Doubs), of the Noiraigue spring and of the Areuse river at the level of Champs-du-Moulin (Fig. 2). For the Prealps, two springs, Les Avants and Grandchamp, have been used (Fig. 3).
-0.60 -0.50 -0.40 -0.30 -0.20 -0.10 0.00 0.10 0.20 0.30 0.40 0.50 1858 1862 1866 1870 1874 1878 1882 1886 1890 1894 1898 1902 1906 1910 1914 1918 1922 1926 1930 1934 1938 1942 1946 1950 1954 1958 1962 1966 1970 1974 1978 1982 1986 1990 1994 C°
2.1 Brief geological and hydrogeological description of the aquifers studied 2.1.1 Neuchâtel Jura
The Areuse begins in the western part of the Val-de-Travers, an important valley of the Neuchâtel Jura. Its spring is near the village of Saint-Sulpice and is called the outlet of La Doux or the spring of the Areuse (Fig. 2). The substratum of the spring basin (130 km2) contains a thick series of permeable, fractured limestone resting on a series of marls of very low permeability. This limestone is from the
Sequanien-Urgonian series with a thickness of 500 m. The very low permeability series of marls is made up of the marls and marly limestone of the lower Sequanien and the Argovien, making a package of over 200 m thickness [Burger, 1992].
Figure 2 : Situation of the three aquifers studied in the Jura.
The geological situation of the Noiraigue basin is identical to the one of the basin of the Areuse spring. The karst basin of the Noiraigue spring is in the 'Haut Jura' (80 km2). The fold structure of the region allows the basin's limits to be defined. To the northwest, it is bordered by the Tremalmont-Sommartel anticline and to the southeast, by the Mont-Racine - Tête de Ran anticline [Morel 1976]. The Noiraigue basin is in the synclinal valley of Ponts-de-Martel. The karst spring of the Noiraigue flows into the Areuse (Fig. 2). The outlet considered for the Areuse drainage basin (359 km2) is at Champs-du-Moulin (Fig. 2).
2.1.2 Prealps
The karst spring of Les Avants (Fig. 3) has its source in Lower Liassic limestone. The drowned zone of the aquifer stretches from the lower to mid Liassic. It has been exploited since the last century. In the basin, there is only a slight cover of unconsolidated material [Mornod 1951].
The spring of Grandchamp is found at the southern end of the Rochers de Naye syncline, inclined to the SW towards Leman Lake (Fig. 3). The reservoir rock is made up of strongly fractured limestone formations and marly limestone of the Malm and Cretaceous of a thickness of 500 m [Gagnebin 1944].
Figure 3 : Situation of the two aquifers studied in the Prealps.
2.2 Hydroclimatological observations
Air temperature and precipitation data for 19 meteorological stations have been analyzed over the two regions of this study (Fig. 4 and Tab. 1). For the same regions, we have investigated groundwater discharge at outlet heads (Tab. 2).
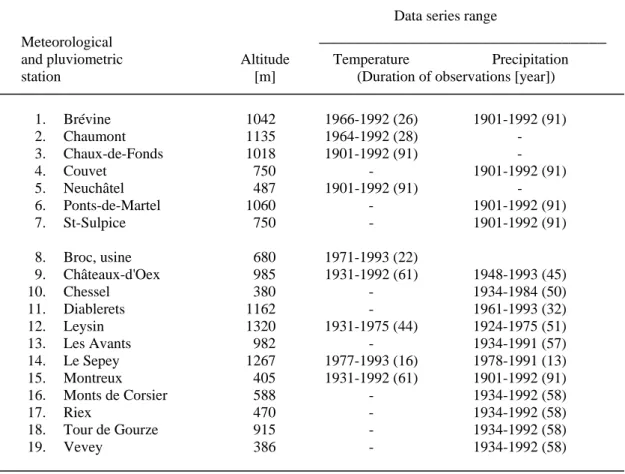
Table 1 : Characteristics of the 19 air temperature and precipitation measurement stations used in this study. Neuchâtel Jura, stations 1 to 7 and Prealps of Vaud, stations 8 to 19.
Data series range Meteorological
and pluviometric Altitude Temperature Precipitation
station [m] (Duration of observations [year])
1. Brévine 1042 1966-1992 (26) 1901-1992 (91) 2. Chaumont 1135 1964-1992 (28) - 3. Chaux-de-Fonds 1018 1901-1992 (91) - 4. Couvet 750 - 1901-1992 (91) 5. Neuchâtel 487 1901-1992 (91) - 6. Ponts-de-Martel 1060 - 1901-1992 (91) 7. St-Sulpice 750 - 1901-1992 (91) 8. Broc, usine 680 1971-1993 (22) 9. Châteaux-d'Oex 985 1931-1992 (61) 1948-1993 (45) 10. Chessel 380 - 1934-1984 (50) 11. Diablerets 1162 - 1961-1993 (32) 12. Leysin 1320 1931-1975 (44) 1924-1975 (51) 13. Les Avants 982 - 1934-1991 (57) 14. Le Sepey 1267 1977-1993 (16) 1978-1991 (13) 15. Montreux 405 1931-1992 (61) 1901-1992 (91) 16. Monts de Corsier 588 - 1934-1992 (58) 17. Riex 470 - 1934-1992 (58) 18. Tour de Gourze 915 - 1934-1992 (58) 19. Vevey 386 - 1934-1992 (58)
Data source : Meteorological Swiss Institut, Bern.
________________________________
Figure 4 : Situation of the mea-surement stations in the Neuchâtel Jura and Prealps of Vaud for the statistical study of pre-cipitation and air tempe-rature (see Tab. 1).
Switzerland
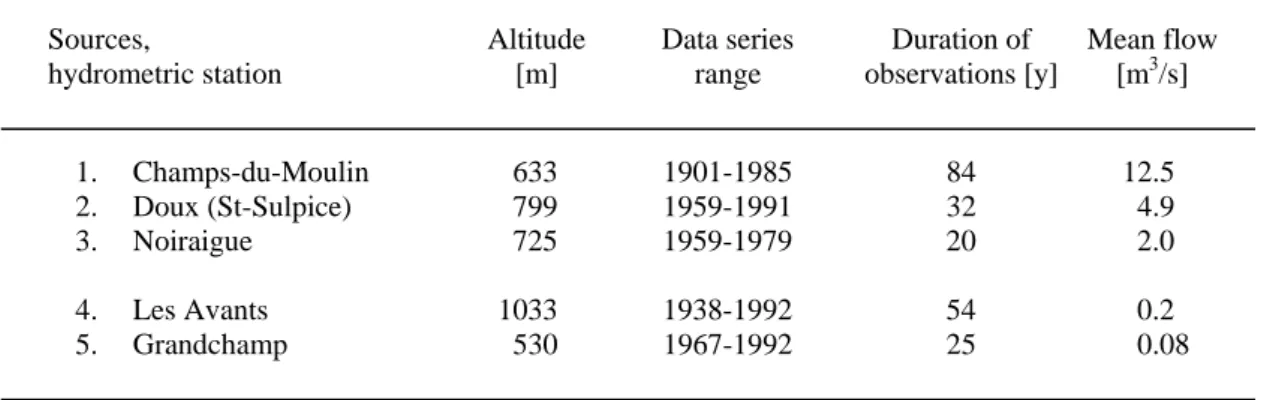
Table 2 : Characteristics of the 5 discharge measurement stations used in this study. Neuchâtel Jura, stations 1 to 3 and Prealps of Vaud, stations 4 and 5.
Sources, Altitude Data series Duration of Mean flow
hydrometric station [m] range observations [y] [m3/s]
1. Champs-du-Moulin 633 1901-1985 84 12.5 2. Doux (St-Sulpice) 799 1959-1991 32 4.9 3. Noiraigue 725 1959-1979 20 2.0 4. Les Avants 1033 1938-1992 54 0.2 5. Grandchamp 530 1967-1992 25 0.08 Data source :
a) Hydrological Swiss year-books. Federal Office of Environment, Forest and Landscape. Bern. OFEG since 1999 (1, 2 and 3).
b) Water supply of Vevey and Montreux (4 and 5).
2.3 Tools used for the analysis of chronological records
The study of the behavior of a time series is based on trend and cycle recognition well described in details in [Sneyers, 1975; Box & Jenkins; 1974]. For trends, two non-parametric statistical tests are used. The first is based on the Spearman rs coefficient and the second on the correlation rank t statistic by Kendall [Sneyers, 1975]. For cycles, and to a lesser extent to find trends, correlatory and spectral analysis is used [Box & Jenkins, 1974; Mangin, 1984].
3. RESULTS OF STATISTICAL TESTS ON THE CLIMATIC AND
HYDROLOGIC OBSERVATIONS
3.1 Air temperature in the Areuse basin
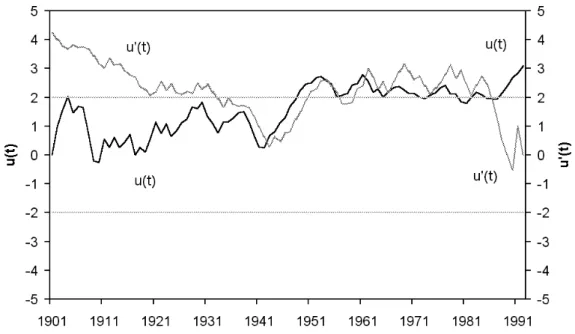
The Spearman and the Kendall statistical treatments of air temperature data of 3 out of 4 stations show changes. The variations are positive, with trends of rising air temperature (Tab. 3). In this centuries records from Neuchâtel the rising trend is noticeable from 1945 onwards (Fig. 5). From the short duration records we can detect an increase in temperature from 1987-88 for example at Chaumont. The correlograms show a cyclicity of the order of 6 years. It is worthwhile analyzing the autocorrelation function at the root of the correlogram. For Neuchâtel, the rapid drop of the autocorrelation function shows that the temperature evolution is not gradual. This is further confirmed by statistical tests that show a rapid rise in temperature between 1945 and 1955 followed by a more stable period (Fig. 5). Spectral analysis shows a periodicity of 6 to 7 years for all stations. The large amplitudes at the beginning of the spectra corroborate the presence of a long-term trend.
This analysis shows a trend of temperature increase over the whole basin and its edges. This evolution is not uniform. The eastern part of the basin shows a rapid
change, which stabilizes from 1945 and begins again from 1987-1988. The western part shows a continuous rising trend in temperature from 1945.
3.2 Air temperature in the Prealps basins
The results of statistical tests show that of the five stations studied, only two show a trend of rising air temperature. There is a significant trend of rising temperature from 1987-88 for the stations at Château-d'Oex and Broc. The records at Montreux show a strong rise in temperature from 1944 to 1953. Beyond this, the temperature pattern is random. At Leysin and Sepey, the pattern is also totally random. The cyclicity of temperature shown by spectral analysis shows different cyclicities for the five stations, from 3 years at Château-d'Oex to 20 years at Montreux (Tab. 4). The rising air temperature trend in the Prealps is not as significant as that in the Neuchâtel Jura. Effectively, in this region only two of the five climatic stations show a clear rising trend. The cyclicities shown from the statistical analyses may hide rising air temperature trends.
3.3 Precipitation in the Areuse Basin
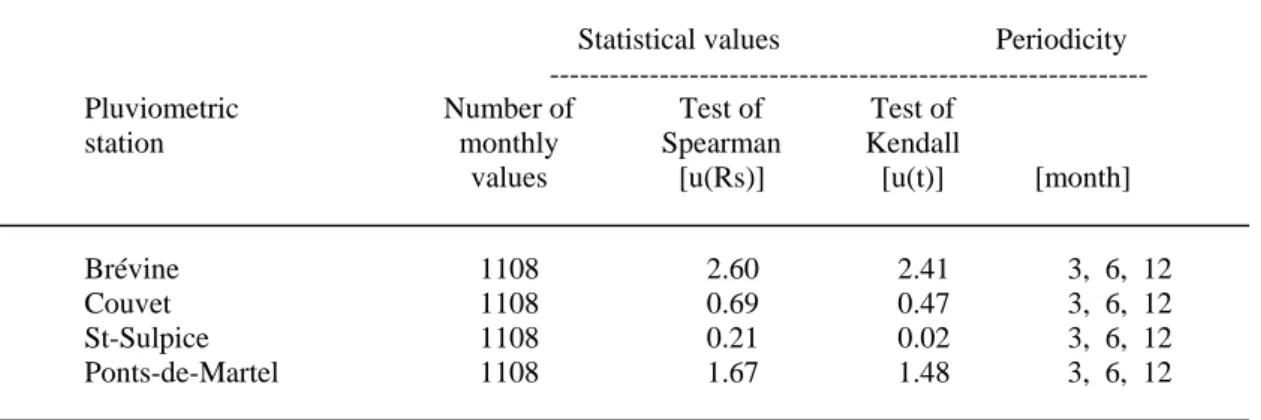
With the exception of precipitation records of the Brévine, the other 3 sets of records from Couvet, Saint-Sulpice, and Ponts-de-Martel show clearly the random character of precipitation over the 92 years period (Tab. 5). No clear long-term trend can be identified. The station at La Brévine is the exception. Since 1976 there has been an increasing trend. Correlation analysis confirms the random nature of the records from Couvet, Saint-Sulpice and Ponts-de-Martel. Peaks indicating the presence of cycles appear for spectral analyses from all four stations. The period is identical for all stations (frequencies 0.08 and its harmonics 0.16 and 0.32 in other words 3, 6 and 12 months) showing a regional similarity for precipitation. For La Brévine, the large initial amplitude of the spectrum reinforces the non-random character shown by Kendall's test. The reason for this anomalous result is difficult to explain with the current state of our knowledge.
Figure 5 : Progressive values for the Kendall test for average annual air temperature at the Neuchâtel station (Canton of Neuchâtel, Switzerland, observation period 91 years).
3.4 Precipitation in the Prealps basins
From the 11 yearly records studied, Kendall's test shows a rising trend for three stations (Tab. 6). The rise can be seen for, Montreux, Vevey and Les Diablerets station since 1969, 1965 and 1955 respectively. The very rapid drop in the autocorrelation function for the three stations shows that the rise in precipitation is non-progressive. Spectral analysis of rainfall data shows cycles of 3 years for Chessel and 33 years for Monts de Corsier (Tab. 6). For the majority of the stations we see a 4 years period for precipitation in this region of the Prealps. Based on the statistical results for the Jura and the Prealps, we find that the changes in rainfall are of random character (e.g. Les Avants station, Fig. 6) at a regional scale. However, at a local scale, the rainfall can show a rising trend as well as a periodicity of several years.
3.5 Statistical stud y of basin responses : spring discharge
Rainfall is a random quantity at a regional scale, as there is no clear trend over time. By contrast, air temperature increases even if the observed periodicity sometimes tends to disguise the rising trend. In order to interpret these results in terms of the groundwater budget of aquifer systems, it is necessary to link the variable response at the outlets to these climatic parameters.
3.5.1 Areuse Basin
The Spearman and the Kendall tests for La Doux and Noiraigue stations indicate that discharge values show no trend (Tab. 7). By contrast, at Champs-du-Moulin, the effect is no longer random as there has been a falling trend in discharge values since 1945 (Fig. 7, Tab. 7). The spectral analysis for the three stations shows an annual cycle : the hydrological cycle. More detailed analysis of the initial amplitudes of the spectra distinguishes peaks which pick out the longest periodicity. For the Areuse at Champs-du-Moulin, the high amplitude at the beginning of the spectrum confirms the existence of a trend. We observe a 15 years period for the stations at
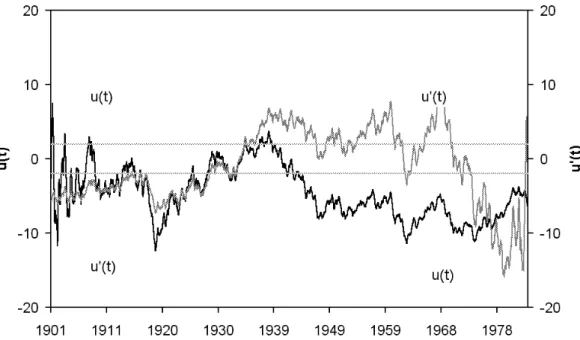
Champs-du-Figure 6 : Progressive values for the Kendall test for average monthly precipitation at the Les Avants station (Canton of Vaud, Switzerland, observation period 51 years).
Moulin and La Doux. This periodicity can also be seen on the Kendall diagrams. The cycle detected for the Noiraigue spring is of approximately 9 years, which we can also see on the Kendall diagrams. The analysis of the discharge at the main outlet of the Areuse at Champs-du-Moulin shows a clear falling trend since 1945. The presence of cycles of large periodicity (9 and 15 years for the Areuse and Noiraigue springs respectively) could hide or modify possible long-term trends.
3.5.2 Prealps
The two discharge records analyzed show a long-term trend. This is rising for the spring at Les Avants and falling for Grandchamp (Tab. 8). According to the results of Spearman and Kendall tests, a rising trend is seen since 1976 at Les Avants. The falling trend can be seen from 1988 at Grandchamp. Spectral analysis of spring discharge at Les Avants shows a cycle of 15 to 16 years.
4. CONCLUSIONS
We have chosen aquifer systems in two regions with long hydroclimatological records (precipitation and temperature) in order to statistically show the impact of climatic changes on karst spring discharge [Bouzelboudjen, Kimmeier & al. 1998].
Temperature : For the Areuse Basin (359 km2) at
a regional scale, there is a rising trend in temperature (Fig. 8a). In the region, we have shown two successive rises (around 1945 and 1988, worldwide two rises are observed around 1925 and 1980). For the two basins in the Prealps (from 4 to 10 km2) these two trends could not be precisely identified (Fig 8a).
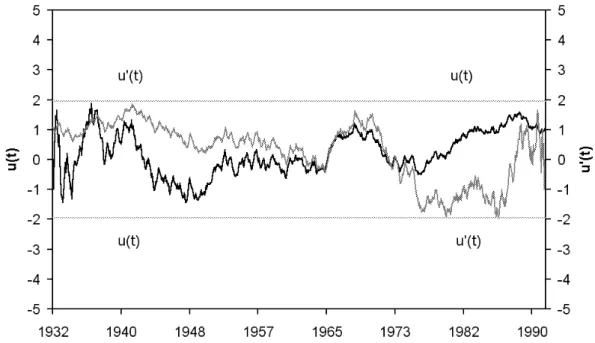
Figure 7 : Progressive values for the Kendall test for average daily discharge at the Champs-du-Moulin station (Canton of Neuchâtel, Switzerland, observation period 84 years).
Precipitation : Precipitation in the Areuse basin has
a random character at a regional scale, but at a local level, we can identify a rising trend for one station. We find the same situation in the Prealps where 3 of 11 stations have a rising trend (Fig 8b).
Discharge : There is a significant fall of discharge
for the Champs-du-Moulin outlet from 1945. The statistical results are not so unequivocal in the Prealps. At Les Avants discharge increase whilst at Grandchamp, they decrease (Fig 8c).
In this study, the aquifer system (simulated as a black box) is implicitly invariant. The terms appearing
in the groundwater budget of the aquifer systems are of two orders, infiltration and groundwater discharge. The influence of vegetation and of soil type effectively plays a part on the potential water infiltration. Human activity can equally change the supply as well as the exits of water, e.g. evolution of drainage density (e.g. peat harvesting), of urban areas, of crop types and of pumping for water supply requirements. The history of this sort of data over centuries is not available or in the best cases, available data is rudimentary. The two sites chosen in the Neuchâtel Jura and in the Prealps are either in mountainous areas or regions with very little industrial activity.
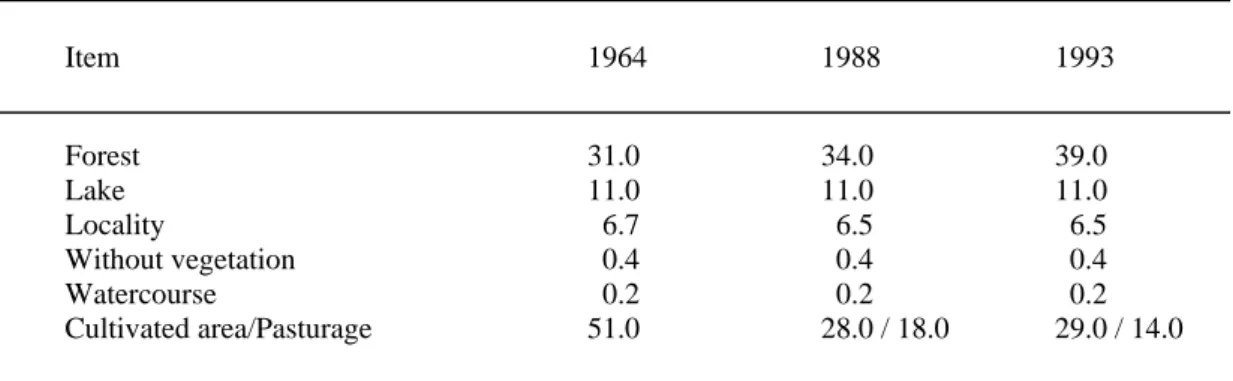
In the Neuchâtel Jura, the available information shows that for 30 years, the forest cover has encroached on arable and pasture land (Tab. 9) . This change in soil use is nevertheless small. Even if its influence on water infiltration is difficult to quantify, in our opinion it is negligible. In the Prealps, no data is available on the change in land use. Extraction linked to human activity (mainly pumping) has changed very little over the last century. The data collected from the Neuchâtel Jura show that if the number of inhabitants has fallen, pumping remains effectively constant. Furthermore, the quantity of underground flows extracted in the basin remains very low compared to the discharge at Champs-du-Moulin : 390 millions of m3/yr (12.5 m3/s) discharge at this station (average for the period 1901-1985) against about 0.3 million of m3/yr (less than 1‰) of extracted water in the Val-de-Travers (average of the last 20 years). In the Prealps, human activity (agricultural and industrial) is very reduced. Finding rising or falling trends for discharge in the Areuse Basin and in the Prealps is not sufficient to state that this is the result only of climatic changes.
Figure 8 b : Precipitation
Table 3 : Values of the Kendall and Spearman statistical tests for air temperature measurements in the Neuchâtel jura.
Statistical values Periodicity
---
Temperature Number of Test of Test of
measurement annuel Spearman Kendall
station values [u(Rs)] [u(t)] [year]
Brévine 27 3.15 3.02 6, 7
Chaumont 29 2.44 2.25 6, 7
Chaux-de-Fonds 92 1.81 1.9 6, 7
Neuchâtel 92 3.55 3.09 6, 7
Up trend > 1.96, down trend <-1.96
Table 4 : Values of the Kendall and Spearman statistical tests for air temperature measurements in the Prealps of Vaud.
Statistical values Periodicity
---
Temperature Number of Test of Test of
measurement annuel Spearman Kendall
station values [u(Rs)] [u(t)] [year]
Broc 23 2.56 2.19 7
Châteaux-d'Oex 62 3.13 2.78 3
Le Sepey 17 1.48 1.73 6
Leysin 45 -0.36 -0.78 14
Montreux 62 1.14 0.54 8, 20
Up trend > 1.96, down trend <-1.96
Table 5 : Values of the Kendall and Spearman statistical tests for precipitation measurements in the Neuchâtel Jura.
Statistical values Periodicity
---
Pluviometric Number of Test of Test of
station monthly Spearman Kendall
values [u(Rs)] [u(t)] [month]
Brévine 1108 2.60 2.41 3, 6, 12
Couvet 1108 0.69 0.47 3, 6, 12
St-Sulpice 1108 0.21 0.02 3, 6, 12
Ponts-de-Martel 1108 1.67 1.48 3, 6, 12
Table 6 : Values of the Kendall and Spearman statistical tests for precipitation measurements in the Prealps of Vaud.
Statistical values Periodicity
---
Pluviometric Number of Test of Test of
station annual Spearman Kendall
values [u(Rs)] [u(t)] [year]
Châteaux-d'Oex 46 1.03 1.01 7 Chessel 51 0.67 0.50 3, 5, 15 Diablerets 75 3.24 3.22 4, 7 Leysin 55 -0.10 -0.11 4 Les Avants 60 1.15 0.98 4, 14 Le Sepey 14 -1.13 -1.04 - Montreux 92 4.13 4.06 4 Monts de Corsier 58 1.59 1.36 4, 33 Riex 59 0.19 0.06 4, 17 Tour de Gourze 59 0.66 0.51 4, 20 Vevey 59 2.83 2.74 4
Up trend > 1.96, down trend <-1.96
Table 7 : Values of the Kendall and Spearman statistical tests for discharge measurements in the Neuchâtel Jura.
Statistical values Periodicity
---
Limnigraphic Number of Test of Test of
station daily Spearman Kendall
values [u(Rs)] [u(t)] [year]
Champs-du-Moulin 34230 -5.75 -6.4 1, 15
Doux (St-Sulpice) 12053 0.86 0.62 1, 15
Noiraigue 7670 1.29 0.75 1, 9
Up trend > 1.96, down trend <-1.96
Table 8 : Values of the Kendall and Spearman statistical tests for discharge measurements in the Prealps of Vaud.
Statistical values Periodicity
---
Limnigraphic Number of Test of Test of
station daily Spearman Kendall
values [u(Rs)] [u(t)] [year]
Les Avants 20089 4.13 3.78 1, 5, 16
Grandchamp 9497 -4.56 -4.64 1, 2, 9
Table 9 : Landuse evolution between 1964 and 1993 in the Neuchâtel Jura. Item 1964 1988 1993 Forest 31.0 34.0 39.0 Lake 11.0 11.0 11.0 Locality 6.7 6.5 6.5 Without vegetation 0.4 0.4 0.4 Watercourse 0.2 0.2 0.2 Cultivated area/Pasturage 51.0 28.0 / 18.0 29.0 / 14.0
Values in % (Source : Federal Office of Swiss Statistics)
Acknowledgments : This study was funded by the Swiss National Foundation for Scientific Research
in the framework of National Research Programme NRP 31. Climate changes and natural disasters (research project N° 4031-33148).
5. REFERENCES
Berger, A., 1981. Climatic variations and variability : Facts and Theories. Nato advanced Study Institutes Series. Serie C : Mathematical and Physical Sciences. Reidel, Dordrecht, 795 p.
Bouzelboudjen, M., Kimmeier, F., Eisenlhor, L., Rossier, Y., Zwahlen, F., 1998. Impact des changements climatiques sur le comportement des systèmes aquifères. Rapport final du projet PNR 31, v/d|f-ETH Zürich. 116 p., 46 fig., 24 tabl.
Box, G.E.P., Jenkins, G.M 1974. Time series analysis : forecasting and control. Holden-Day, San Francisco, California, 575 p.
Bultot, F., Coppens, A., Dupriez, G.L., Gellens, D., Meulenberghs, F., 1988. Repercussions of a CO2 doubling on the water cycle and on the water balance. A
case study for Belgium. J. Hydrol 99 : 319-347.
Bultot, F., Gellens, D., Spreafico, M., Schädler, B., 1992. Repercussions of a CO2
doubling on the water balance. A case study in Switzerland. J. Hydrol., 137, 199-208.
Burger, A., 1992. Hydrogéologie du bassin de la source de l'Areuse. I.A.H. 13 : 159-177. Heise.
Chahine, M.T., 1992. The hydrological cycle and its influence on climate. Nature 359 : 373-379.
Chou, M.D., Peng, L., Arking, A., 1982. Climate Studies with a multilayer energy Balance Model. Part II : The Role of feedback Mechanisms in the CO2 Problem. J.
Atmos. Sci. 39 : 2657-2666.
Clark, W.C., 1982. Carbon Dioxide Review. Oxford University Press, New York, NY. Cooper, D.M., Arnell, N.W. & Wilkinson, W.B., 1995. The effects of climate changes
on aquifer storage and river base flow. Hydrol. Sci J., 40, 5, 615-631.
Flohn, H., & Fantechi, R. 1984. The Climate of Europe : Past, Rescent and Future. Reidel, Dordrecht, 356 p.
Gagnebin, E., 1944. Etude géologique de la source de Grandchamp. Service des Eaux de Vevey-Montreux. Rapport inédit.
Gleick, P.-H., 1989. Climate change, hydrology and water resources. Rev. Geophys., 27 : 329-344.
Hadley Centre, Meteorological Office, UK, 1994. Bulletin de l'Organisation Mondiale de Météorologie N° 809.
Kellogg, W.W., 1979. Influences of Man kind on Climate. Annu. Rev. Earth Planet Sci. 7 : 63-92.
Kite, G., 1989. Use of time series analysis to detect climatic change. J. Hydrol. 111 : 259-279.
Manabe, S., 1983. Carbon Dioxide and climatic Change. Adv. geophys. 25 : 38-82. Manabe, S. & Stouffer, R.J., 1980. Sensitivity of a global Climate Model to an
increase of CO2 concentration in the Atmosphere. J. Geophys. Res. 85 (610) :
5529-5554.
Mangin, A., 1984. The use of autocorrelation and spectral analyses to obtain a better understanding of hydrological systems. J. Hydrol. 67 : 25-43.
Marsh, T.-J., Monkhouse, R.A., Arnell, N.W., Lees, M.L. & Reynard, N.S., 1994. The 1988-92 Drought. Institute of Hydrology, British Geological Survey, 78 p.
Morel, G., 1976. Bilans hydrologiques mensuels et leur application aux bassins karstiques. Bull. Centre d'Hydrogéologie Univ. Neuchâtel n°1, 101-106.
Mornod, L., 1951. Recherches hydrogéologiques sur la Grande Source des Avants, dans les Préalpes médianes vaudoises. Service des Eaux de Vevey-Montreux. Rapport inédit.
Sadourny, R., 1992. L’homme modifie-t-il le climat. Extrait de : Spécial La Recherche, L’effet de serre Vol. 243, 522-531.
Sneyers, R., 1975. Sur l'analyse des séries d'observations. OMM 415. Note technique 143, pp 3-15.
Szentimrey, T., Farago, T., Szalai, S., 1992. Window technique for climate trend analysis. Climate Dynamics 3/4(6) : 127-134.
Washington, W.M. & Meehl, G.A., 1983. General Circulation Model Experiments on the climatic effects due to a doubling and quadrupling of Carbon Dioxide Concentration. J. Geophys. Res. 88 (611) : 6600-6610.
Watts, R.G., 1980. Climate models and CO2 induced. Climatic Change 2 : 387-408.
Wilkinson, W.-B., Cooper D.-M., 1993. The response of idealized aquifer/river systems to climate change. Hydrological Sciences - J. Sc. Hydrol., 38,5, 379-390. Zektser, I.-S., Loaiciga, H. A., 1993. Groundwater fluxes in the global hydrologic
cycle : past, present and future. J. Hydrol., 144, 405-427.
Corresponding author : Francesco Kimmeier, Institut de Géologie, Centre d'Hydrogéologie, Université de Neuchâtel, 11 rue Emile-Argand, 2007 Neuchâtel. - Tél : +4132/718.26.30- Fax : +4132/718.26.03 - E-mail : francesco.kimmeier@unine.ch
![Figure 1 : Variation of the average air temperature at the globe surface during the 136 last years [Hadley 1994]](https://thumb-eu.123doks.com/thumbv2/123doknet/15024495.684685/2.892.176.708.281.561/figure-variation-average-temperature-globe-surface-years-hadley.webp)