HAL Id: inria-00316297
https://hal.inria.fr/inria-00316297
Submitted on 3 Sep 2008
HAL is a multi-disciplinary open access archive for the deposit and dissemination of sci-entific research documents, whether they are pub-lished or not. The documents may come from teaching and research institutions in France or abroad, or from public or private research centers.
L’archive ouverte pluridisciplinaire HAL, est destinée au dépôt et à la diffusion de documents scientifiques de niveau recherche, publiés ou non, émanant des établissements d’enseignement et de recherche français ou étrangers, des laboratoires publics ou privés.
UNSUPERVISED ONE-CLASS SVM USING A
WATERSHED ALGORITHM AND HYSTERESIS
THRESHOLDING TO DETECT BURNT AREAS
Olivier Zammit, Xavier Descombes, Josiane Zerubia
To cite this version:
Olivier Zammit, Xavier Descombes, Josiane Zerubia. UNSUPERVISED ONE-CLASS SVM USING A WATERSHED ALGORITHM AND HYSTERESIS THRESHOLDING TO DETECT BURNT AR-EAS. Pattern Recognition and Image Analysis (PRIA), Sep 2008, Nijni Novgorod, Russia. �inria-00316297�
1
UNSUPERVISED ONE-CLASS SVM USING A WATERSHED ALGORITHM
AND HYSTERESIS THRESHOLDING TO DETECT BURNT AREAS
1O. Zammit2, X. Descombes2, J. Zerubia2
2
INRIA-I3S, Ariana research group,
2004, route des Lucioles, BP 93, 06902 Sophia Antipolis Cedex, France {olivier.zammit,xavier.descombes,josiane.zerubia}@sophia.inria.fr
This paper addresses the issue of color image classification. Support Vector Machines (SVM) have shown great performances concerning classification problems but require positive and negative training sets. One-Class SVM allow to avoid the negative training set choice. We also propose to automatically select the positive training set by using the watershed algorithm on the 3-D histogram. Finally a hysteresis thresholding allow to improve the cluster edges. Our method is applied to multispectral satellite images in order to assess burnt areas after a forest fire. The results are compared to official ground truths to validate the approach.
Introduction
Remote sensing is a very useful tool for the assessment of burnt areas after a forest fire [1]. Several studies dealing with burnt area mapping are based on the use of multitemporal coarse resolution satellite images [2]. In this study, we propose to use a single post-fire high resolution image.
SVM [4] consist in a supervised classification technique which proved to be more accurate than other classification algorithms in several contexts (biomedical images, pattern recognition, etc.) and more recently in remote sensing [5]. In our previous studies [3], SVM also outperformed traditional classification algorithms for burned area mapping.
SVM aim at splitting data in two classes by finding the separator between some labeled examples. They regard the training and classification processes as a two-class problem, with equal treatments w.r.t positive and negative examples. Concerning our problem of discrimination between burnt and unburnt areas, the burnt pixels have spectral characteristics rather similar, whereas unburnt pixels have much more different ones since they belong to various classes (forest, fields, urban areas, roads, water...).
Thus, we propose to use the One-Class SVM algorithm (OC-SVM) [6], an extension of the
two-class SVM algorithm which enables the training and classification with only positive examples. This will reduce the computational and memory cost to perform the learning and classification tasks.
Nevertheless, we have to provide the positive training examples. To outperform this problem, the color histogram is segmented by the watershed algorithm [7]. Given a single example, the selected positive training set corresponds to the histogram peak which includes this pixel.
Pixels are then classified thanks to their spectral characteristics by the OC-SVM algorithm. The final step consists in taking into account the spatial information by using a hysteresis thresholding [8] to improve the classification.
This paper is organized as follows. In section 2, we present the proposed approach. Section 3 provides the experiments and compares the results to the official ground truths. Last, we conclude in section 4.
Proposed Algorithm
Automatic training set selection
The first step is to select the training set required by the OC-SVM. The proposed process is rather similar to the one given by [9]. The idea is to delineate the histogram peak corresponding to the positive class.
1
Firstly, a 3-D Gaussian filter is applied to the histogram. This smooths the histogram and removes some non-significant local minima. Then, a watershed algorithm [7] is applied to the opposite of the histogram to segment the different histogram peaks.
The watershed algorithm is a morphological algorithm which considers the magnitude as a topographic surface. It gives a partition of an image into catchment basins defined by local minima and which boundaries (called watersheds) correspond to the crest values. Given a single positive sample (burnt pixel), the 3-D corresponding cluster (histogram peak) constitutes the positive training set. Although the single sample choice is crucial to find the real positive peak, it is very easy to select manually a good example if the total burnt area size is not too small.
One-Class Support Vector Machines
Schölkopf et al. [6] recently extended the SVM methodology to handle training using only positive information. The OC-SVM aim at estimating the support that can include most of the positive samples, i.e. finding a function which is positive in a small region capturing most of the data and negative elsewhere. Let
{ }
xi i∈<1,l>r
be the training set withxi ∈ℜm r
. LetΦ be a mapping and K the corresponding kernel:K
(
xri,rxj)
=Φ( )
xri .Φ( )
xrj .The OC-SVM approach is equivalent to find the surface which separates the positive data from the origin at a threshold
ρ
:( )
x =sign(
wΦ( )
x −ρ
)
f r r. r , where
( )
wr,ρ
are the surface parameters (respectively a vector normal to the surface and the bias).The minimization problem is:
∑
= + − l i i w l w 1 2 , , . 1 2 minξ
ν
ρ
ξ ρ rwhere
ν
∈[ ]
0,1 defines the trade-off between the margin and the number of training errors. By introducing the Lagrange multipliers, the quadratic problem is equivalent to:( )
∑ ∑
(
)
= = − = l i l j j i j i K x x W 1 1 , 2 1 maxλ
λ
λ
r r λ( )
l i l t s l i i i 1,0 1 . , 1, . . 1 ∈ ∀ ≤ ≤ =∑
= ν λ λ (1) (1)The solution wr is then given by:
( )
∑
= Φ = l i i xi w 1 r rλ
andρ
is obtained from the constraints:λ
i[
wr.Φ( )
xri −ρ
]
=0. Finally, f( )
x =sign(
∑
il=1λ
iK( )
xi.x −ρ
)
r r r .Then, the classification of unlabeled data xr is inferred from the training examples such that
i
λ
is not null. These vectors are called Support Vectors (SV). Moreover, for the SV such that0<λ
i <1( )
ν
.l , these vectors lies on the separating surface: f( )
xr =0. Vectors such that0
= i
λ
are well classified: f( )
xr >0. The ones such thatλ
i =1( )
ν
.l are misclassified and on the bad side of the surface: f( )
xr <0.Notice that the mapping Φ does not directly interfere with the function f on the contrary of the kernel K. Then, given a kernel K which has to satisfy Mercer condition [10], we do not have to compute the mapping Φ. In this study, we choose the well-known Gaussian kernel:
(
)
(
2( )
2)
2 exp , j i jσ
i x x x x K r r = r − r ,which proved to provide the best results [3].
Hysteresis Thresholding
The hard binary classification defined by the sign of
∑
li=1λ
iK( )
xi.x −ρ
r r
is too restrictive because of the overlap between the negative and positive classes (some burnt pixels can have spectral characteristics similar to the ones of unburnt pixels). Instead of using the threshold value equal to 0, we propose to use a hysteresis thresholding algorithm [8], which uses a pair of threshold, Thigh and Tlow.
All the pixels with classification value above Thigh are immediately classified as positives.
Pixels with classification value below Tlow are
immediately classified as negatives. Pixels with classification value between the two thresholds are classified as positives if they are spatially connected to positive pixels.
Nevertheless, due to noise, some isolated pixels with classification value above Thigh can
be false positives and generate a false positive cluster after the second threshold. Therefore, an erosion procedure [11] is applied to the first segmentation to eliminate these pixels. In the same way, it remains some isolated negative pixels inside the positive clusters. Therefore, a closing procedure [11] is applied to the final segmentation.
1
Experiments and results
Model Selection
The proposed approach performance depends on the parameter choice (ν, σ for the OC-SVM and the two thresholds for the hysteresis). Rätsch et al. [12] proposed a way to choose the OC-SVM parameters by adding few negative points to the training set and selecting the parameters which separate both classes best. There are no general rules for the optimal choice of the two thresholds. However, these thresholds must be in a certain range of values defined by the classifier values of the training set:
{
wr.Φ( )
xri −ρ
}
i∈1,l .Fig. (1) shows the positions of the training set and of the level sets of the OC-SVM classifier, i.e. level sets of wr.Φ
( )
xr −ρ
, in the 2D-case, given a couple of parameters (σ,ν). The red level set represents the OC-SVM separating surface, the blue crosses and rounds respectively correspond to non-SV (lie inside the curve) and the SV (lie on or outside the curve). Acceptable values of Thigh and Tlowrespectively correspond to level sets which includes a little less and a little more training vectors than the zero level set.
Fig. 1. OC-SVM classifier level sets.
Tests on satellite images
Three satellite SPOT 5 images of 10-meter resolution are used in this paper, each of them providing 4 spectral bands (Green, Red, Near Infra-Red and Mid Infra-Red).
However, a Principal Component Analysis shows that the Green and Red bands are almost the same. In this study, we choose not to use the Green band which is the one with the smallest standard deviation.
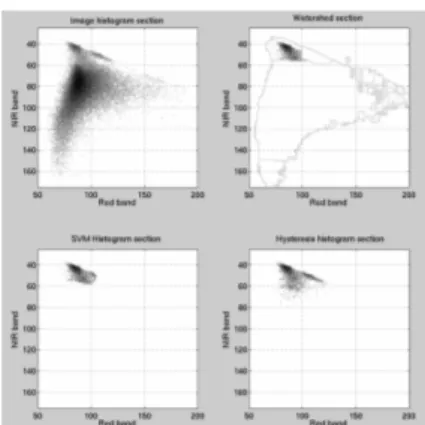
Fig. (2) show some sections of the 3-D histograms for the same Mid Infra-Red value for the following steps: original histogram (top left), watershed algorithm and selected cluster after Gaussian filtering (top right), OC-SVM
Fig. 2. Histogram sections of different steps.
with the training set defined by this cluster (bottom left) and hysteresis (bottom right). The watershed algorithm leads to an over-partitioning of the color space due to local minima which are not smoothed by the Gaussian filter. The OC-SVM allow to merge some basins and gives as output a measurable prediction of the pixel positivity. The hysteresis process uses this measurable prediction to change the cluster edge.
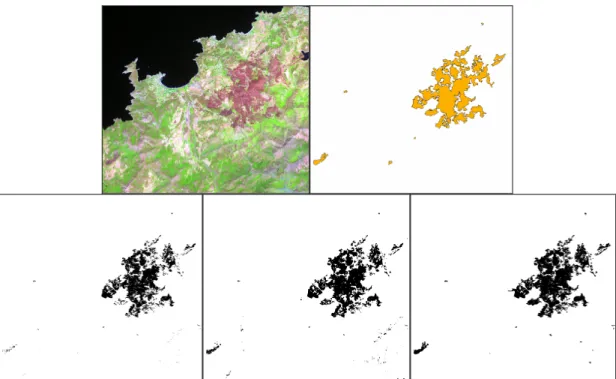
Fig. 3 represents the area of Western Corsica (France), which burnt during the summer 2005. It consists of a 2200*2000 pixels with 3 bands. It shows the satellite image, the corresponding "ground truths" (realized by Infoterra France-ESA from 30-meter resolution Landsat images) and the classifications obtained after the same steps as in Fig. 2. Notice that the histogram and OC-SVM classification maps are regularized by mathematical morphology (opening and closing) to be compared with the final map. Table 1 provides the Overall Accuracy (OA), True Positive (TP) and False Positive (FP) rates for the three steps, in average on the SPOT 5 images.
The OC-SVM fed by the training set selected from the histogram visually provides a better result than the classification by histogram. Moreover, the hysteresis thresholding allows to visually decrease the false positives and to improve the accuracy of the burnt area edges. Notice that the differences between our final map and the Landsat satellite estimate are mainly composed by pixels which lie on the
Table 1. Statistics (in %)
OA TP FP Histogram 98.18 68.98 0.15
OC-SVM 98.33 73.83 0.21 Hysteresis 98.78 84.91 0.40
1
Fig. 3. SPOT 5 Image ©CNES 2005, Distribution SPOT Image (up left), Landsat satellite estimate – projet RISK-EOS ©Infoterra – ESA (up right), Histogram classification (bottom left), OC-SVM (bottom center), Hysteresis (bottom right)
boundaries (due to the registration between two images with different resolutions).
Conclusion
In this paper, we have presented a new color image classification approach based on One-Class Support Vector Machines. The training set is automatically selected from the histogram segmentation. The resulting pixel-based classification is improved by a hysteresis thresholding in order to use both spectral and spatial information. It is applied to the problem of burnt area mapping using a single post-fire high-resolution satellite image and shows great performances.
Acknowledgements
The authors would like to thank the French Space Agency (CNES) for providing satellite images via the ISIS program and Infoterra France - ESA for providing ground truths. We also would like to thank Commandant Poppi (fire brigade member and director of the cartography service, SDIS83, Draguignan, France) for interesting discussions.
References
1. E. Chuvieco. Wildland Fire Danger Estimation and Mapping: The role of Remote Sensing data, volume 4 of Remote Sensing. World Scientific, 2003.
2. P. Barbosa, A. J. San-Miguel, B. Martinez, and G. Schmuck. Burnt area mapping in Southern Europe using IRS-WiFS. In Viegas, editor, Forest Fire
Research & Wildland Fire Safety, Rotterdam, 2002.
Millpress.
3. O. Zammit, X. Descombes, and J. Zerubia. Support vector machines for burnt area discrimination. Research report no6343, INRIA, November 2007.
4. V. Vapnik. Statistical Learning Theory. JohnWiley and sons, inc., 1998.
5. F. Melgani and L. Bruzzone. Classification of hyperspectral remote sensing images with support vector machines. IEEE Trans. Geoscience and
Remote Sensing, 42(8):1778–1790, 2004.
6. B. Schölkopf, J. C. Platt, J. C. Shawe-Taylor, A. J. Smola, and R. C. Williamson. Estimating the support of a high-dimensional distribution. Neural
Computation, 13(7):1443–1471, 2001.
7. L. Vincent and P. Soille. Watersheds in digital spaces: an efficient algorithm based on immersion simulations. IEEE Trans. on Pattern Analysis and
Machine Intelligence, 13(6):583–598, 1991.
8. J. Canny. A computational approach to edge detection. Pattern Analysis and Machine Intelligence, 8(6):679– 698, November 1986.
9. Y. Fang, C. Pan, L. Liu, and L. Fang. Fast training of SVM via morphological clustering for color image segmentation. In International Conference on
Intelligent Computing, pages 263–271, 2005.
10.B. Schölkopf, K. Tsuda, and J. Vert. Kernel Methods in computational biology. MIT Press, 2004. 11.P. Soille. Morphological Image Analysis: Principles
and Applications. Springer-Verlag, 1999.
12.G. Rätsch, B. Schölkopf, S. Mika, and K.-R. Müller. SVM and boosting: One class. Technical report 119, GMD FIRST, November 2000.